GMS location: 965
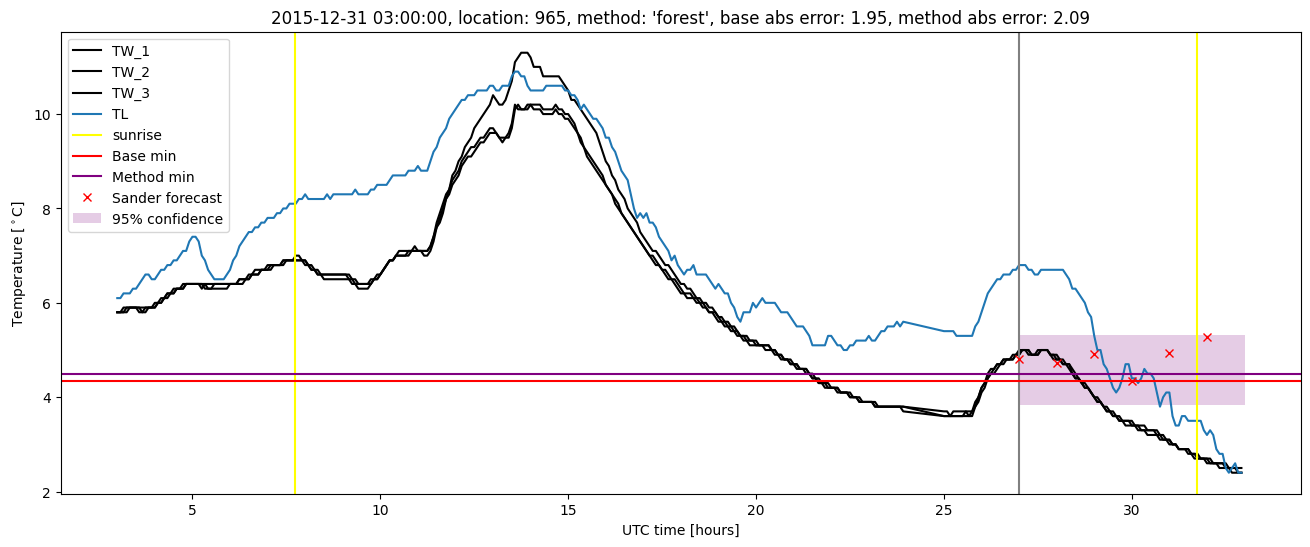
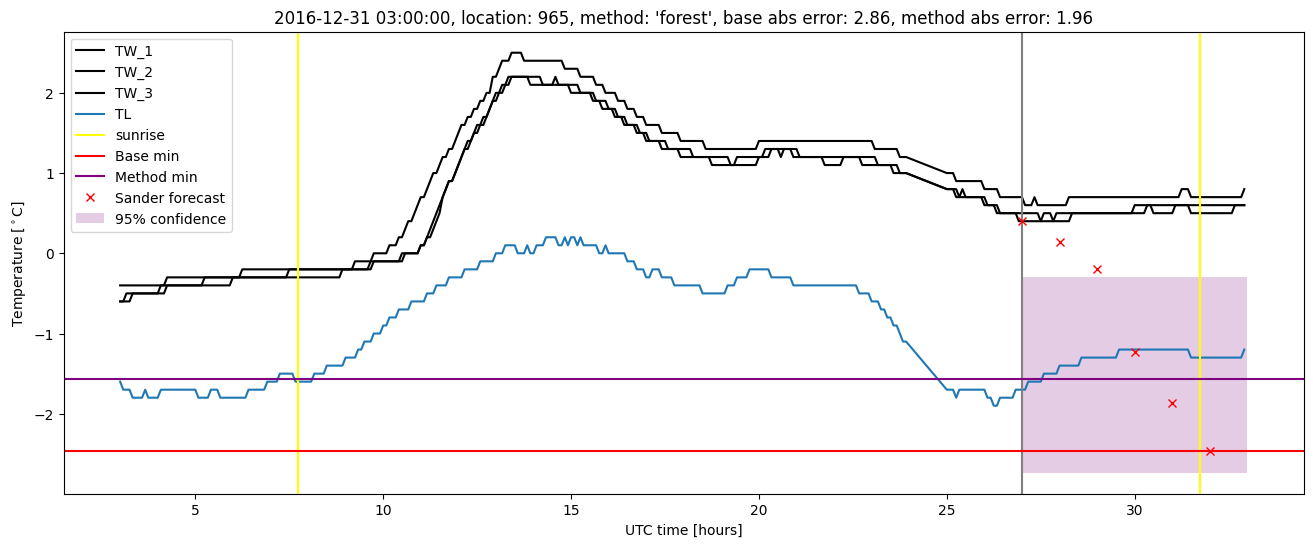
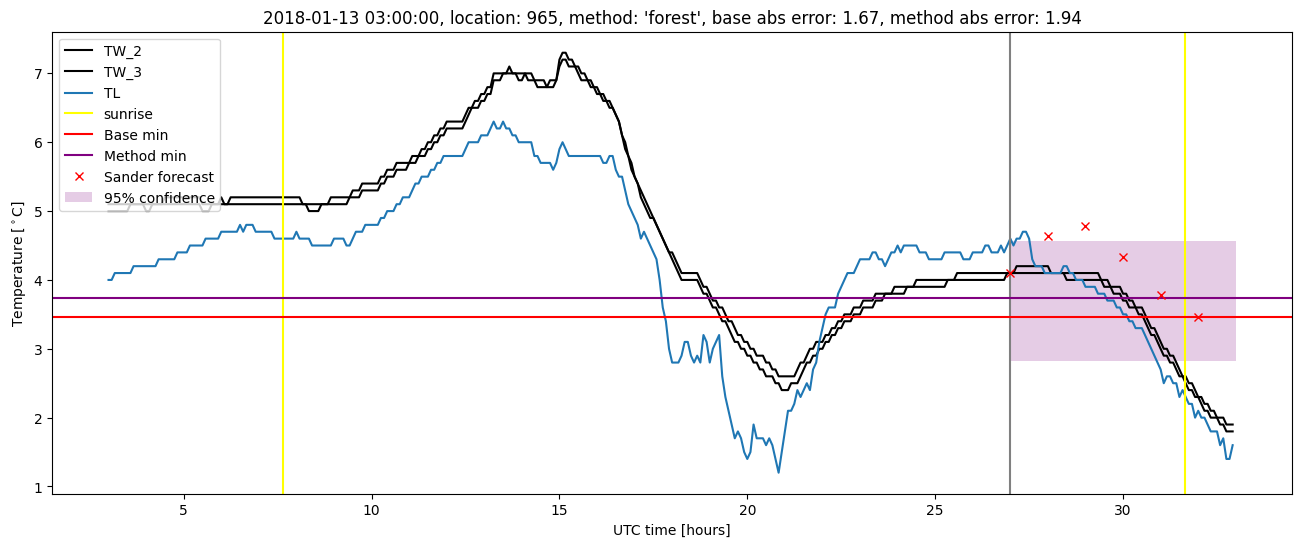
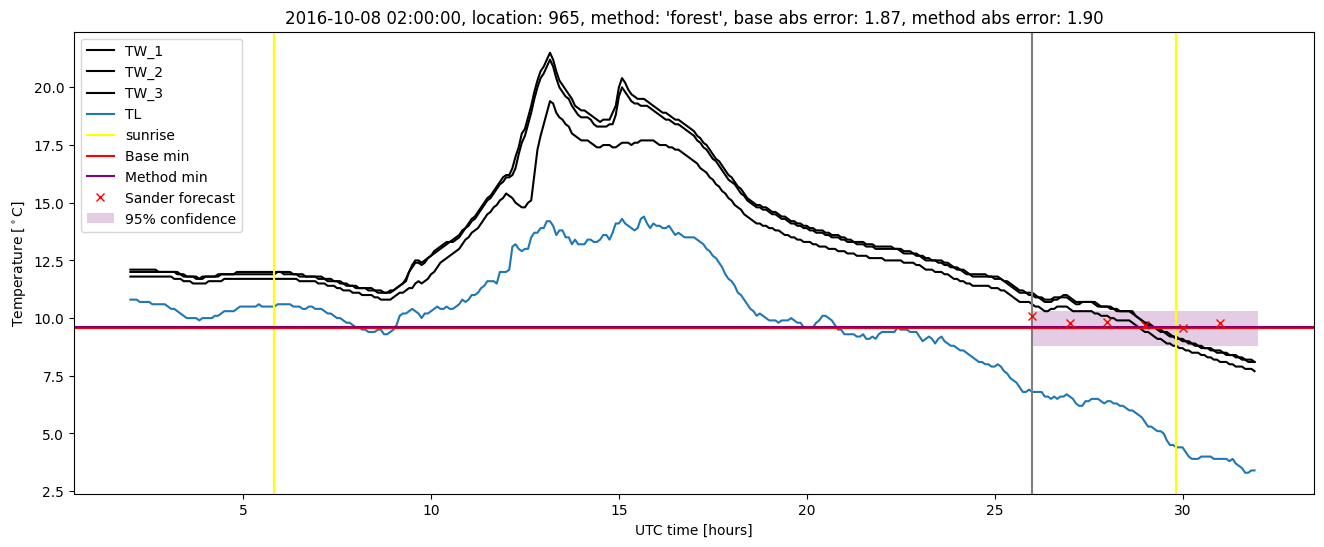
Random forest results
| names |
period |
power |
significance |
meanSquareError |
absError |
maxError |
CRPS |
IGN |
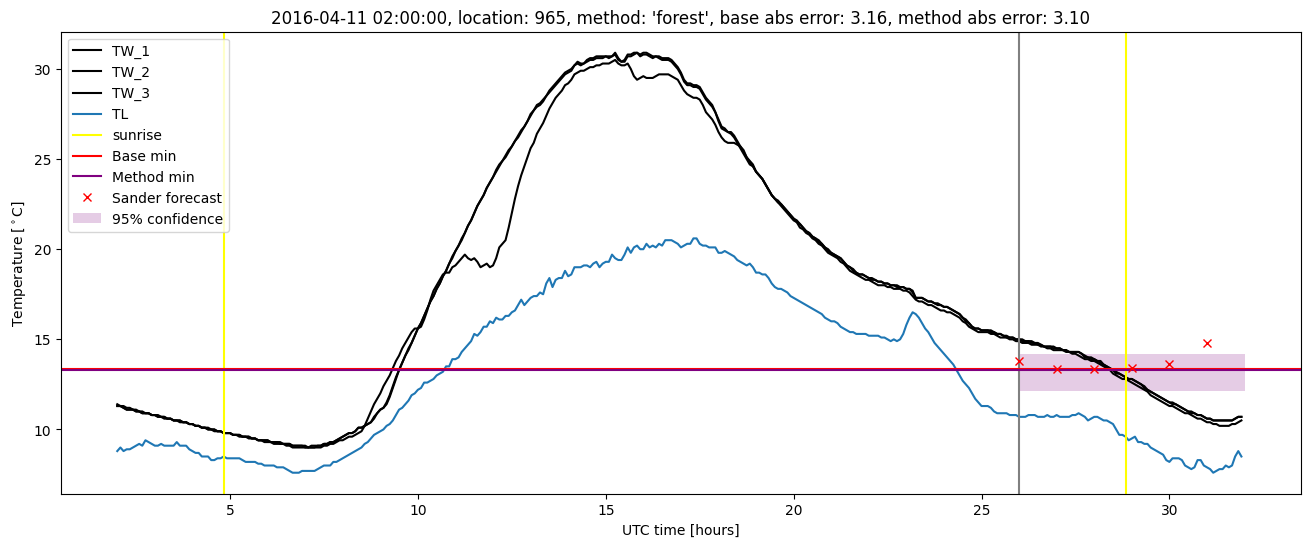
| baseline |
winter 2016 |
0.970 |
0.222 |
0.390 |
0.458 |
3.160 |
NaN |
NaN |
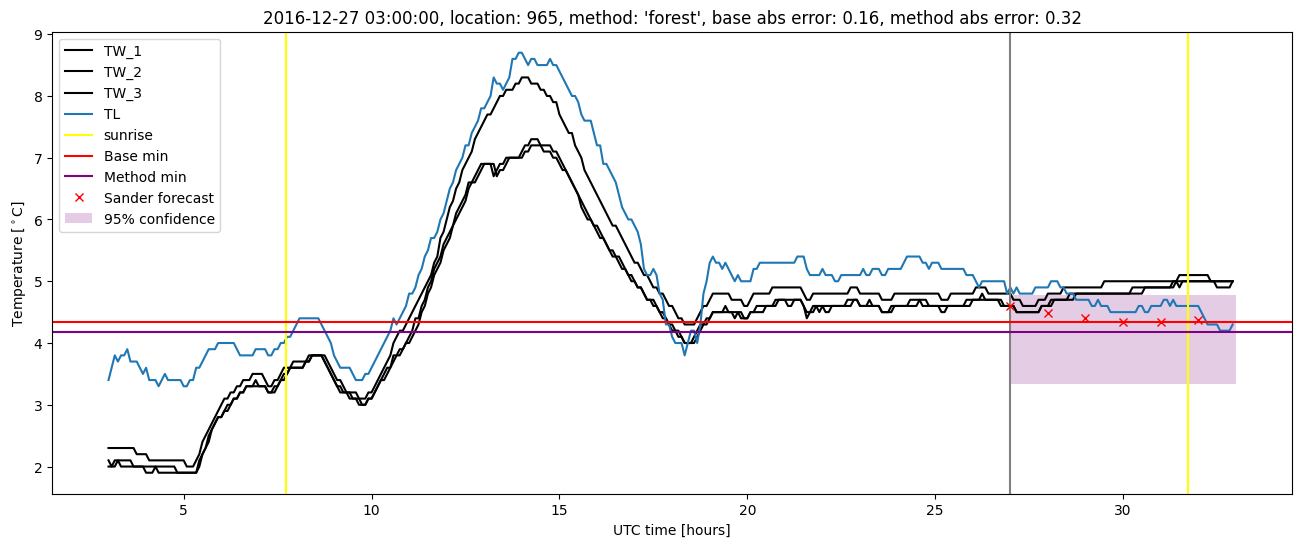
| forest |
winter 2016 |
0.988 |
0.167 |
0.312 |
0.399 |
3.097 |
0.455 |
6.725 |
| baseline |
winter 2017 |
0.975 |
0.094 |
0.327 |
0.386 |
2.865 |
NaN |
NaN |
| forest |
winter 2017 |
0.983 |
0.156 |
0.215 |
0.316 |
1.961 |
0.442 |
4.386 |
| baseline |
winter 2018 |
0.985 |
0.000e+00 |
0.309 |
0.388 |
2.176 |
NaN |
NaN |
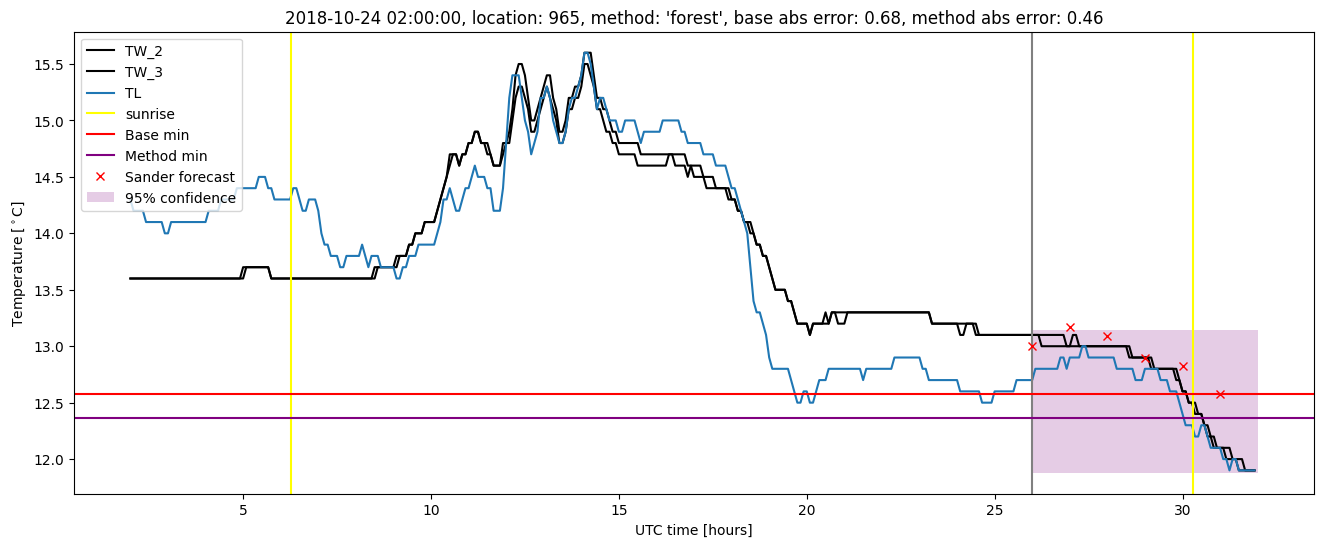
| forest |
winter 2018 |
0.985 |
0.000e+00 |
0.240 |
0.345 |
1.938 |
0.442 |
3.348 |
| baseline |
winter 2019 |
0.971 |
0.000e+00 |
0.301 |
0.404 |
2.425 |
NaN |
NaN |
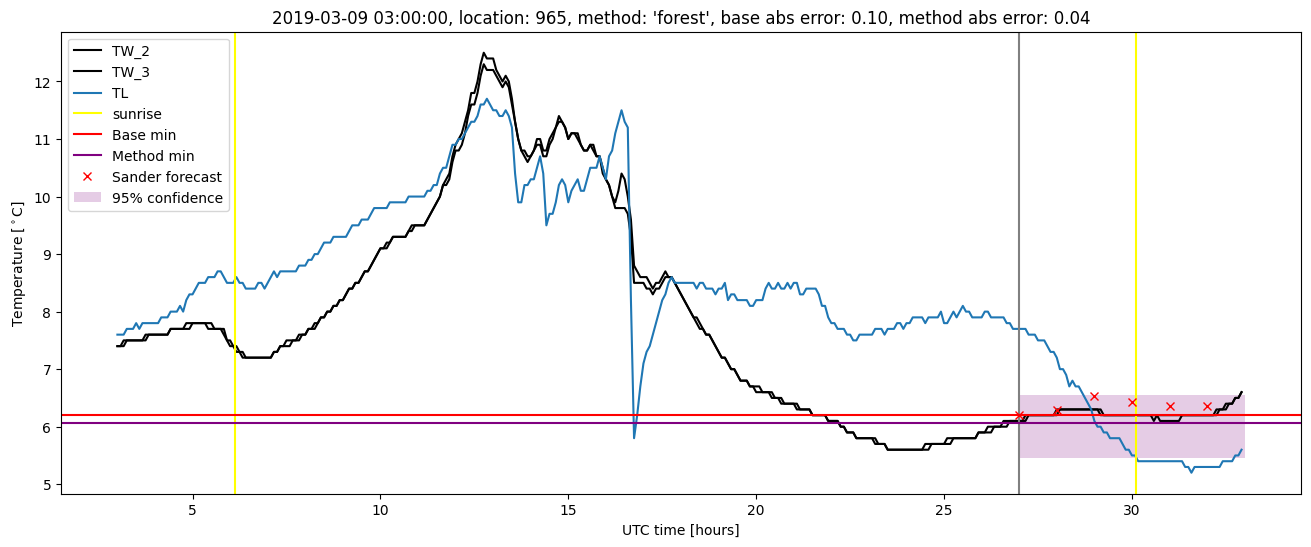
| forest |
winter 2019 |
0.993 |
0.000e+00 |
0.164 |
0.309 |
1.458 |
0.447 |
3.660 |
| baseline |
all |
0.975 |
0.078 |
0.335 |
0.411 |
3.160 |
NaN |
NaN |
| forest |
all |
0.988 |
0.089 |
0.237 |
0.345 |
3.097 |
0.447 |
4.633 |
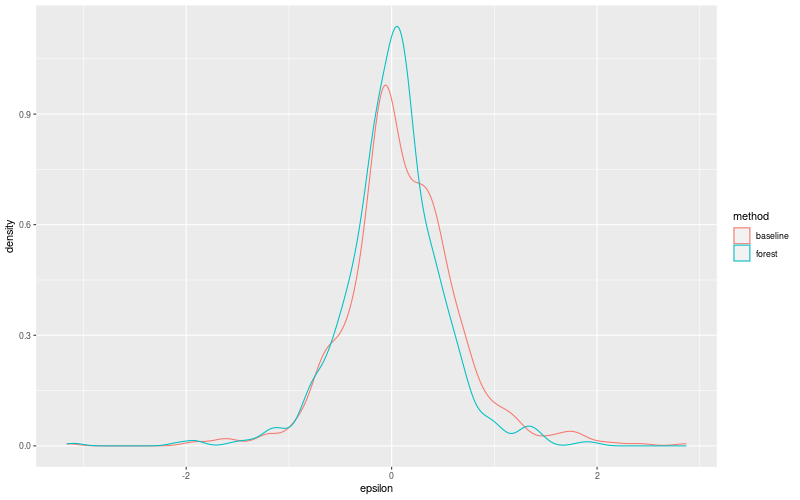
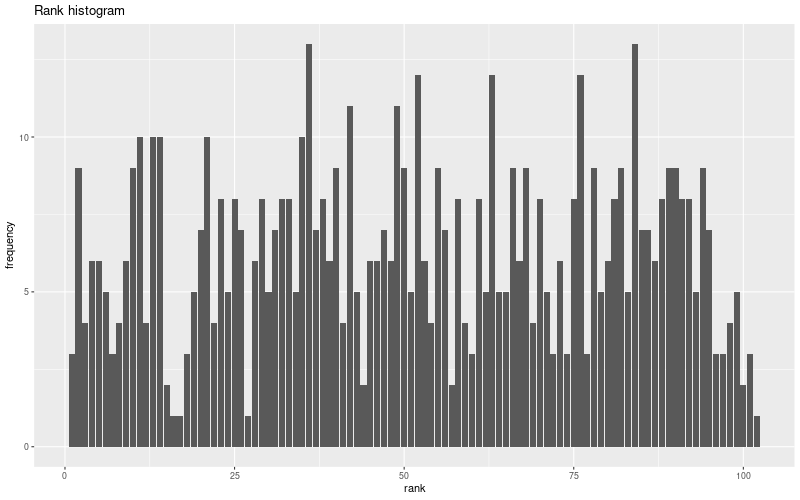
Random forest plots
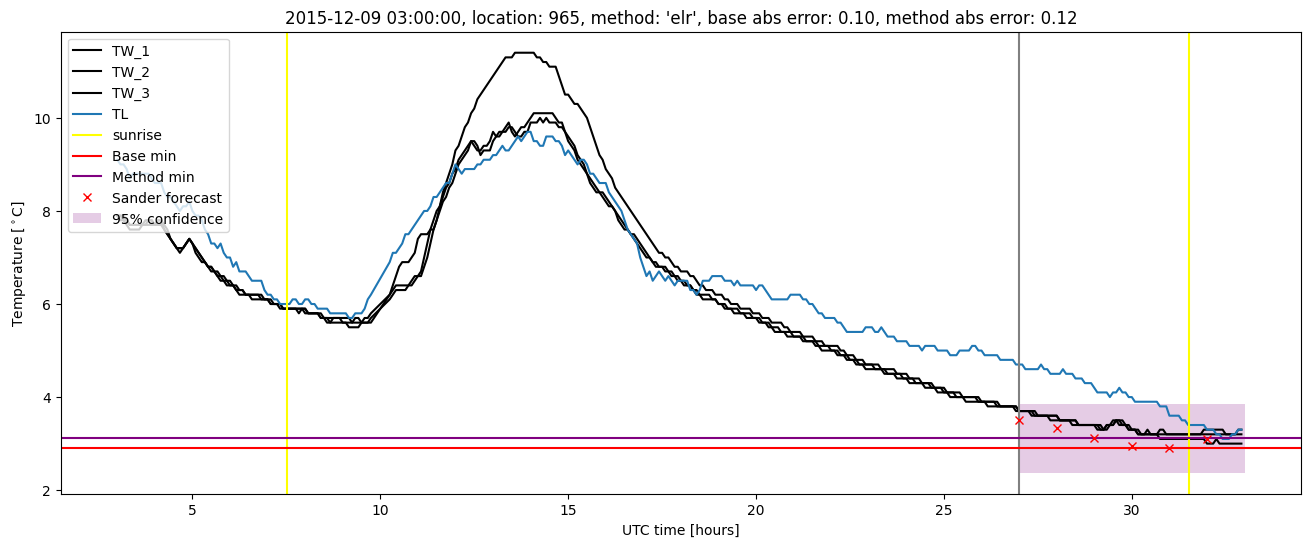
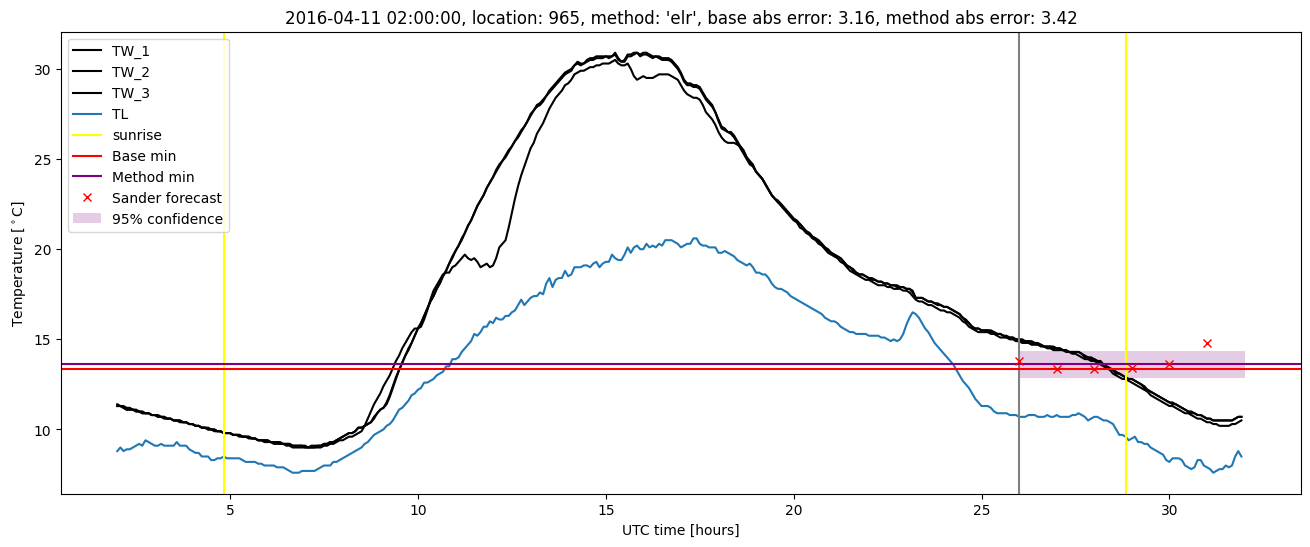
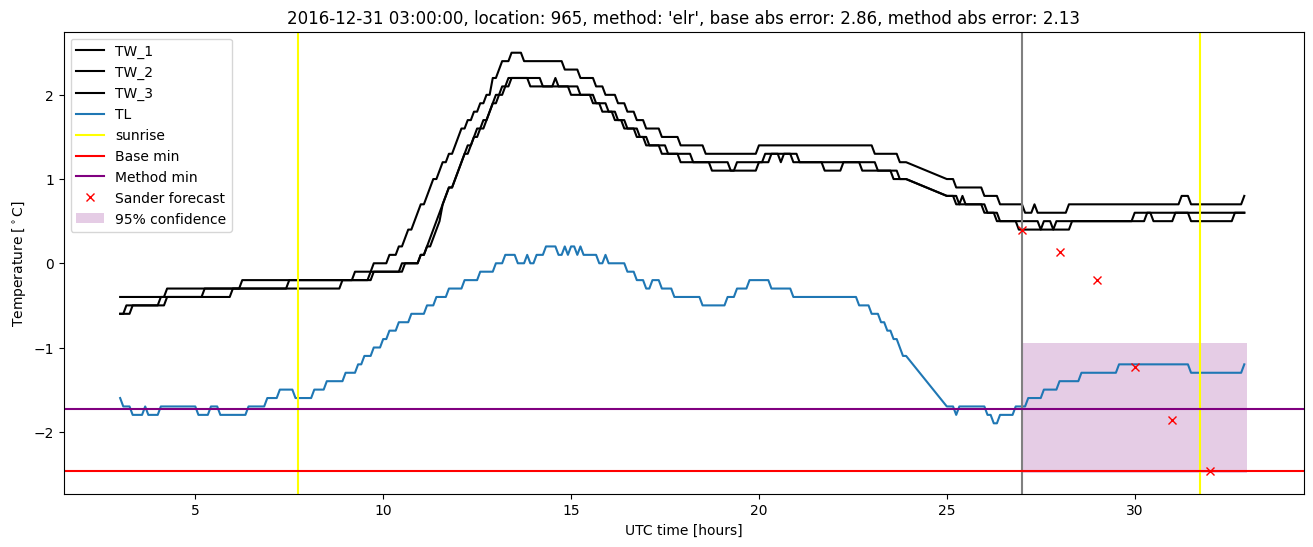
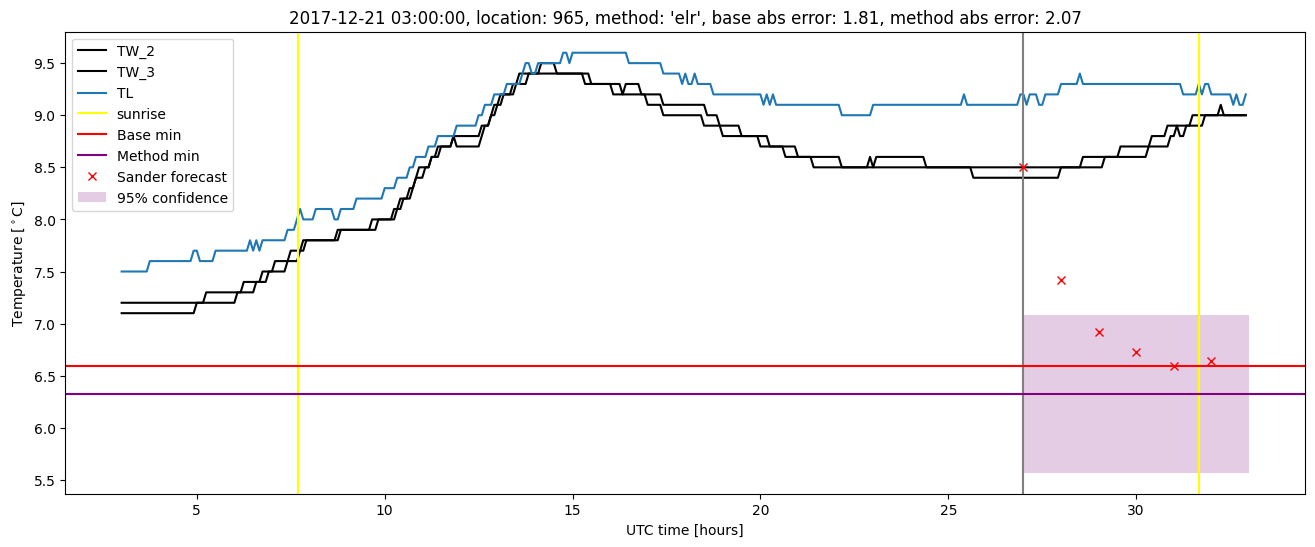
Extended logistic regression results
| names |
period |
power |
significance |
meanSquareError |
absError |
maxError |
CRPS |
IGN |
| baseline |
winter 2016 |
0.970 |
0.222 |
0.390 |
0.458 |
3.160 |
NaN |
NaN |
| elr |
winter 2016 |
0.988 |
0.167 |
0.324 |
0.410 |
3.418 |
0.534 |
7.580 |
| baseline |
winter 2017 |
0.975 |
0.094 |
0.327 |
0.386 |
2.865 |
NaN |
NaN |
| elr |
winter 2017 |
0.975 |
0.156 |
0.248 |
0.353 |
2.127 |
0.523 |
6.452 |
| baseline |
winter 2018 |
0.985 |
0.000e+00 |
0.309 |
0.388 |
2.176 |
NaN |
NaN |
| elr |
winter 2018 |
1.000 |
0.000e+00 |
0.230 |
0.341 |
2.073 |
0.508 |
6.349 |
| baseline |
winter 2019 |
0.971 |
0.000e+00 |
0.301 |
0.404 |
2.425 |
NaN |
NaN |
| elr |
winter 2019 |
0.986 |
0.000e+00 |
0.201 |
0.343 |
1.555 |
0.527 |
5.314 |
| baseline |
all |
0.975 |
0.078 |
0.335 |
0.411 |
3.160 |
NaN |
NaN |
| elr |
all |
0.988 |
0.089 |
0.254 |
0.364 |
3.418 |
0.524 |
6.486 |
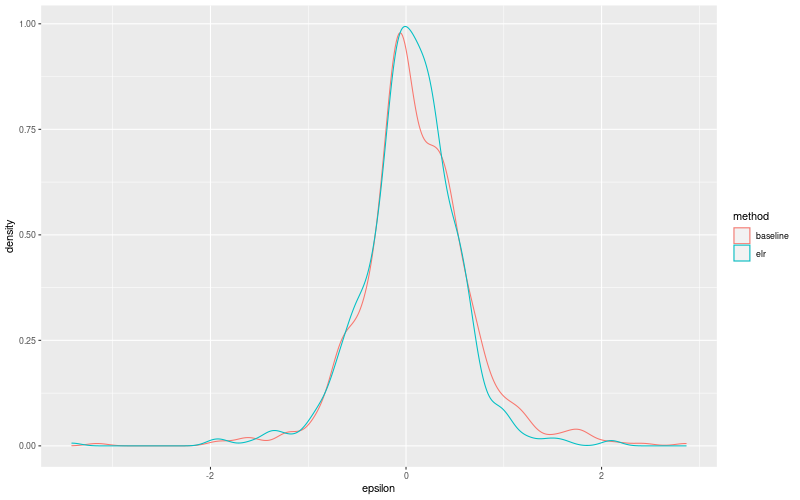
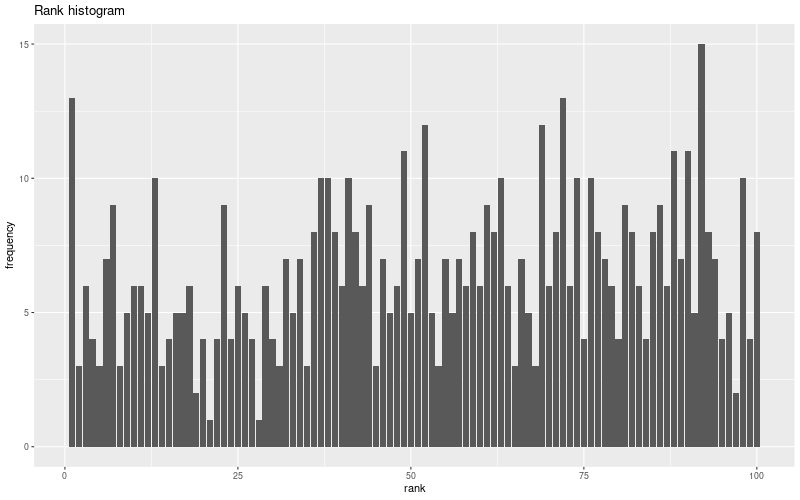
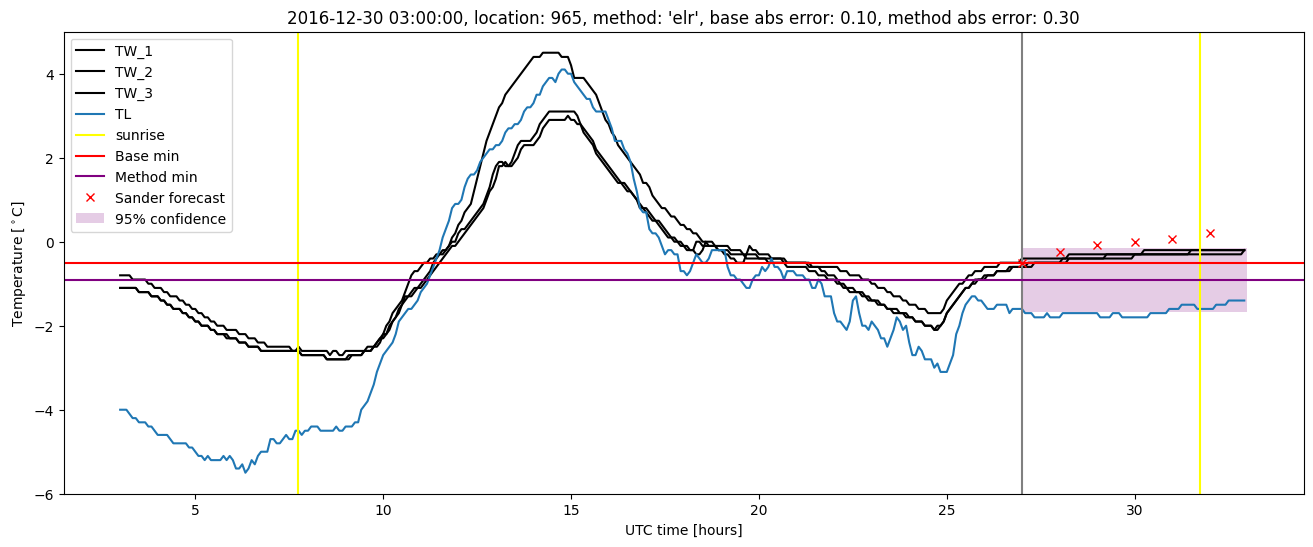
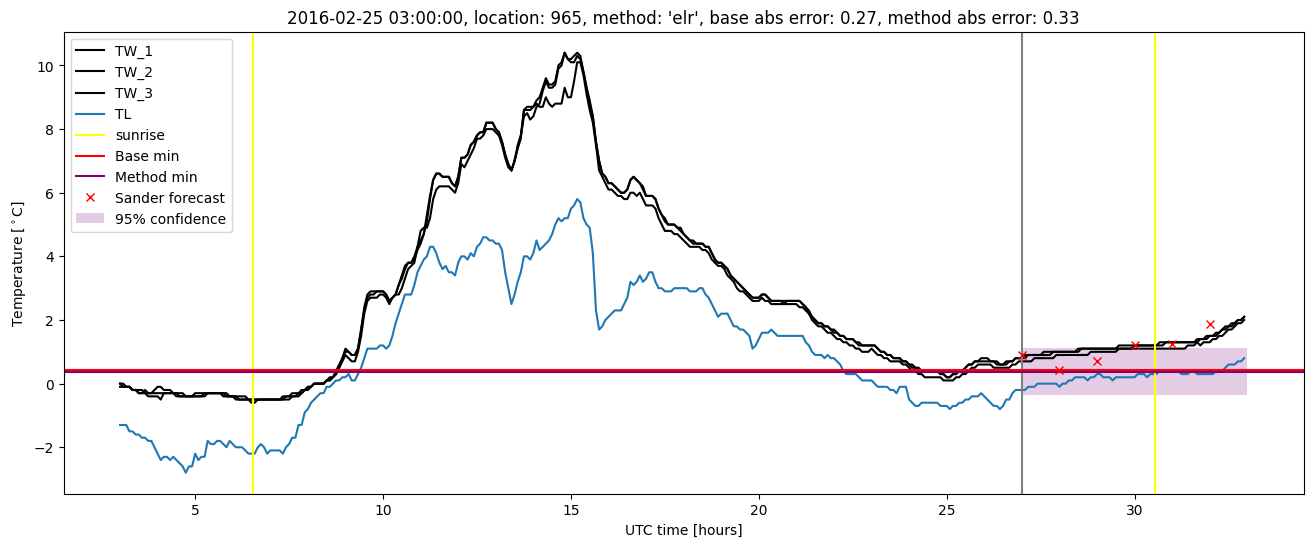
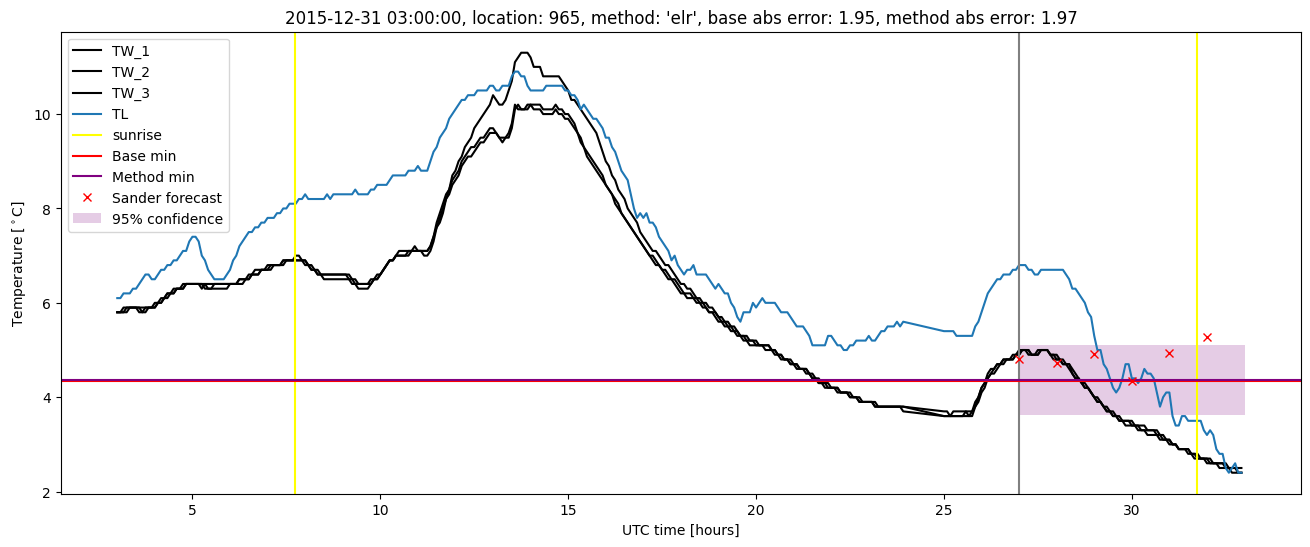
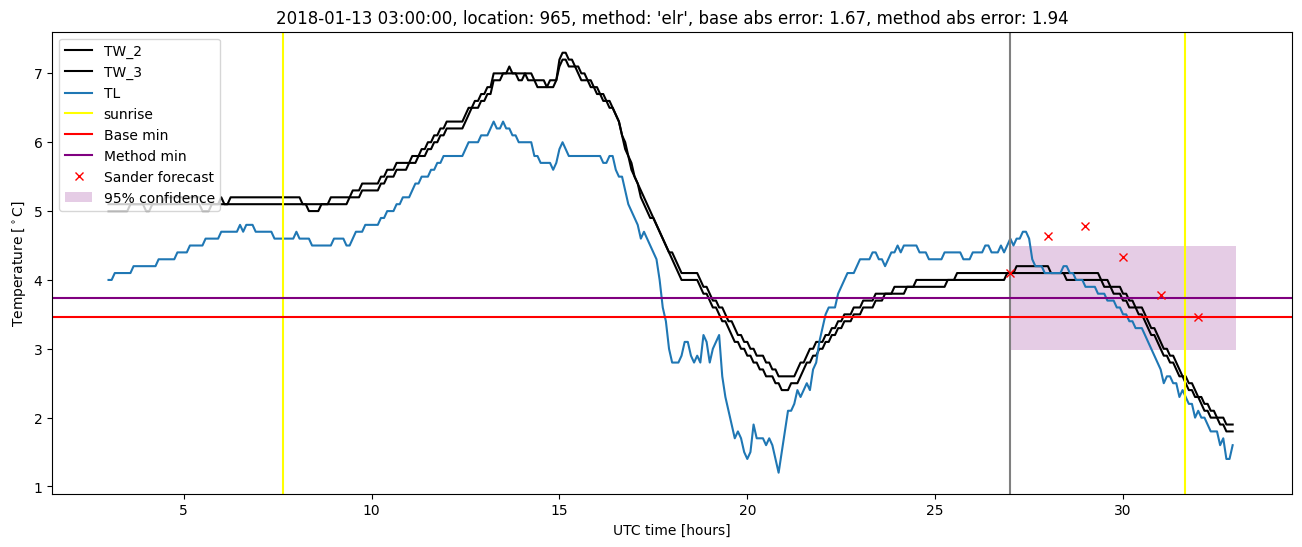
Extended logistic regression plots