GMS location: 964
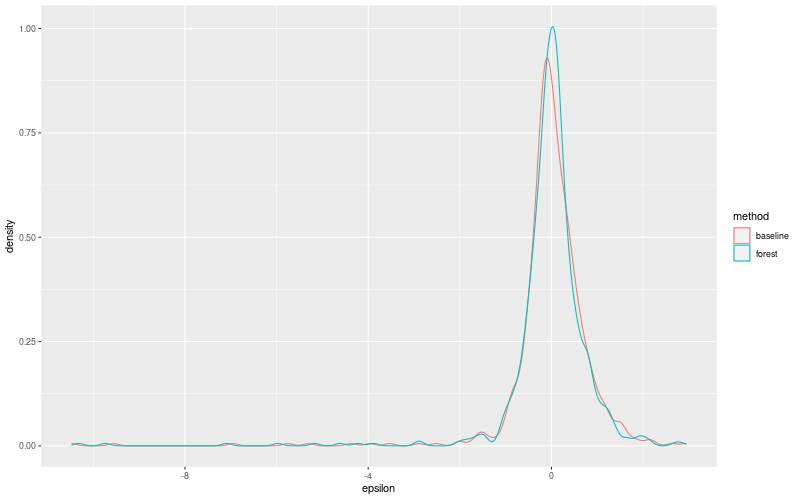
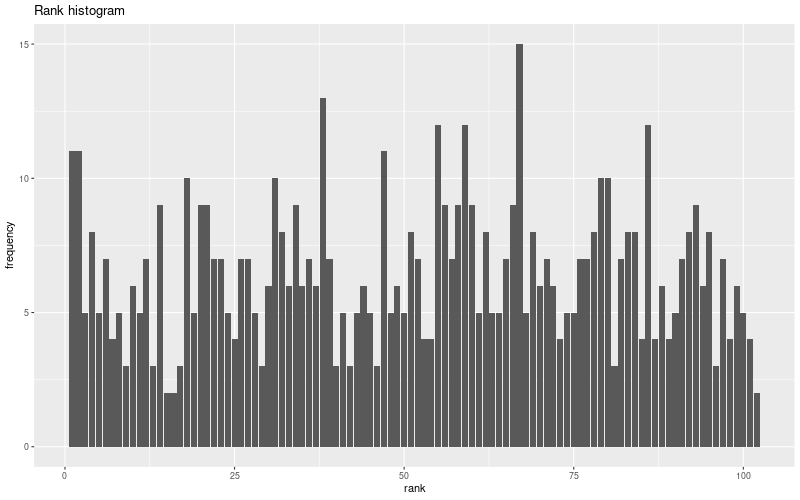
Random forest results
| names |
period |
power |
significance |
meanSquareError |
absError |
maxError |
CRPS |
IGN |
| baseline |
winter 2016 |
0.987 |
0.038 |
2.396 |
0.720 |
1.047e+01 |
NaN |
NaN |
| forest |
winter 2016 |
1.000 |
0.115 |
2.426 |
0.705 |
1.032e+01 |
0.460 |
5.203 |
| baseline |
winter 2017 |
1.000 |
0.023 |
0.344 |
0.401 |
2.633 |
NaN |
NaN |
| forest |
winter 2017 |
1.000 |
0.046 |
0.274 |
0.355 |
2.108 |
0.443 |
2.474 |
| baseline |
winter 2018 |
0.986 |
0.038 |
0.398 |
0.460 |
2.152 |
NaN |
NaN |
| forest |
winter 2018 |
0.966 |
0.000e+00 |
0.507 |
0.501 |
2.838 |
0.612 |
2.836 |
| baseline |
winter 2019 |
0.971 |
0.048 |
0.291 |
0.389 |
2.215 |
NaN |
NaN |
| forest |
winter 2019 |
0.978 |
0.048 |
0.196 |
0.327 |
1.614 |
0.519 |
2.275 |
| baseline |
all |
0.985 |
0.035 |
0.909 |
0.501 |
1.047e+01 |
NaN |
NaN |
| forest |
all |
0.985 |
0.052 |
0.907 |
0.483 |
1.032e+01 |
0.509 |
3.270 |
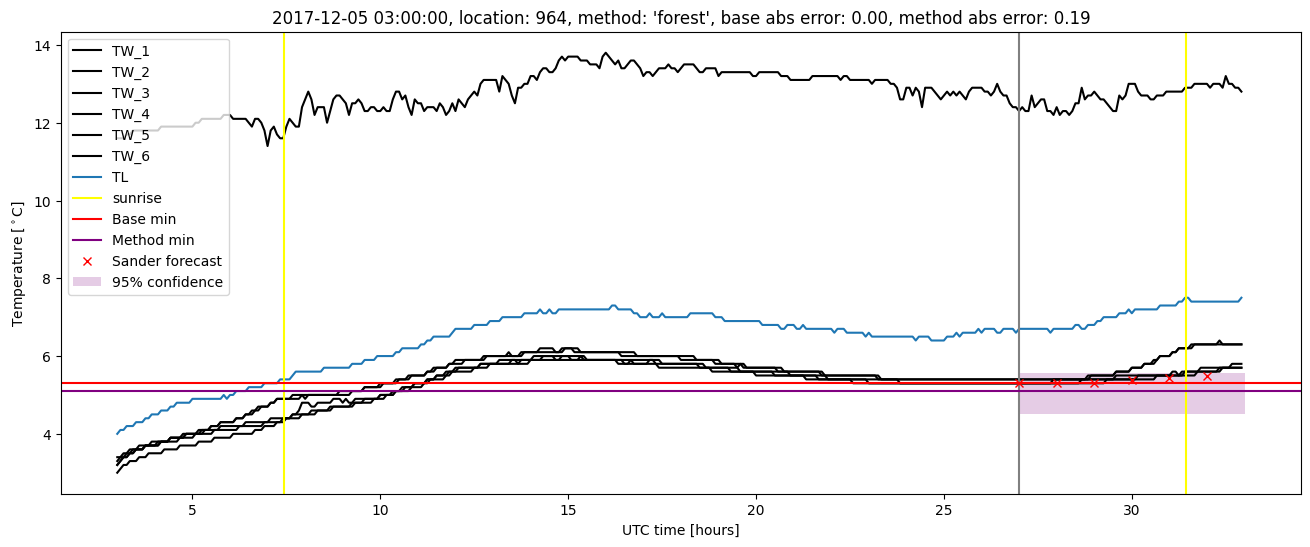
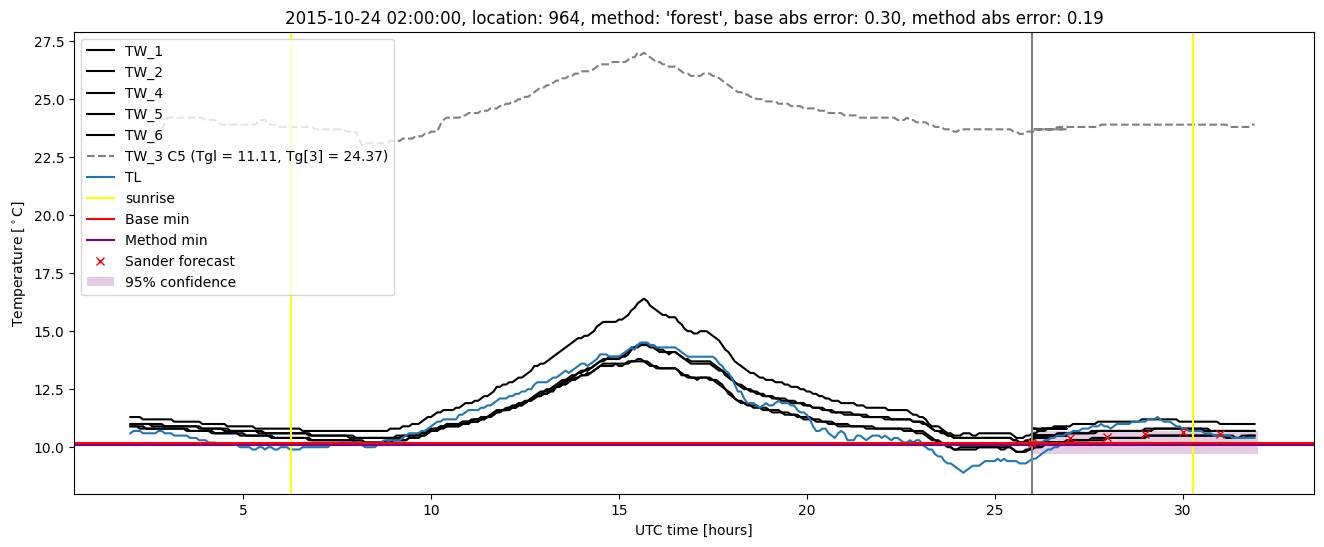
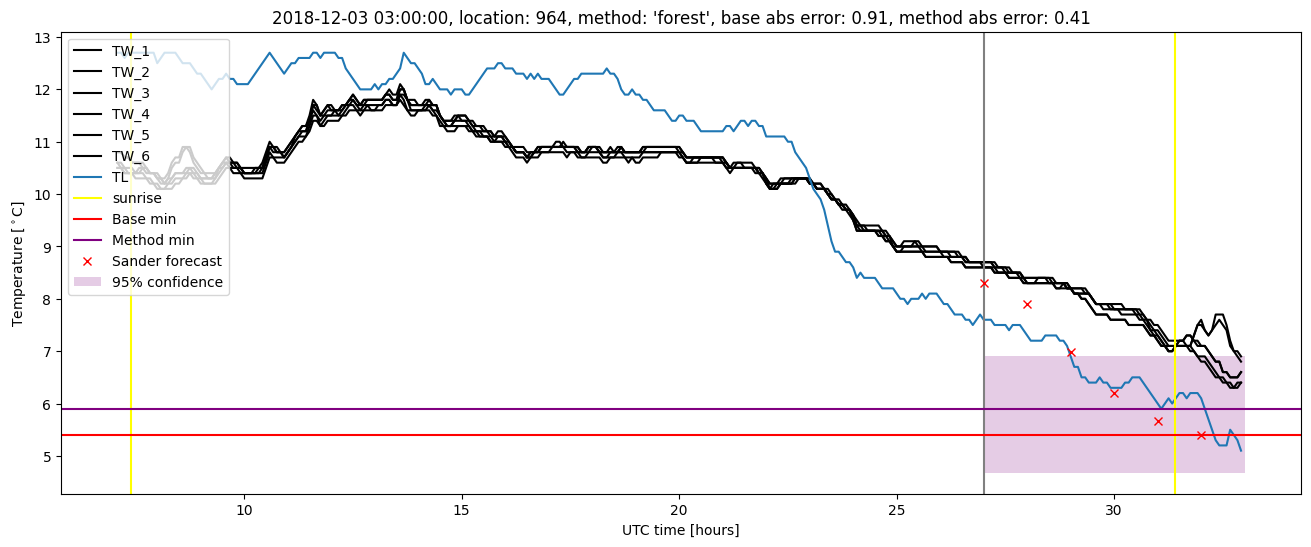
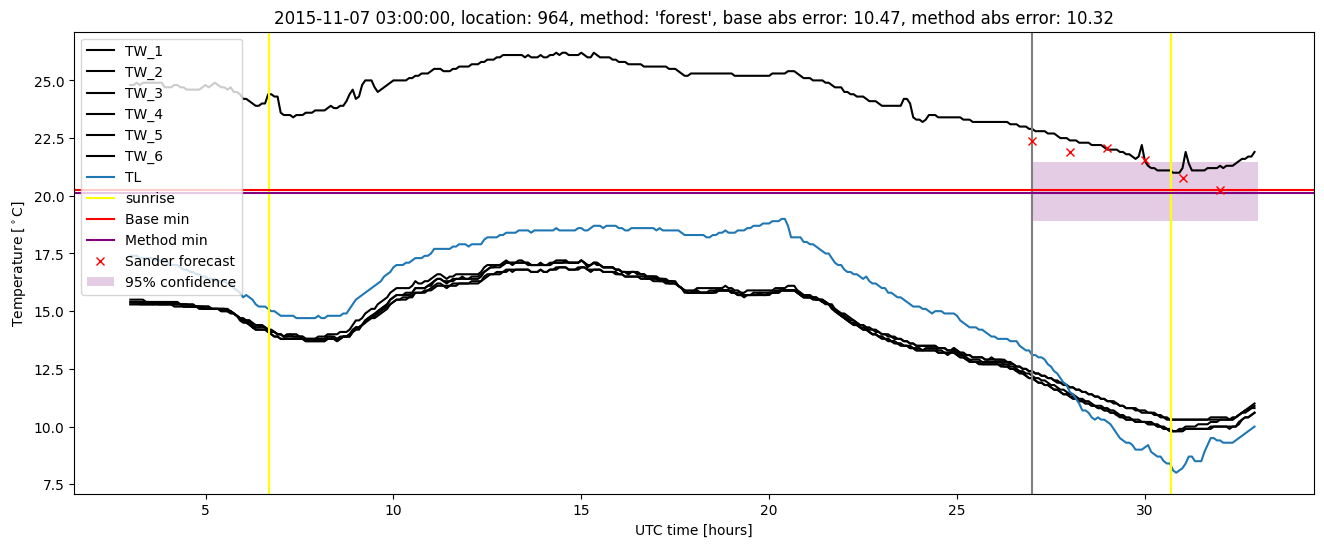
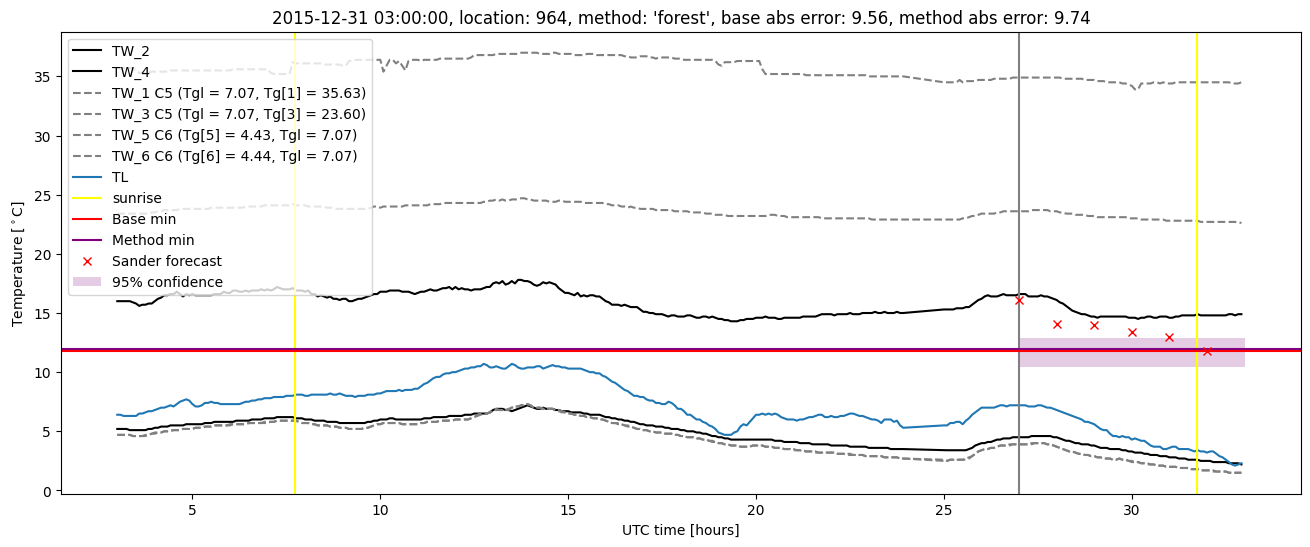
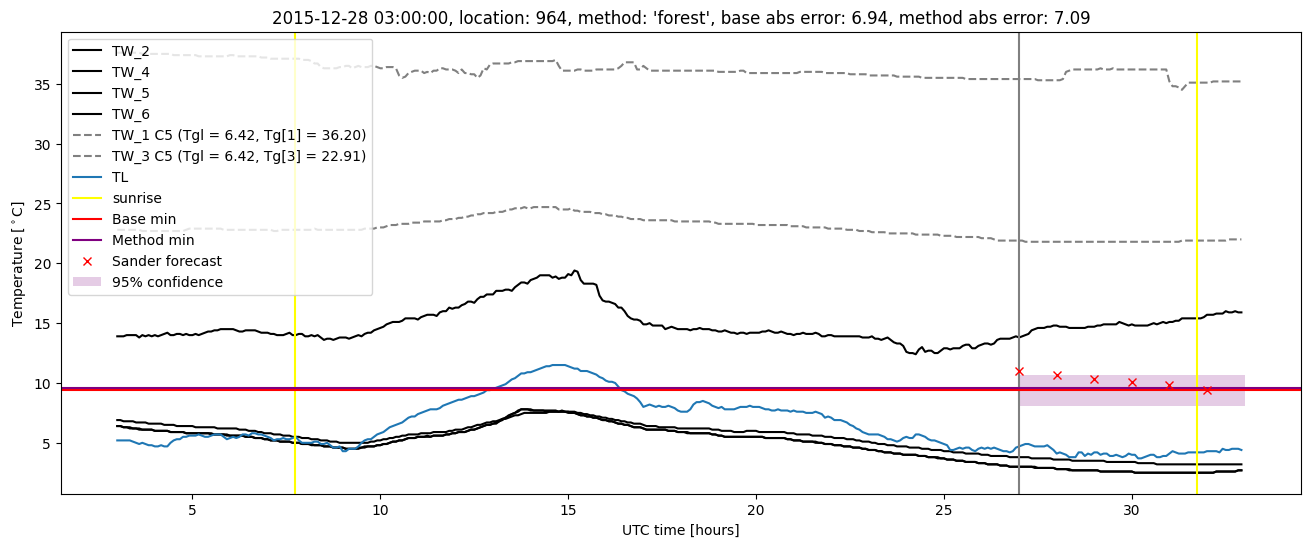
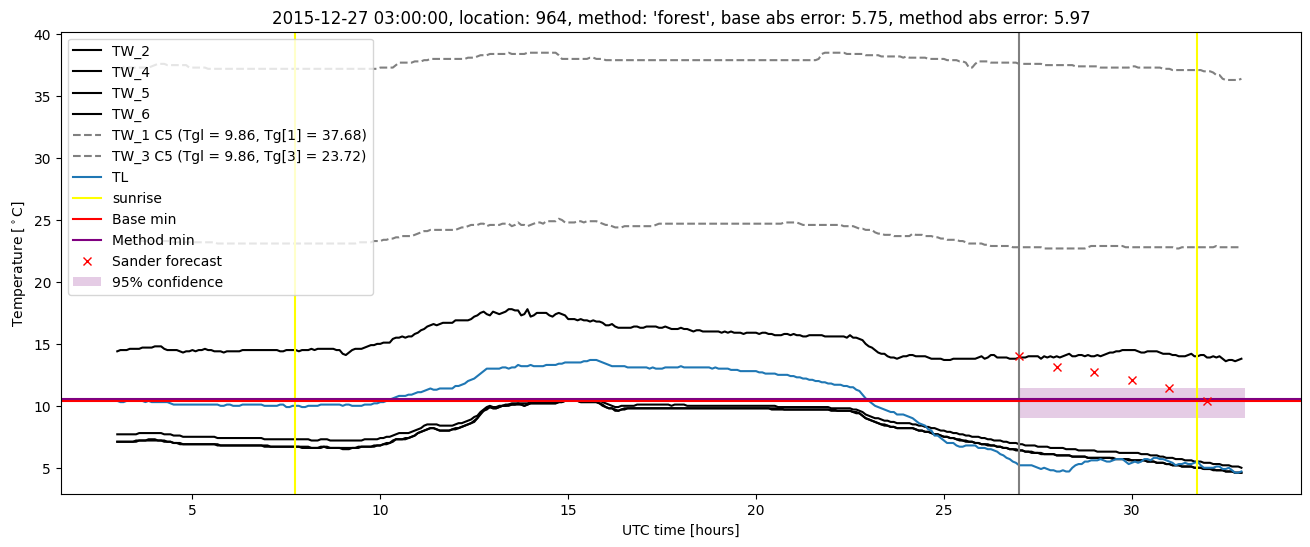
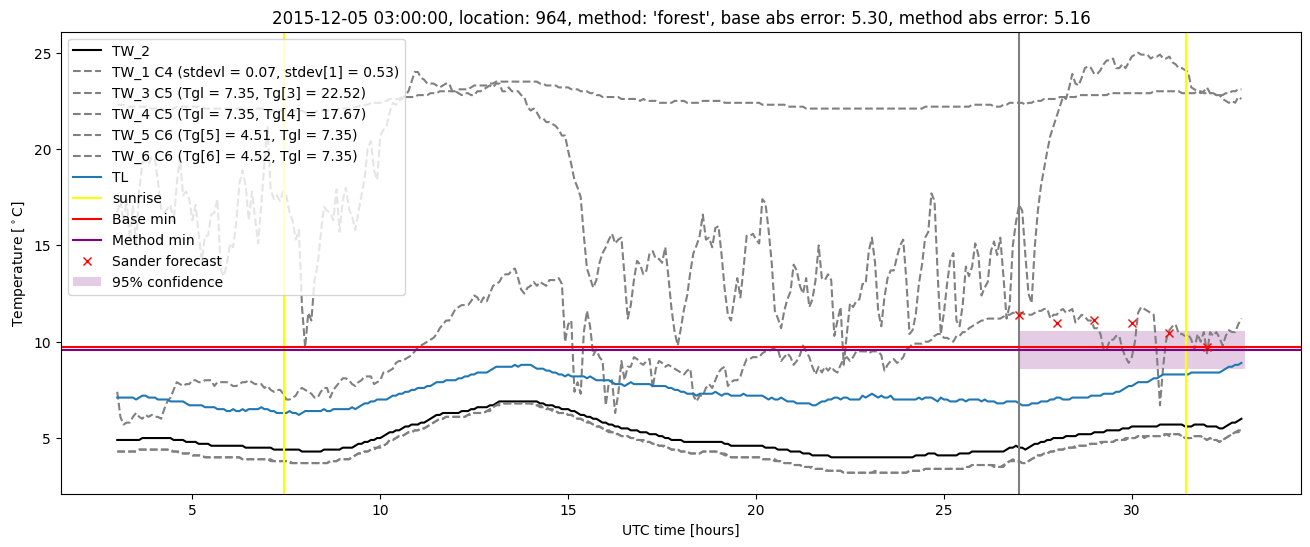
Random forest plots
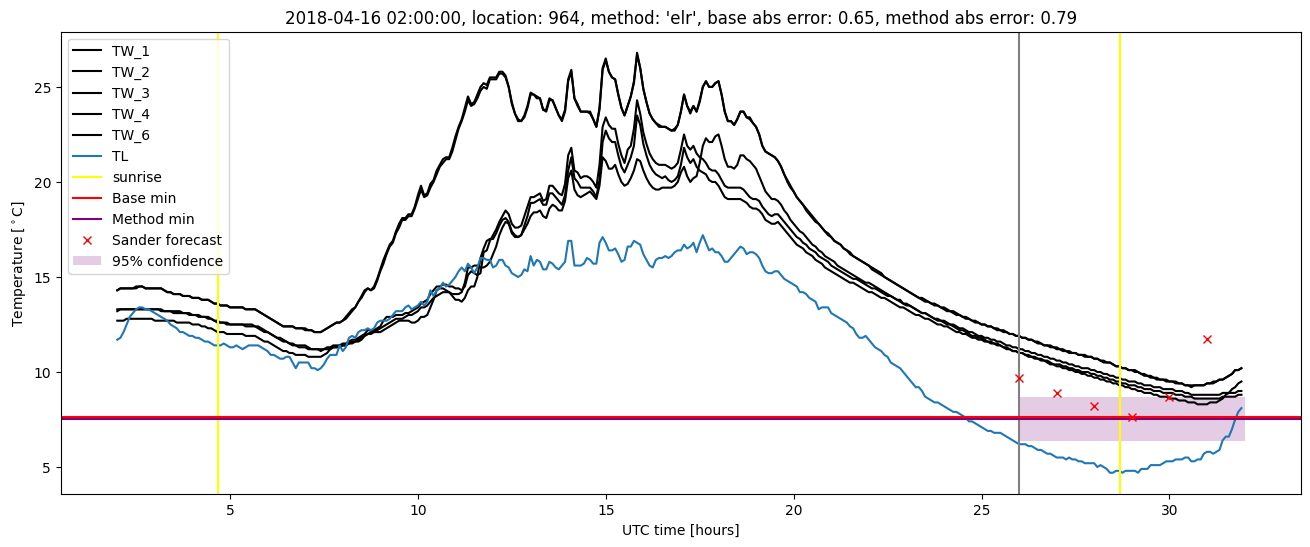
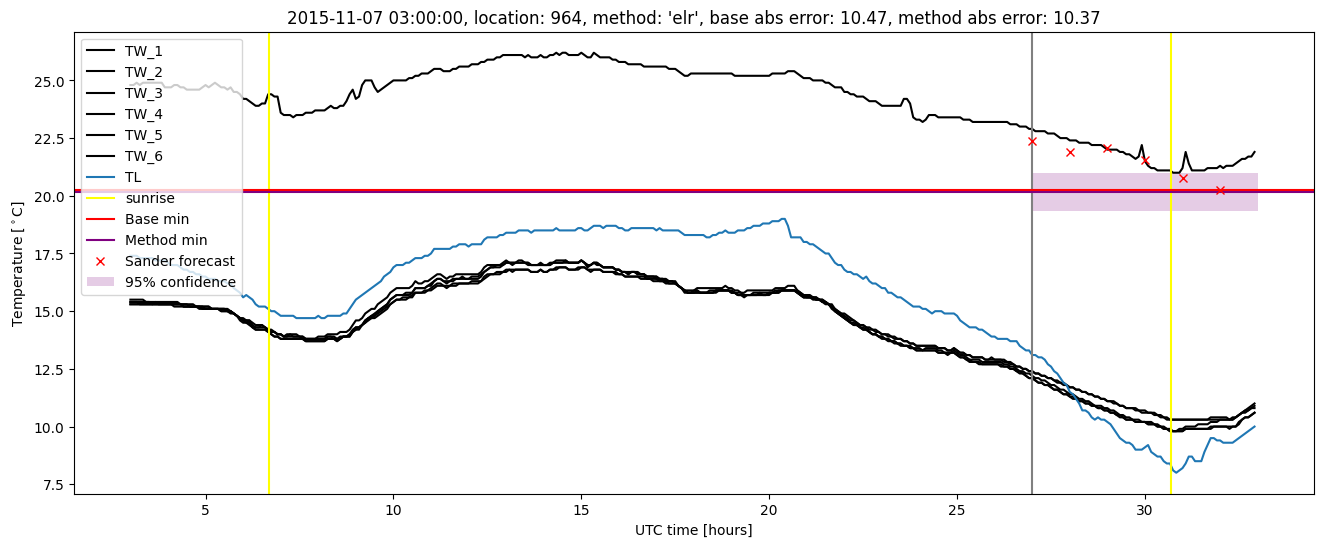
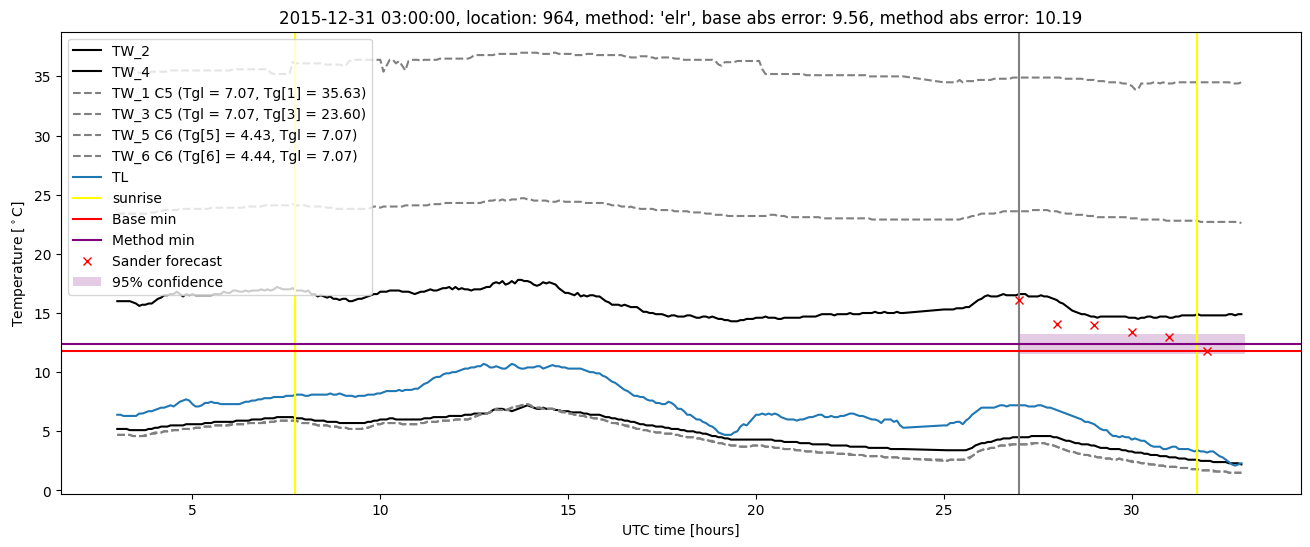
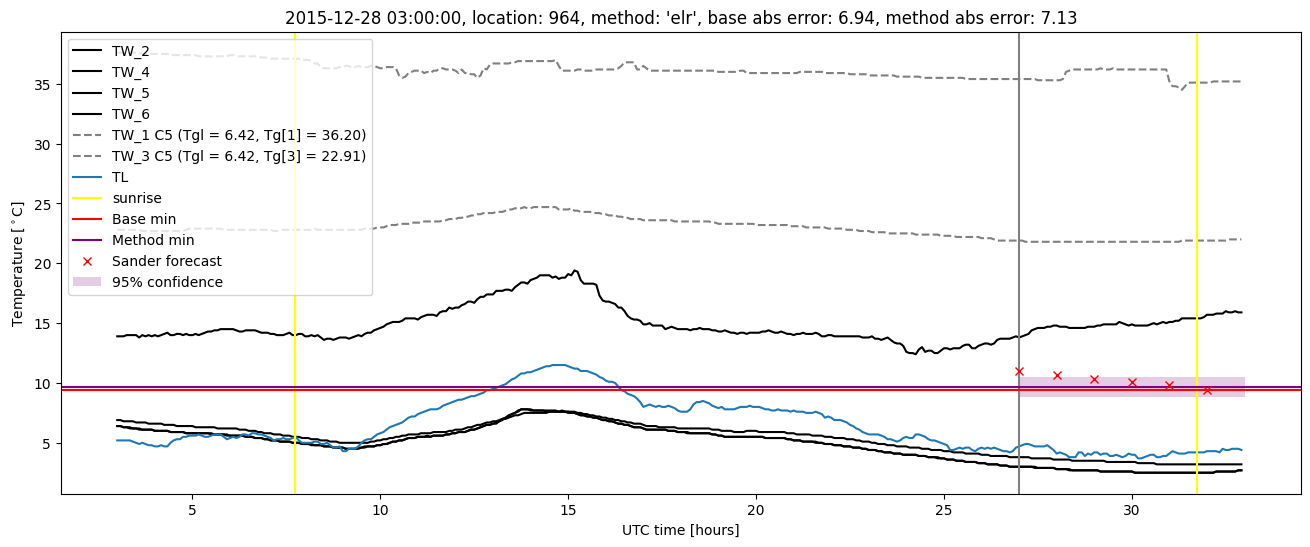
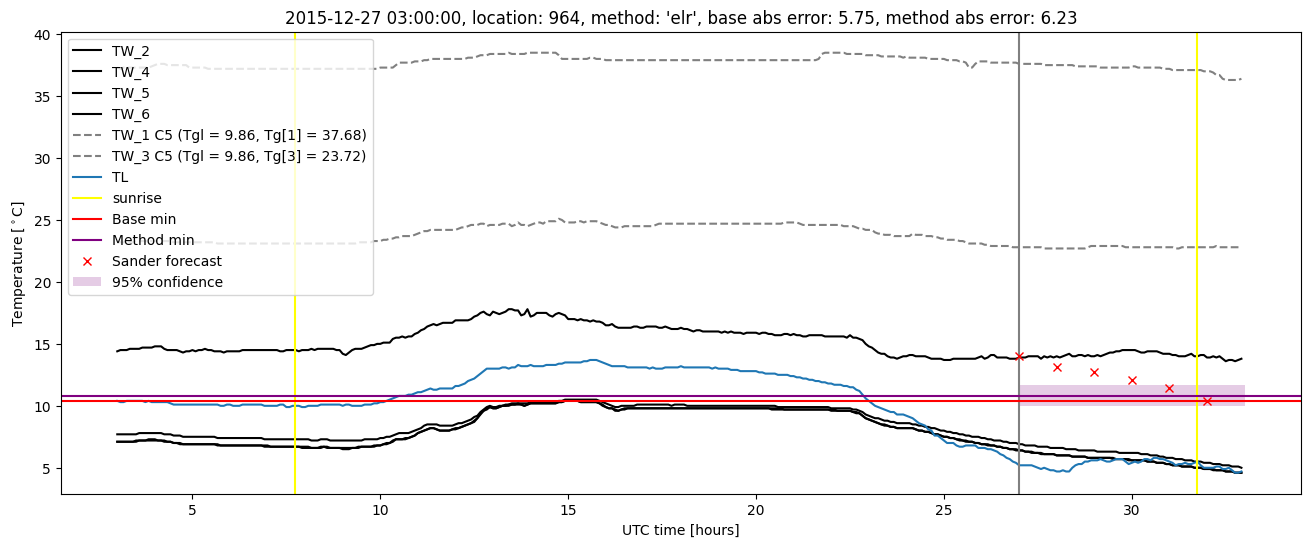
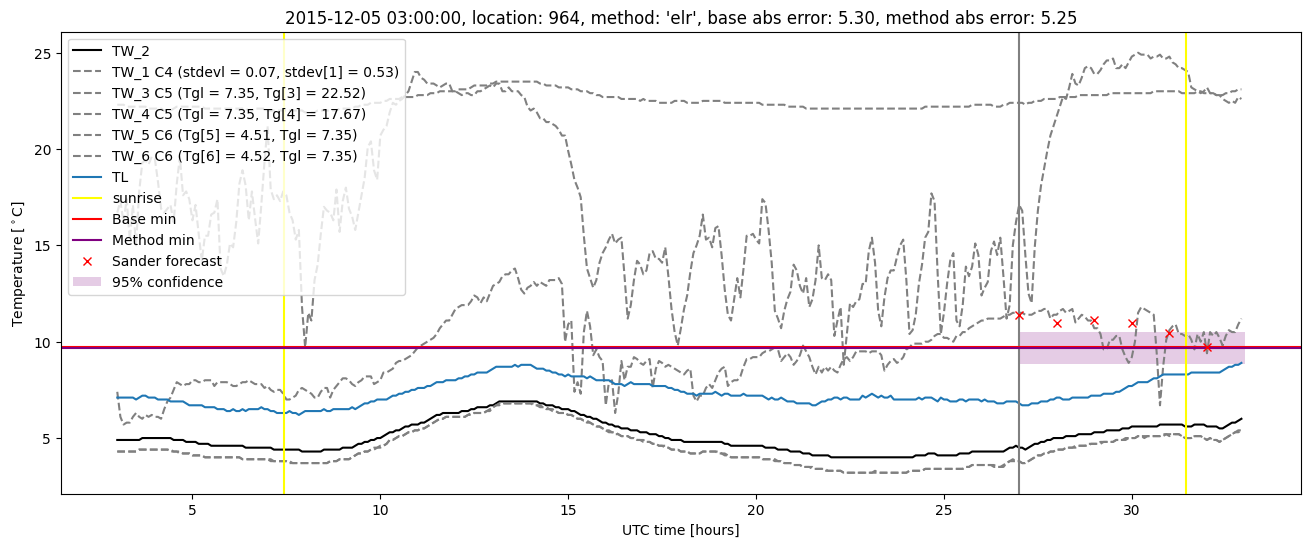
Extended logistic regression results
| names |
period |
power |
significance |
meanSquareError |
absError |
maxError |
CRPS |
IGN |
| baseline |
winter 2016 |
0.987 |
0.038 |
2.396 |
0.720 |
1.047e+01 |
NaN |
NaN |
| elr |
winter 2016 |
1.000 |
0.077 |
2.480 |
0.703 |
1.037e+01 |
0.535 |
5.013 |
| baseline |
winter 2017 |
1.000 |
0.023 |
0.344 |
0.401 |
2.633 |
NaN |
NaN |
| elr |
winter 2017 |
1.000 |
0.070 |
0.394 |
0.456 |
2.656 |
0.505 |
1.720 |
| baseline |
winter 2018 |
0.986 |
0.038 |
0.398 |
0.460 |
2.152 |
NaN |
NaN |
| elr |
winter 2018 |
0.986 |
0.077 |
0.461 |
0.507 |
2.150 |
0.537 |
1.945 |
| baseline |
winter 2019 |
0.971 |
0.048 |
0.291 |
0.389 |
2.215 |
NaN |
NaN |
| elr |
winter 2019 |
0.978 |
0.143 |
0.299 |
0.415 |
1.766 |
0.483 |
1.493 |
| baseline |
all |
0.985 |
0.035 |
0.909 |
0.501 |
1.047e+01 |
NaN |
NaN |
| elr |
all |
0.991 |
0.086 |
0.962 |
0.527 |
1.037e+01 |
0.516 |
2.630 |
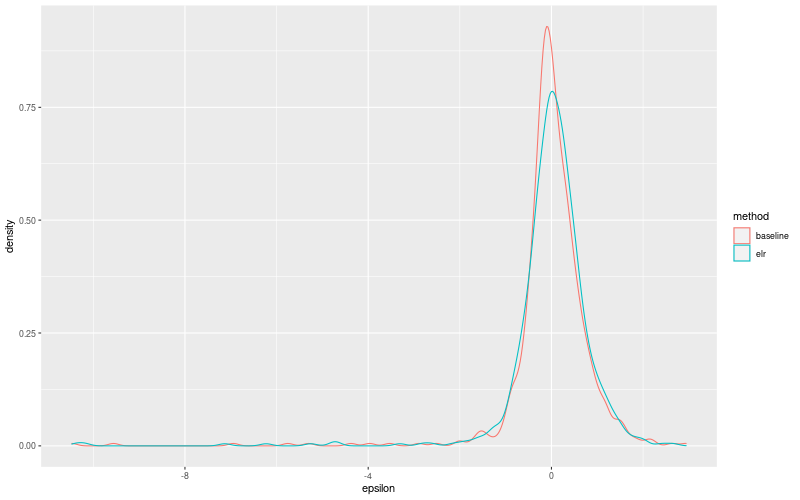
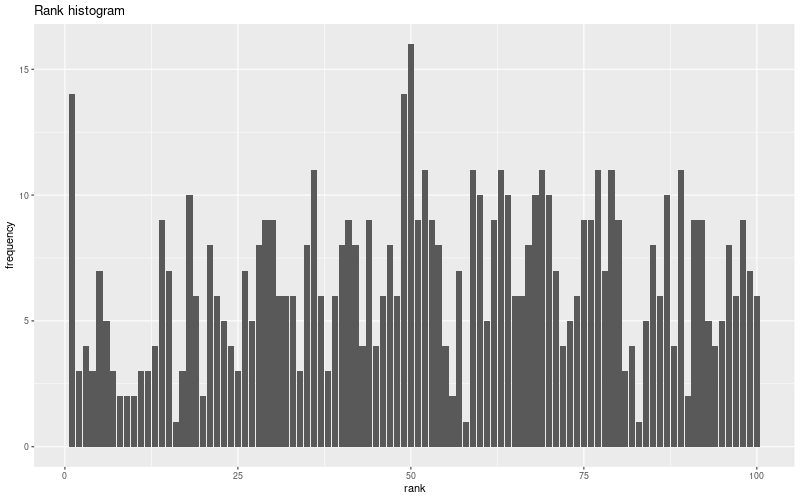
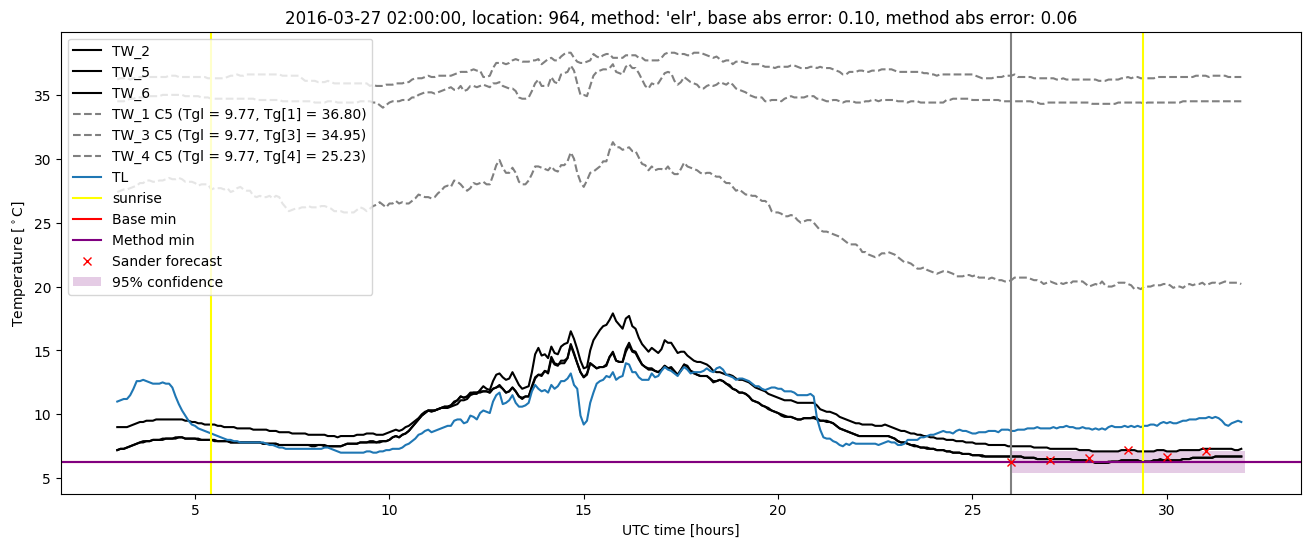
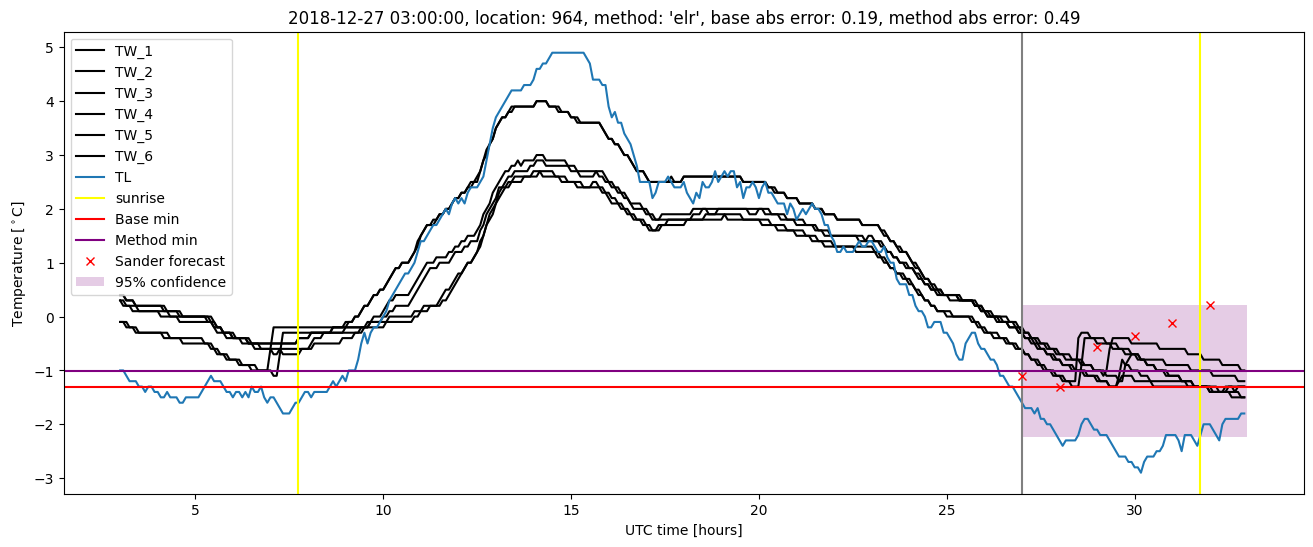
Extended logistic regression plots