GMS location: 963
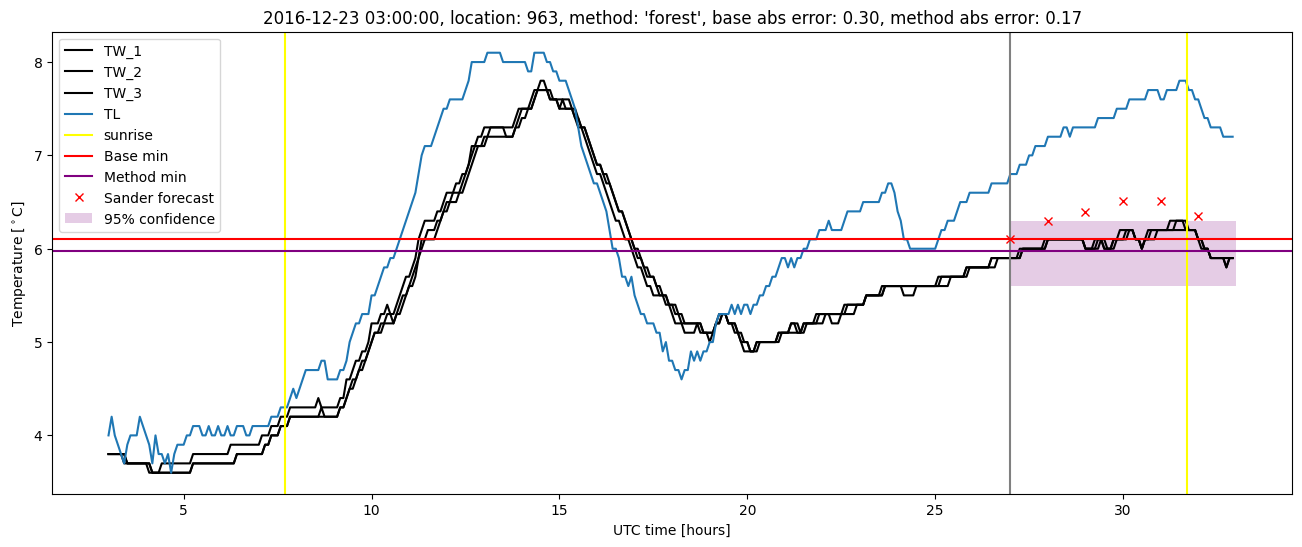
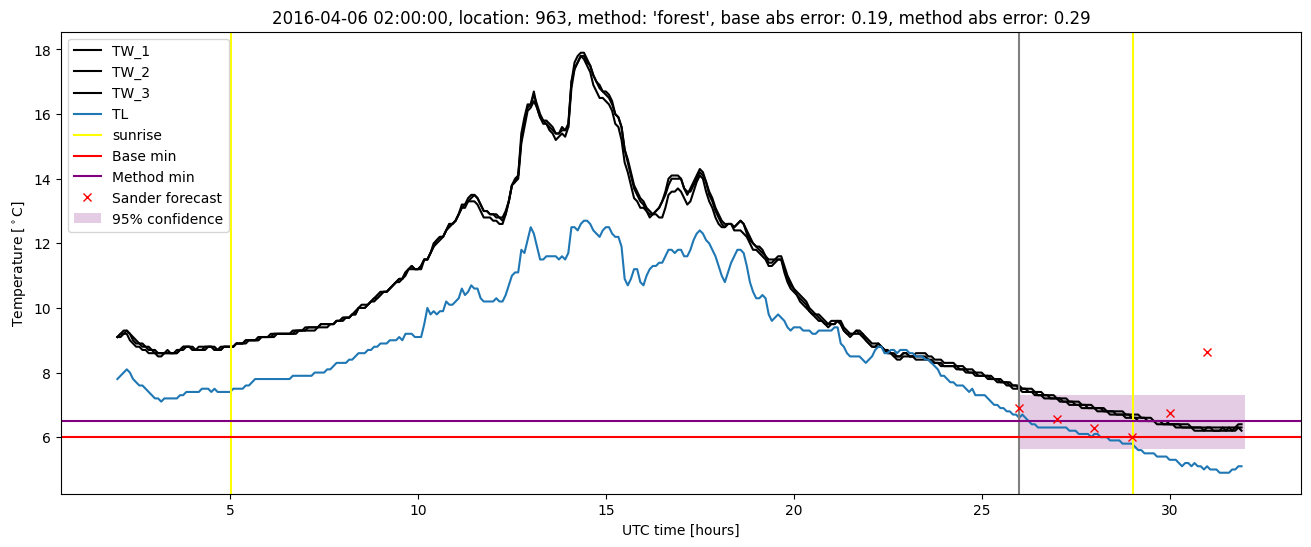
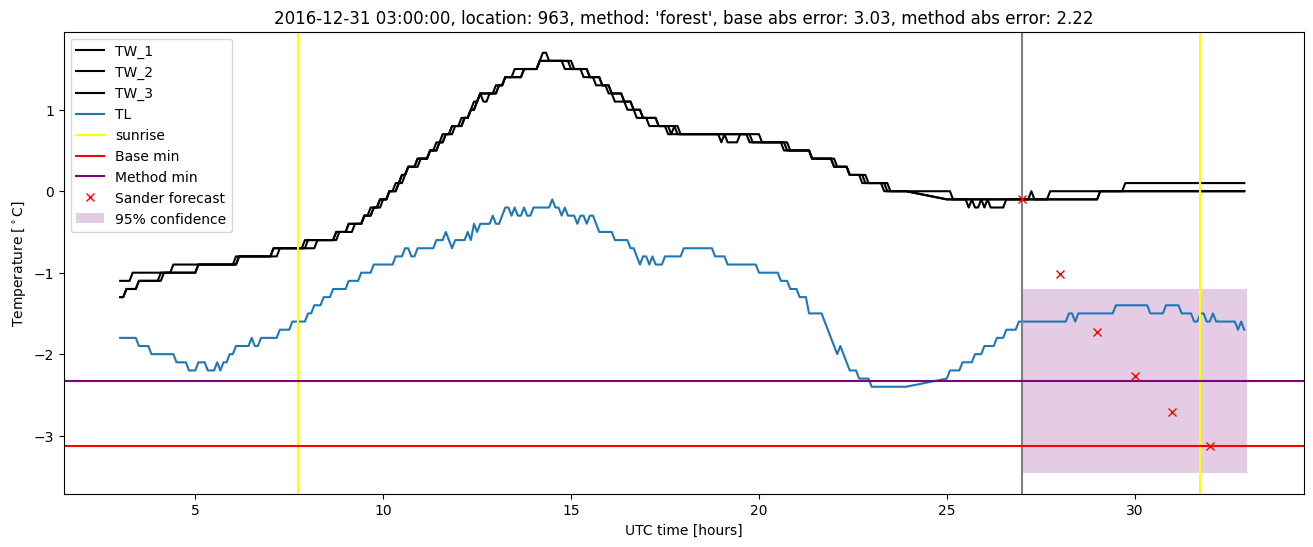
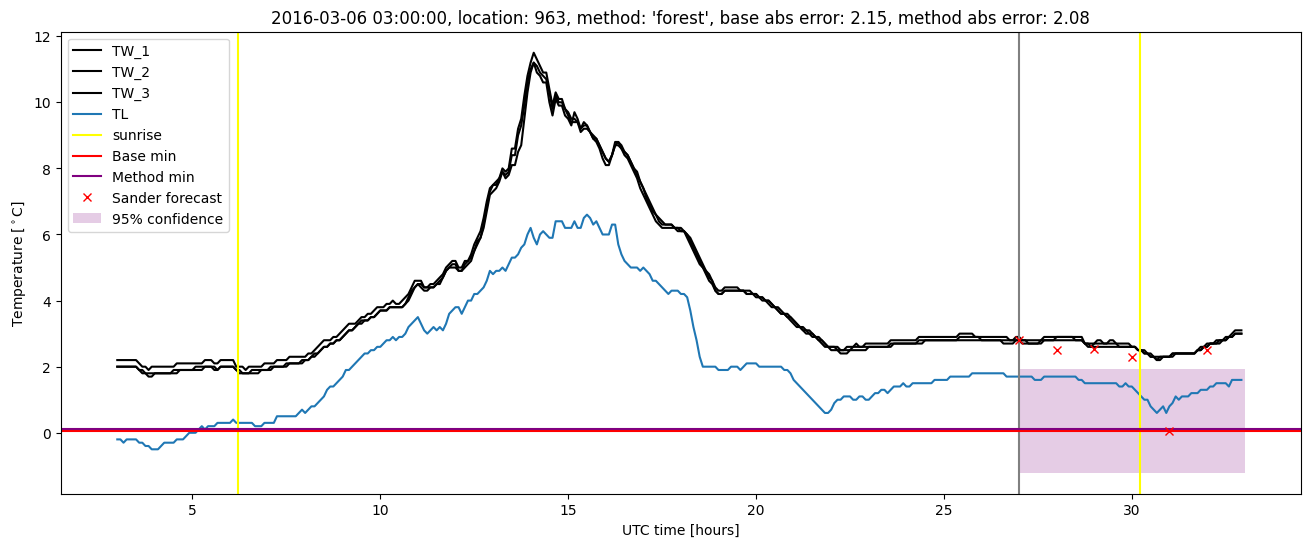
Random forest results
| names |
period |
power |
significance |
meanSquareError |
absError |
maxError |
CRPS |
IGN |
| baseline |
winter 2016 |
0.985 |
0.083 |
0.362 |
0.449 |
2.152 |
NaN |
NaN |
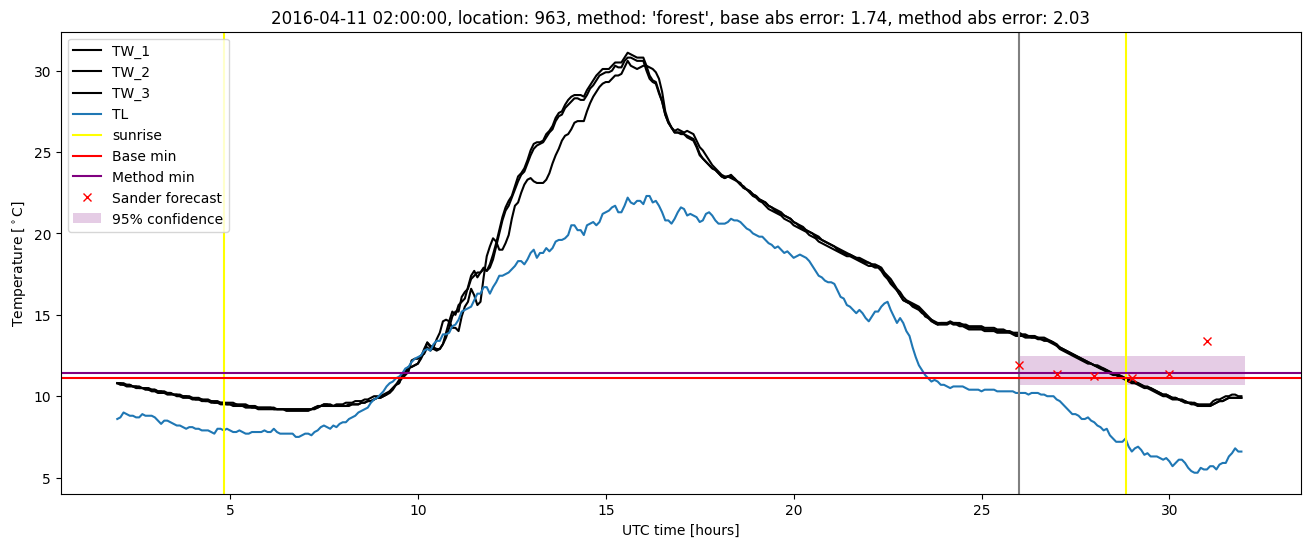
| forest |
winter 2016 |
0.995 |
0.083 |
0.313 |
0.414 |
2.082 |
0.419 |
5.361 |
| baseline |
winter 2017 |
0.984 |
0.103 |
0.391 |
0.424 |
3.032 |
NaN |
NaN |
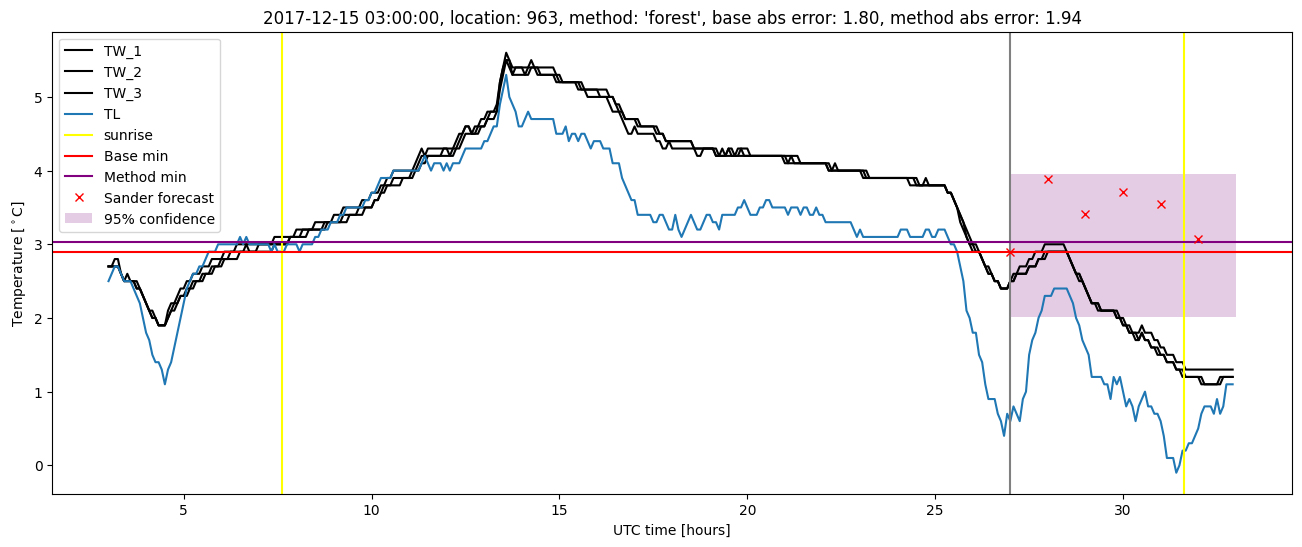
| forest |
winter 2017 |
0.984 |
0.103 |
0.290 |
0.394 |
2.224 |
0.436 |
5.042 |
| baseline |
winter 2018 |
0.962 |
0.080 |
0.389 |
0.449 |
2.375 |
NaN |
NaN |
| forest |
winter 2018 |
0.977 |
0.080 |
0.259 |
0.364 |
1.936 |
0.408 |
2.427 |
| baseline |
winter 2019 |
0.985 |
0.000e+00 |
0.413 |
0.476 |
2.516 |
NaN |
NaN |
| forest |
winter 2019 |
0.993 |
0.000e+00 |
0.269 |
0.366 |
1.694 |
0.411 |
3.140 |
| baseline |
all |
0.980 |
0.079 |
0.387 |
0.449 |
3.032 |
NaN |
NaN |
| forest |
all |
0.988 |
0.079 |
0.285 |
0.387 |
2.224 |
0.418 |
4.105 |
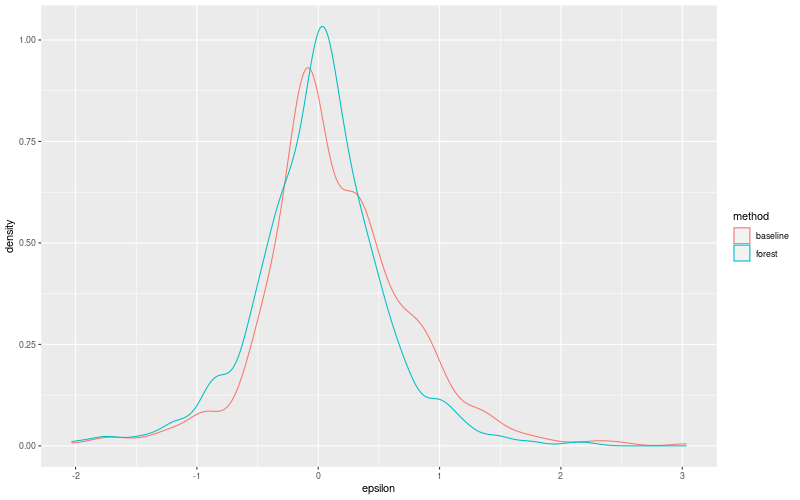
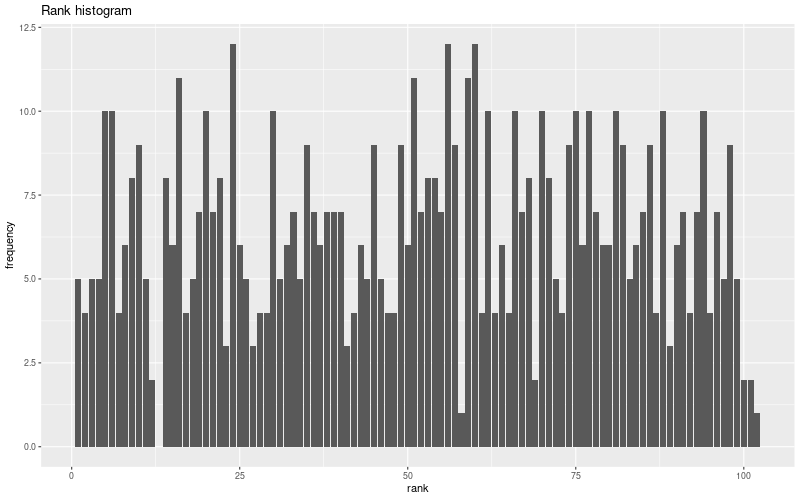
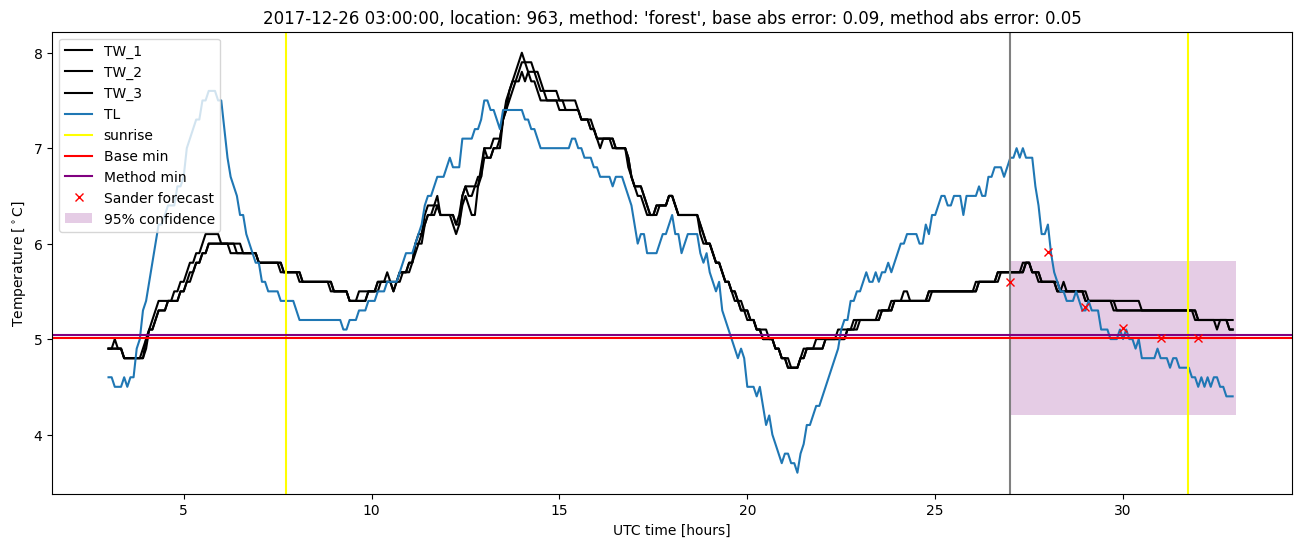
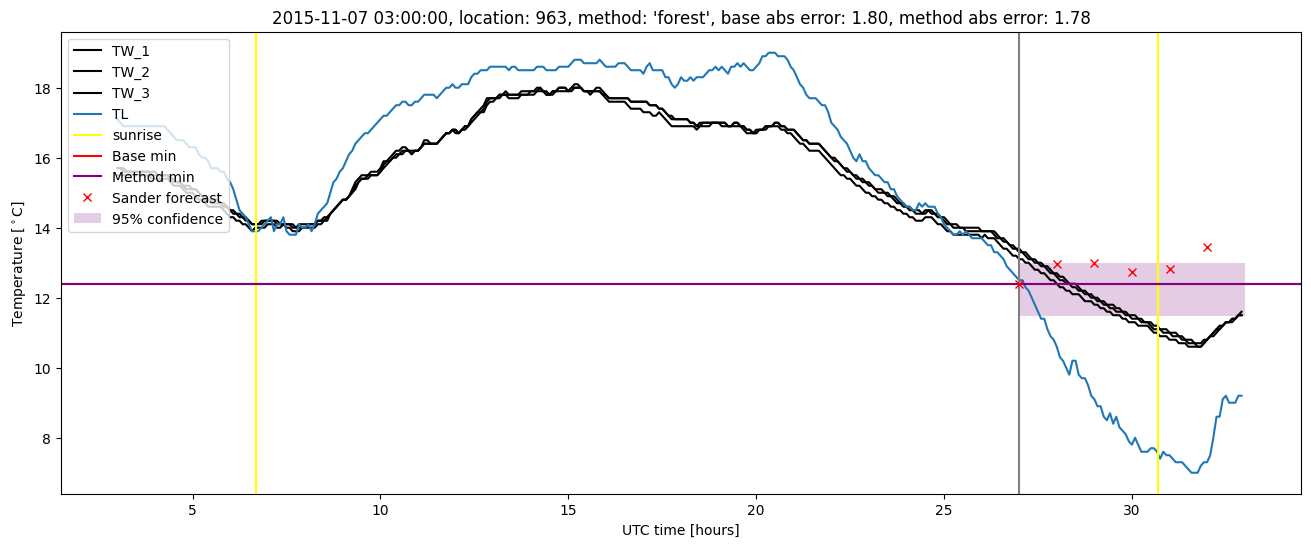
Random forest plots
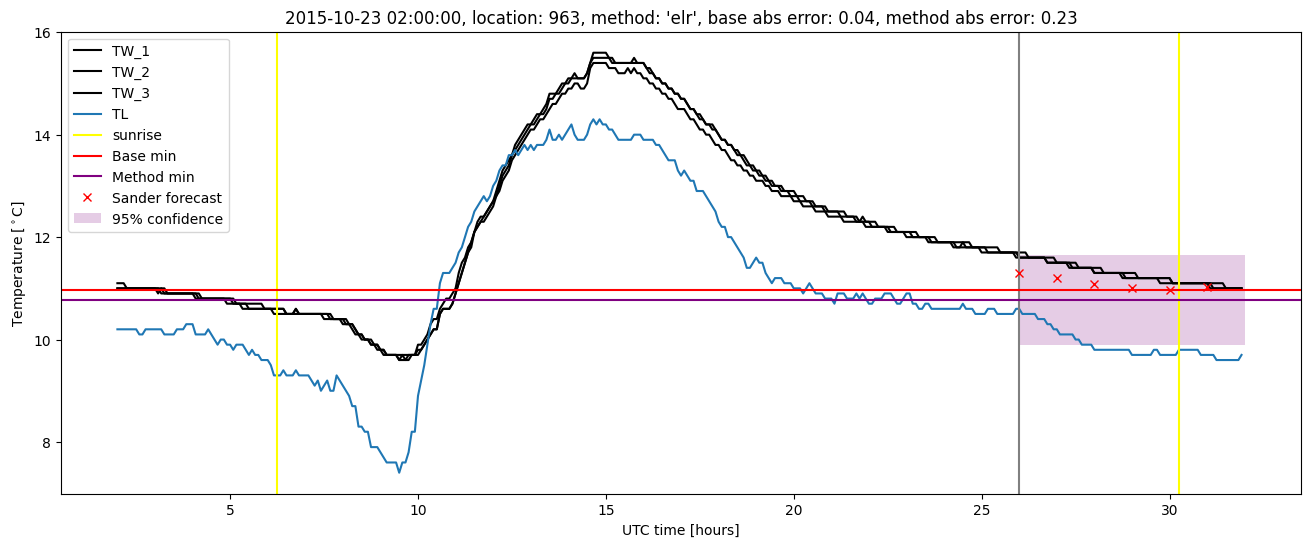
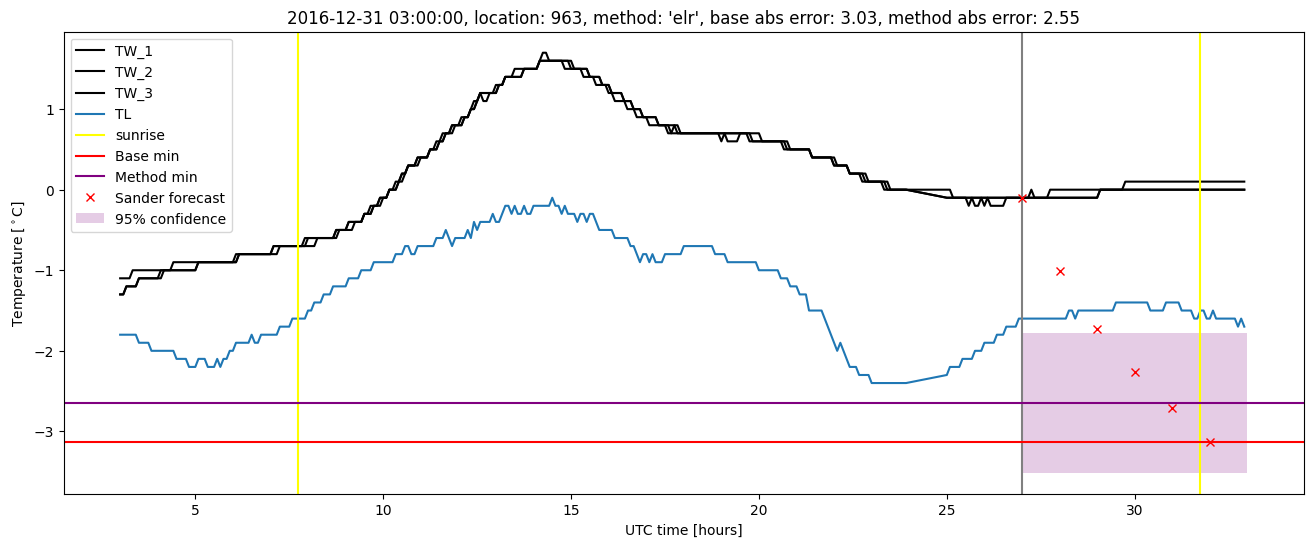
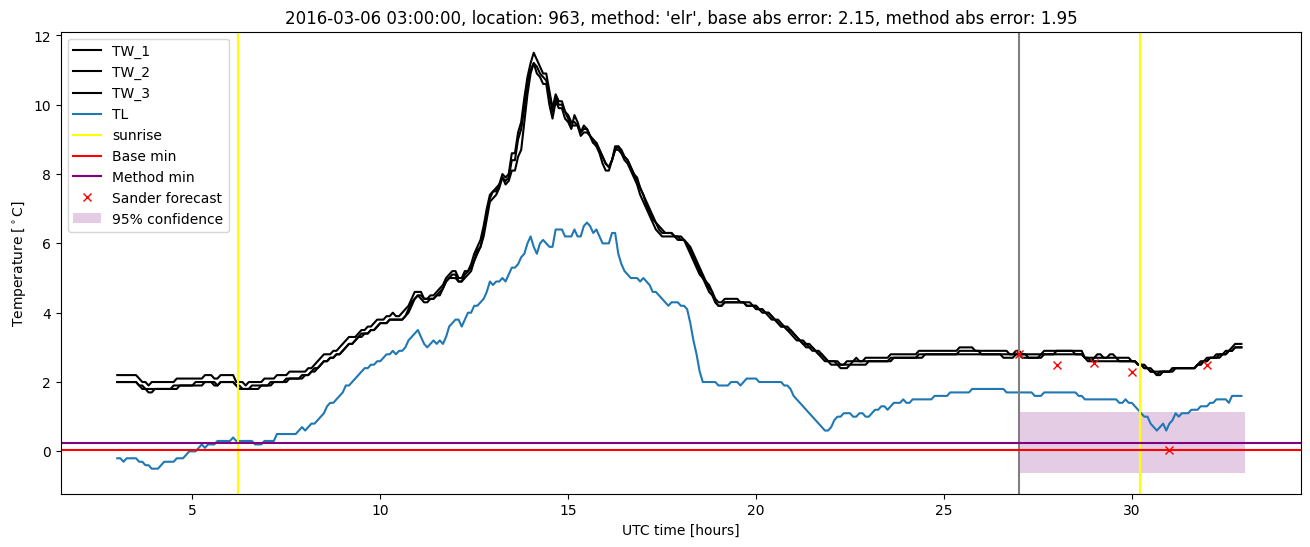
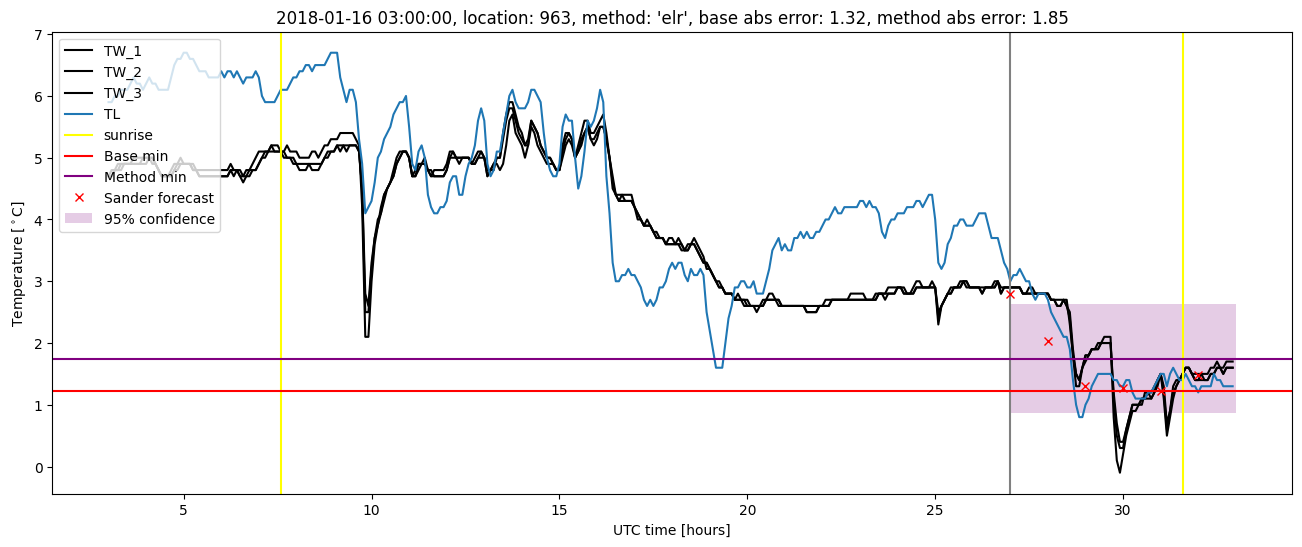
Extended logistic regression results
| names |
period |
power |
significance |
meanSquareError |
absError |
maxError |
CRPS |
IGN |
| baseline |
winter 2016 |
0.985 |
0.083 |
0.362 |
0.449 |
2.152 |
NaN |
NaN |
| elr |
winter 2016 |
0.990 |
0.000e+00 |
0.315 |
0.419 |
2.350 |
0.502 |
3.815 |
| baseline |
winter 2017 |
0.984 |
0.103 |
0.391 |
0.424 |
3.032 |
NaN |
NaN |
| elr |
winter 2017 |
0.984 |
0.103 |
0.343 |
0.423 |
2.549 |
0.488 |
3.628 |
| baseline |
winter 2018 |
0.962 |
0.080 |
0.389 |
0.449 |
2.375 |
NaN |
NaN |
| elr |
winter 2018 |
0.977 |
0.080 |
0.325 |
0.443 |
1.849 |
0.481 |
3.333 |
| baseline |
winter 2019 |
0.985 |
0.000e+00 |
0.413 |
0.476 |
2.516 |
NaN |
NaN |
| elr |
winter 2019 |
0.985 |
0.000e+00 |
0.217 |
0.349 |
1.564 |
0.475 |
2.827 |
| baseline |
all |
0.980 |
0.079 |
0.387 |
0.449 |
3.032 |
NaN |
NaN |
| elr |
all |
0.985 |
0.066 |
0.302 |
0.410 |
2.549 |
0.488 |
3.439 |
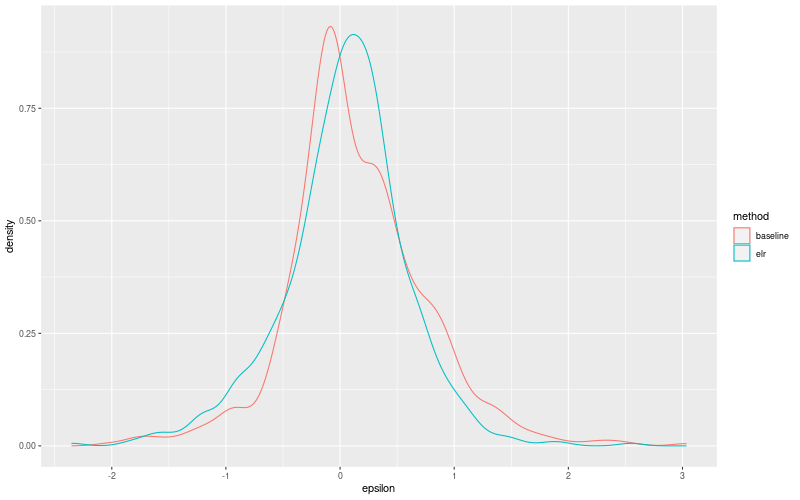
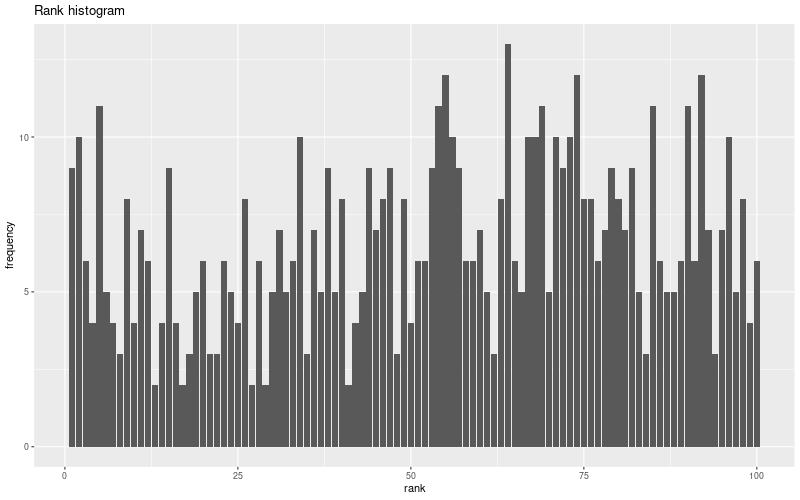
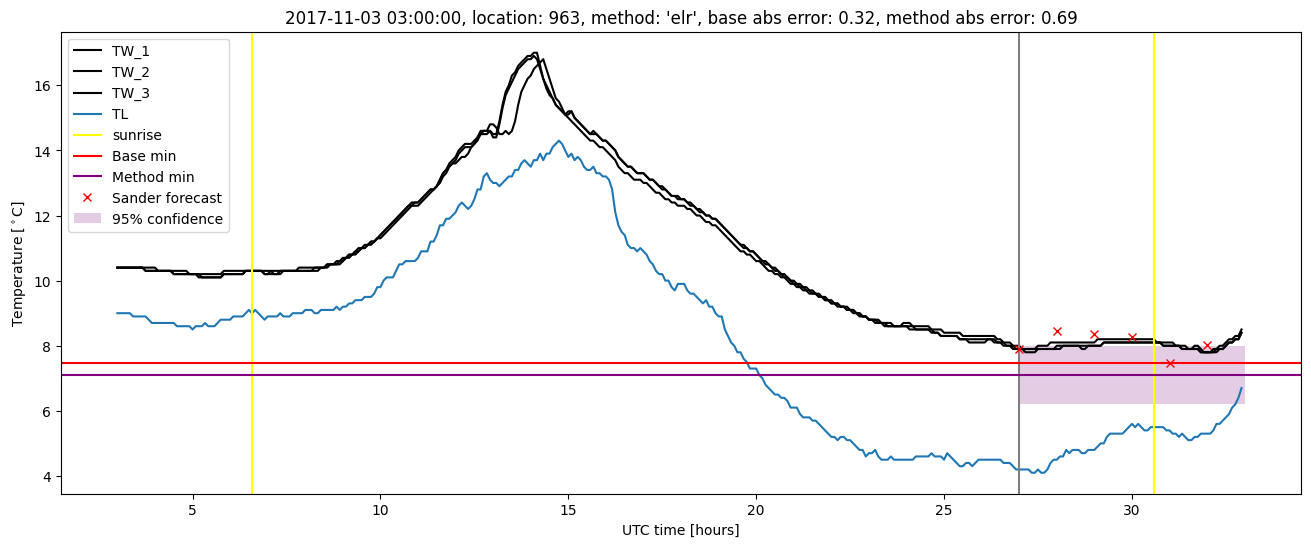
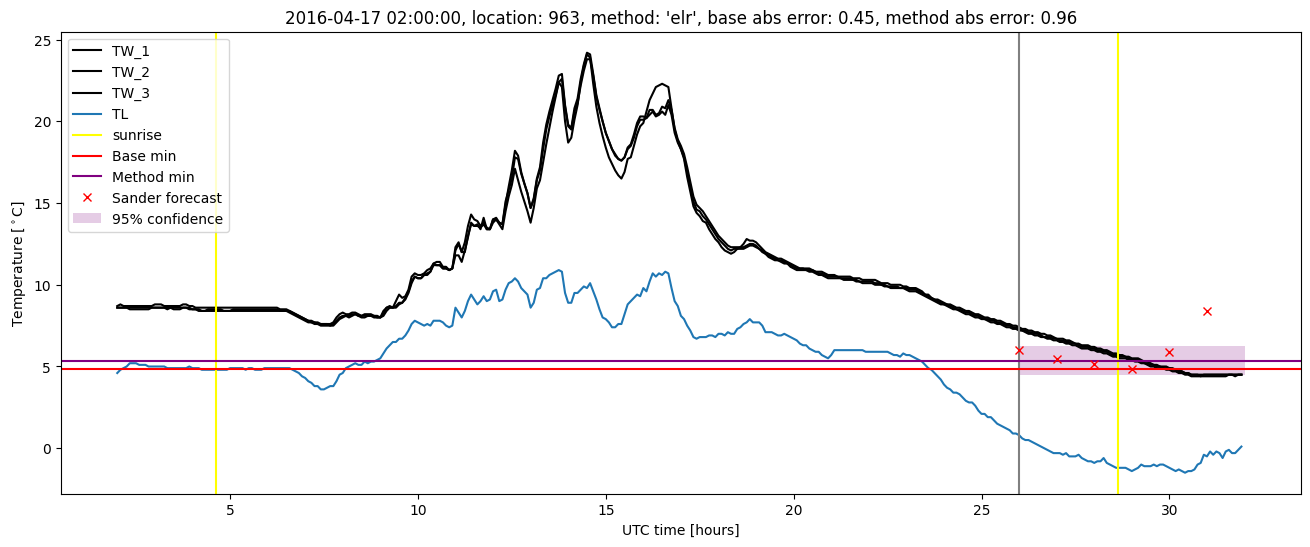
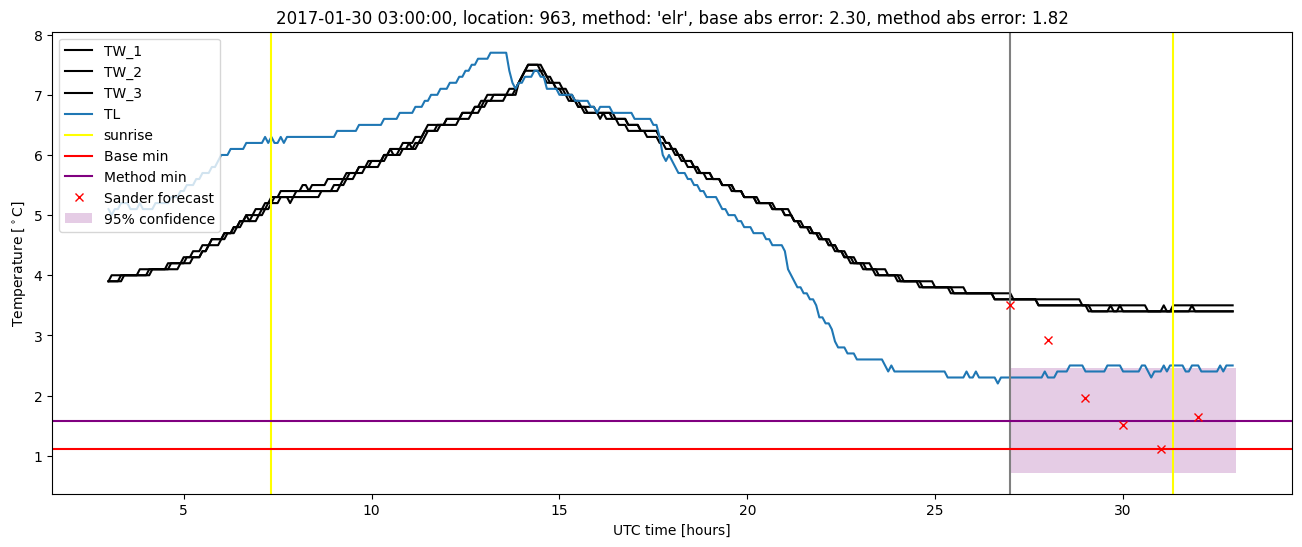
Extended logistic regression plots