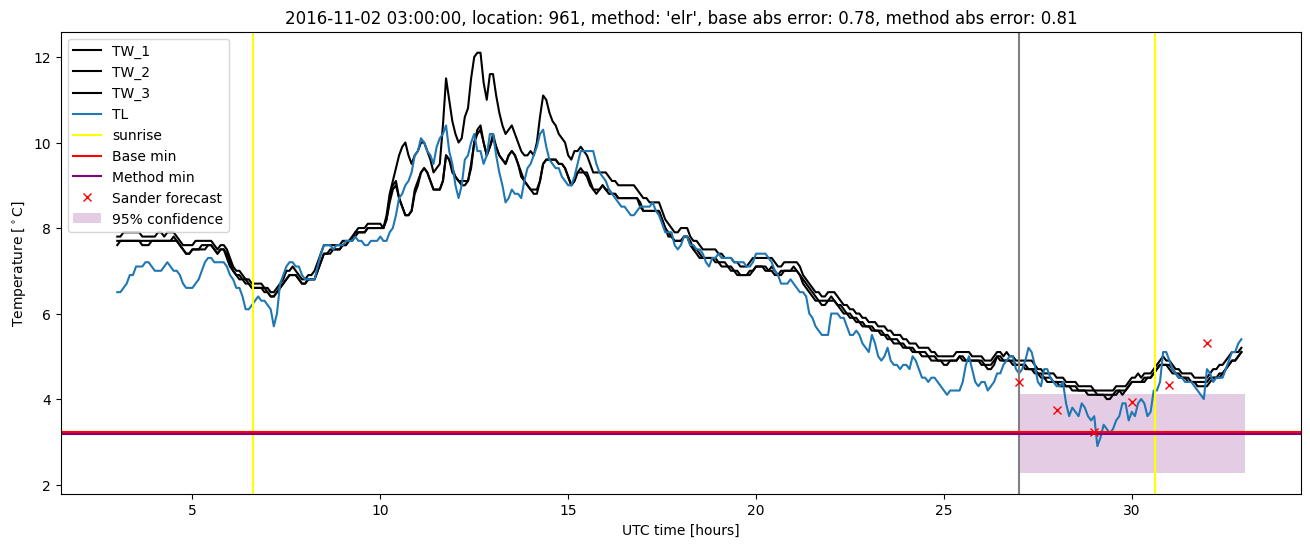
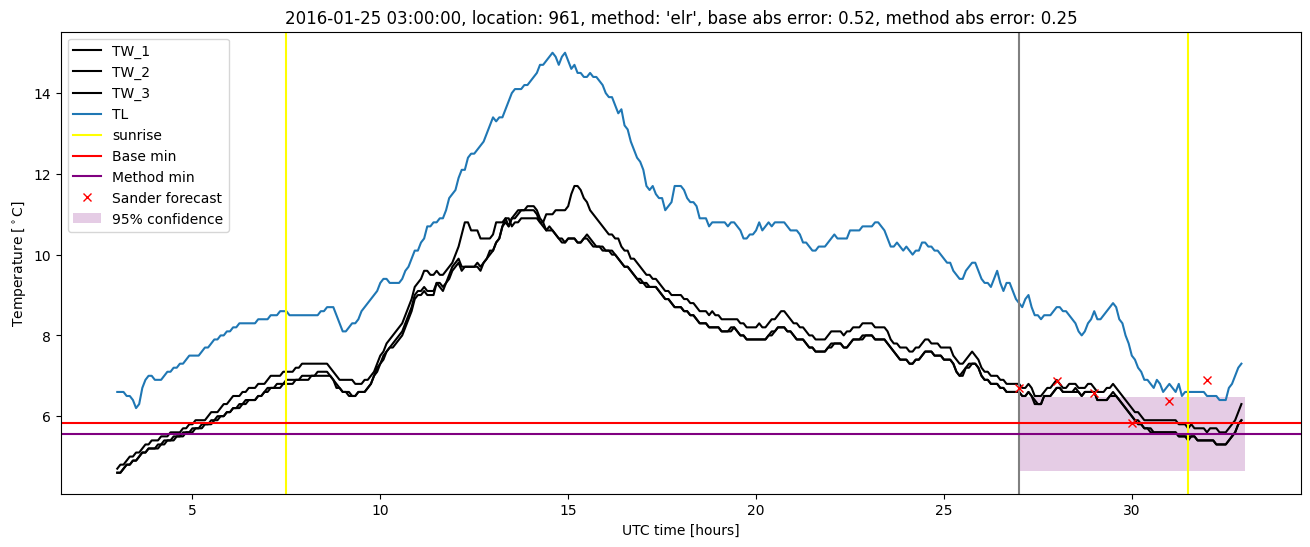
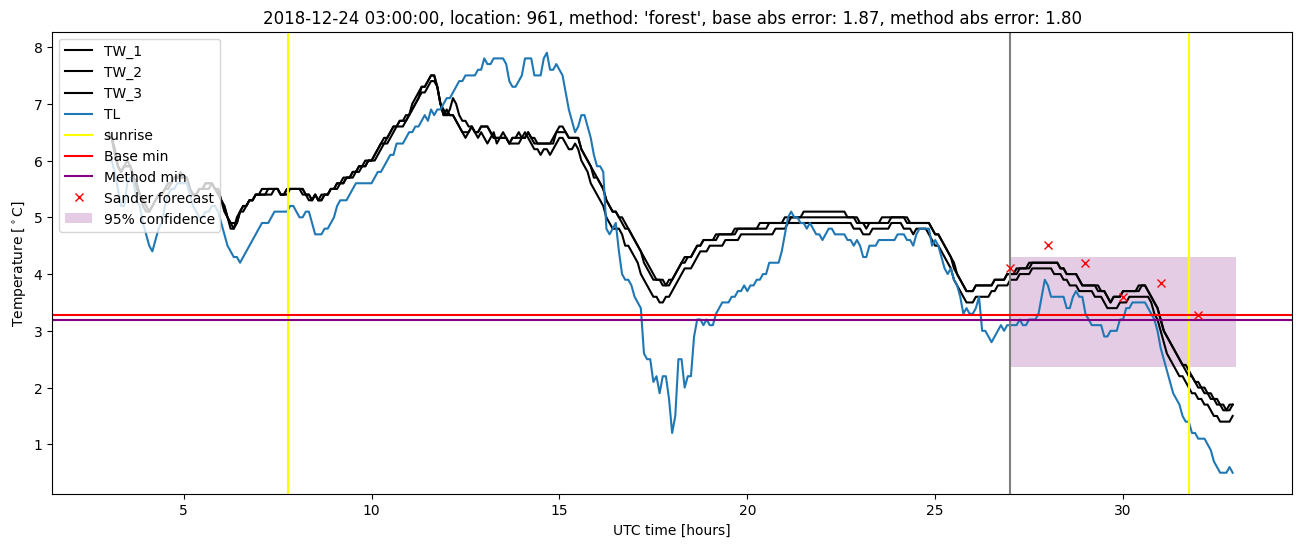
GMS location: 961
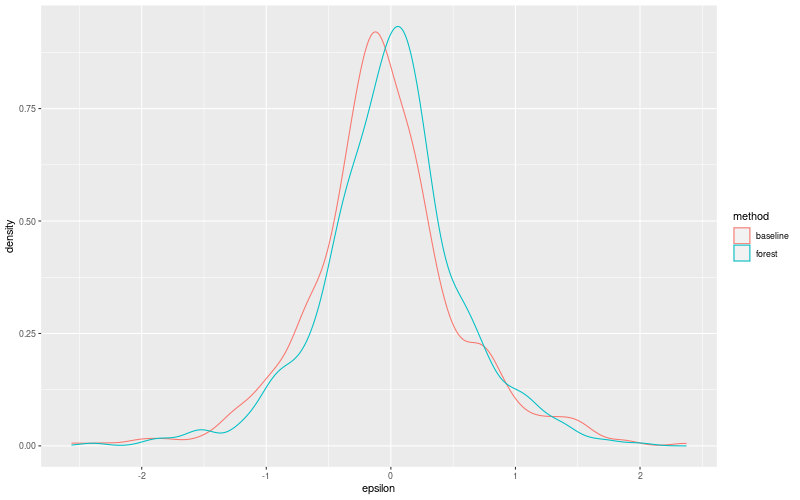
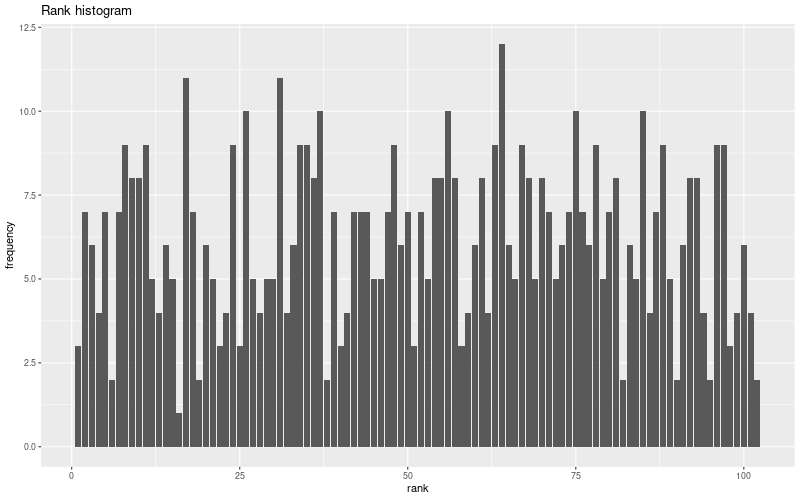
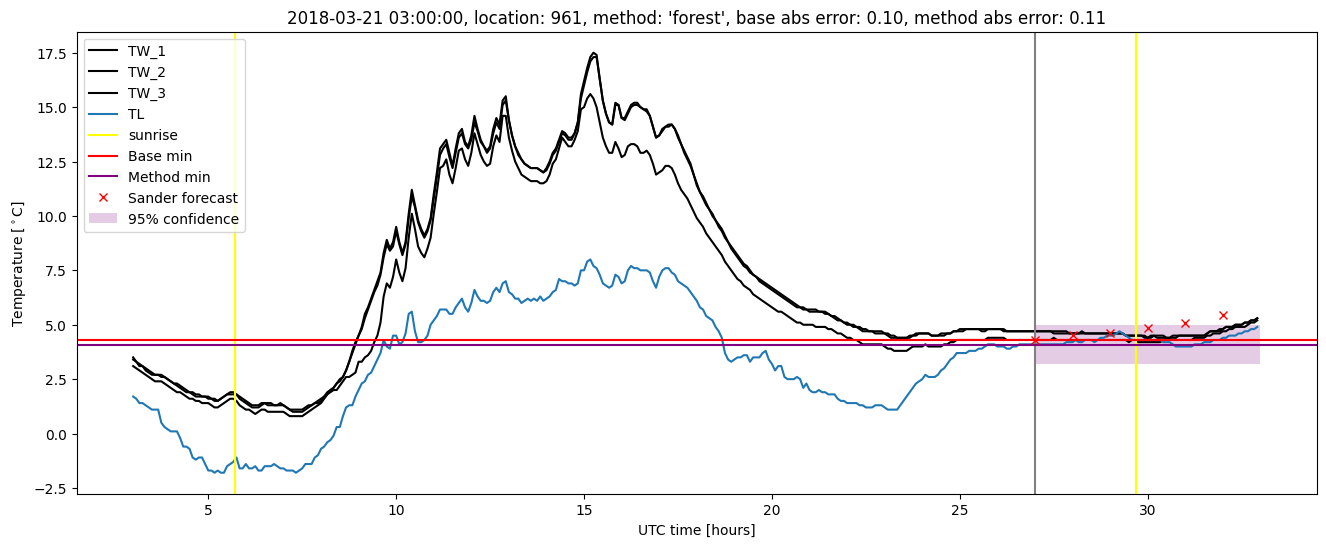
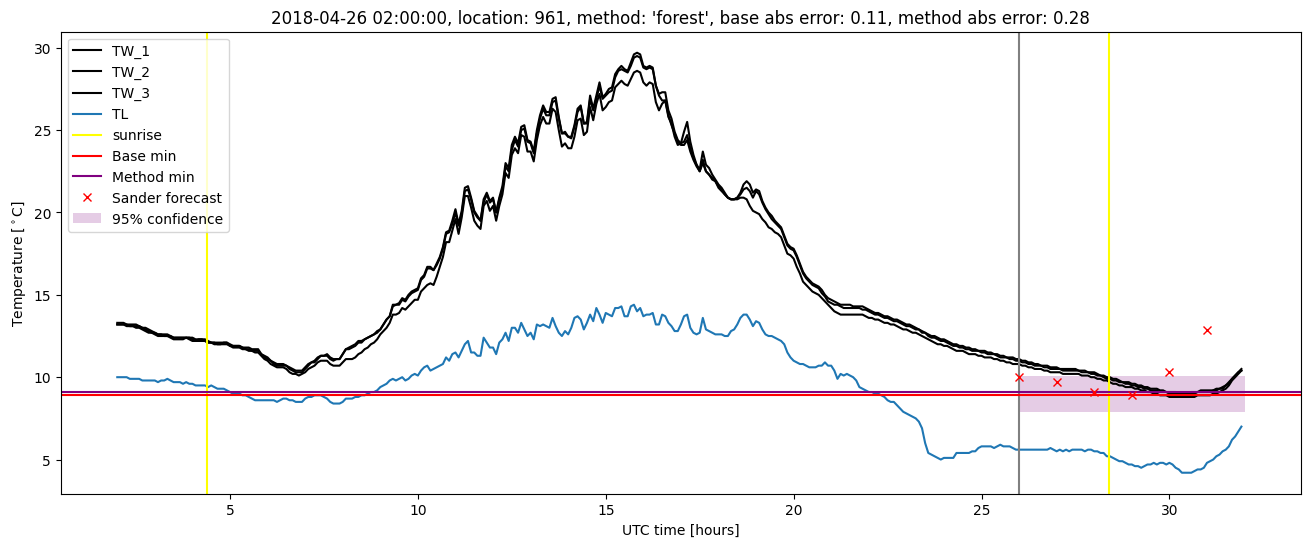
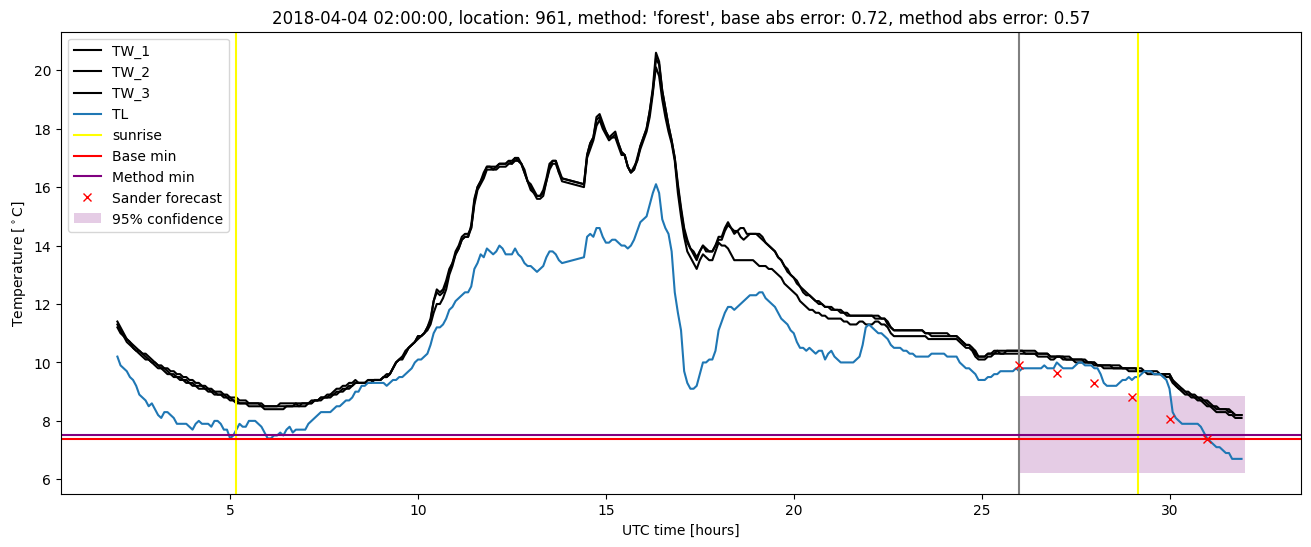
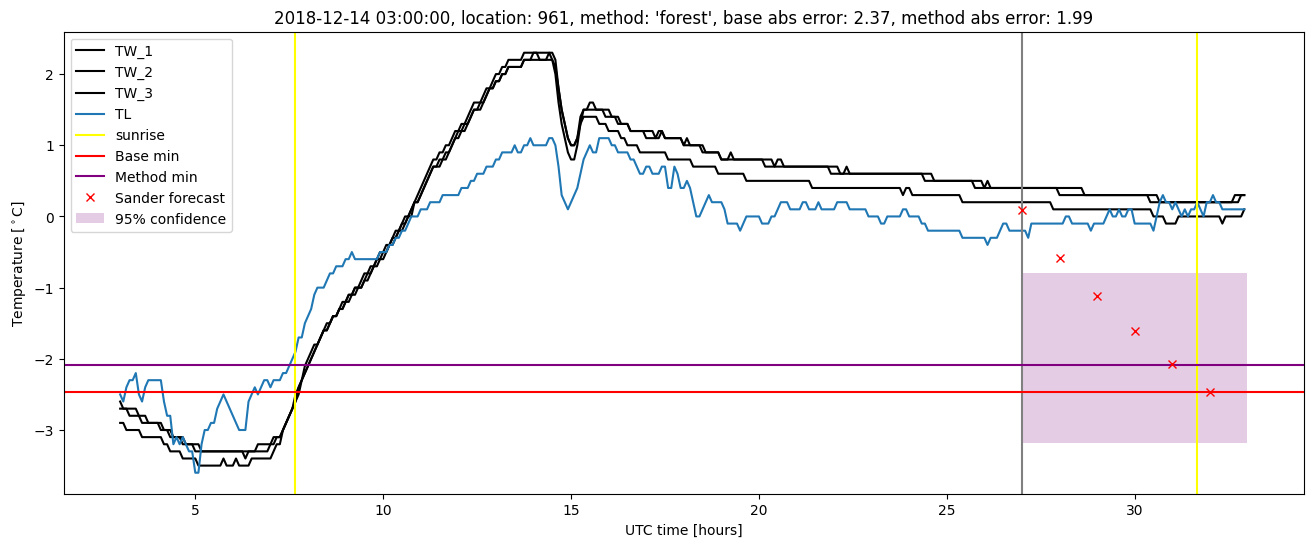
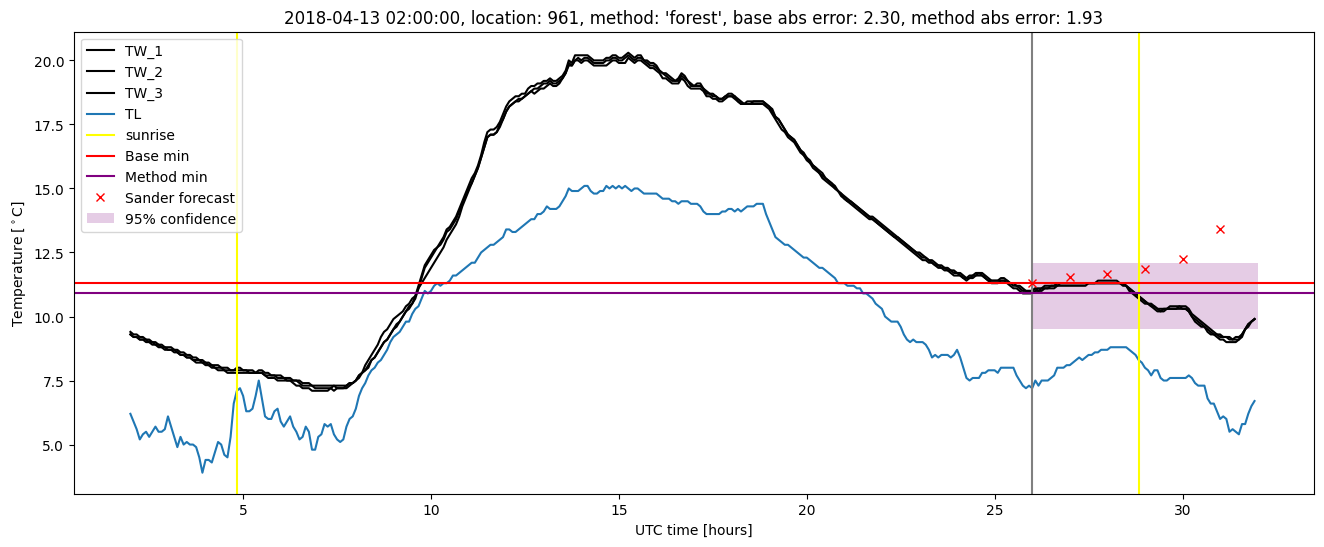
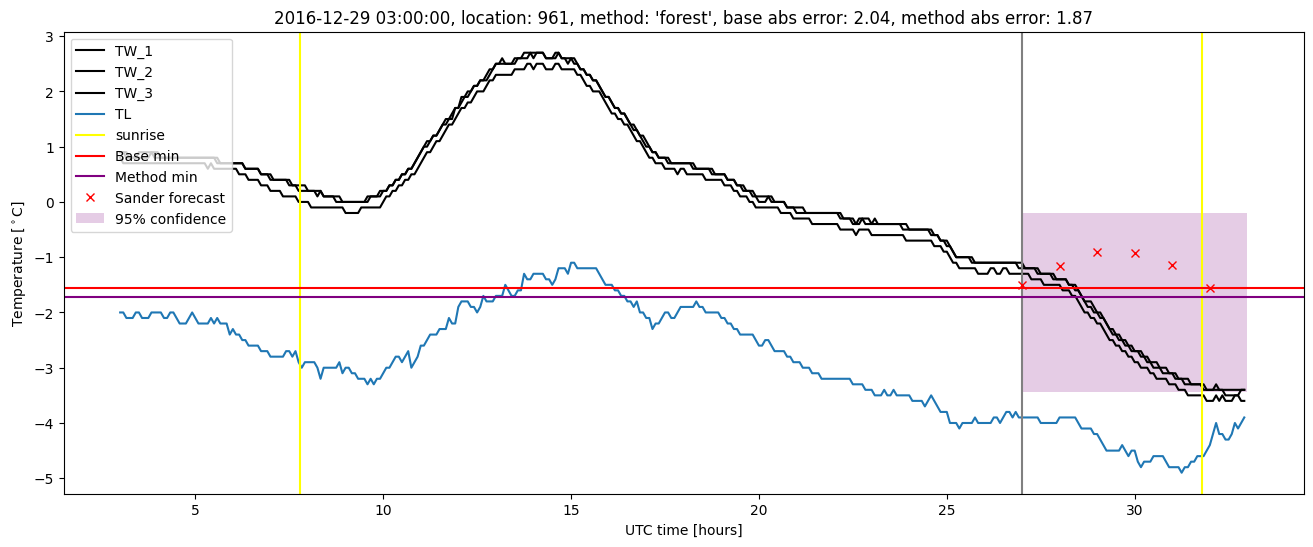
Random forest results
| names |
period |
power |
significance |
meanSquareError |
absError |
maxError |
CRPS |
IGN |
| baseline |
winter 2016 |
0.984 |
0.136 |
0.319 |
0.421 |
1.538 |
NaN |
NaN |
| forest |
winter 2016 |
0.984 |
0.136 |
0.278 |
0.404 |
1.690 |
0.506 |
4.023 |
| baseline |
winter 2017 |
0.972 |
0.135 |
0.367 |
0.426 |
2.045 |
NaN |
NaN |
| forest |
winter 2017 |
0.972 |
0.054 |
0.297 |
0.380 |
1.872 |
0.492 |
3.508 |
| baseline |
winter 2018 |
0.992 |
0.074 |
0.348 |
0.453 |
2.303 |
NaN |
NaN |
| forest |
winter 2018 |
0.992 |
0.074 |
0.313 |
0.424 |
1.928 |
0.491 |
2.633 |
| baseline |
winter 2019 |
0.983 |
0.056 |
0.449 |
0.480 |
2.561 |
NaN |
NaN |
| forest |
winter 2019 |
0.983 |
0.056 |
0.379 |
0.442 |
2.395 |
0.495 |
3.507 |
| baseline |
all |
0.983 |
0.106 |
0.364 |
0.443 |
2.561 |
NaN |
NaN |
| forest |
all |
0.983 |
0.077 |
0.312 |
0.411 |
2.395 |
0.497 |
3.466 |
Random forest plots

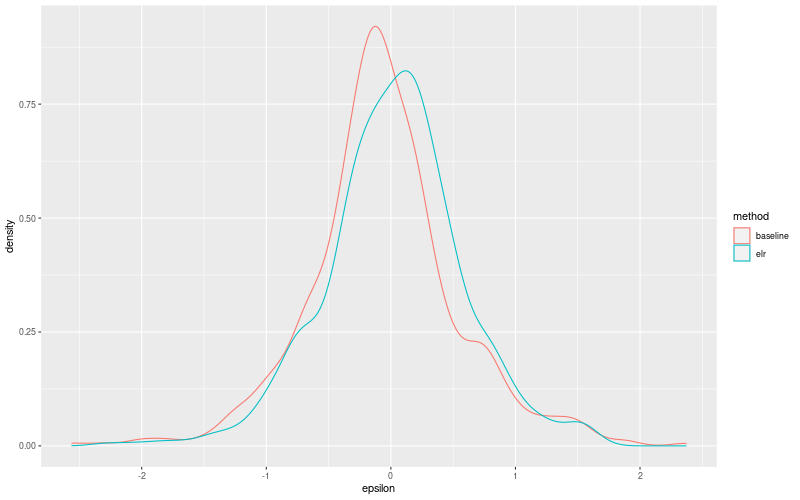
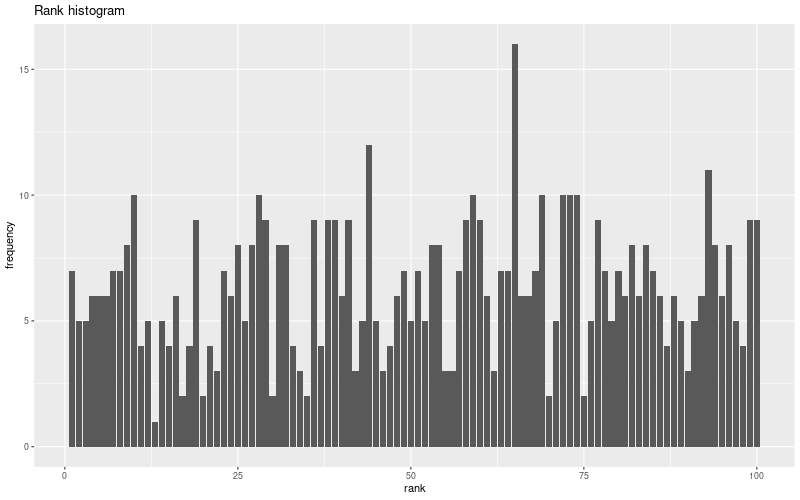
Extended logistic regression results
| names |
period |
power |
significance |
meanSquareError |
absError |
maxError |
CRPS |
IGN |
| baseline |
winter 2016 |
0.984 |
0.136 |
0.319 |
0.421 |
1.538 |
NaN |
NaN |
| elr |
winter 2016 |
0.984 |
0.136 |
0.291 |
0.417 |
1.522 |
0.572 |
4.136 |
| baseline |
winter 2017 |
0.972 |
0.135 |
0.367 |
0.426 |
2.045 |
NaN |
NaN |
| elr |
winter 2017 |
0.972 |
0.054 |
0.297 |
0.405 |
1.626 |
0.558 |
3.982 |
| baseline |
winter 2018 |
0.992 |
0.074 |
0.348 |
0.453 |
2.303 |
NaN |
NaN |
| elr |
winter 2018 |
0.992 |
0.074 |
0.342 |
0.452 |
2.070 |
0.539 |
3.987 |
| baseline |
winter 2019 |
0.983 |
0.056 |
0.449 |
0.480 |
2.561 |
NaN |
NaN |
| elr |
winter 2019 |
0.983 |
0.056 |
0.334 |
0.425 |
2.289 |
0.543 |
3.908 |
| baseline |
all |
0.983 |
0.106 |
0.364 |
0.443 |
2.561 |
NaN |
NaN |
| elr |
all |
0.983 |
0.077 |
0.314 |
0.425 |
2.289 |
0.555 |
4.017 |
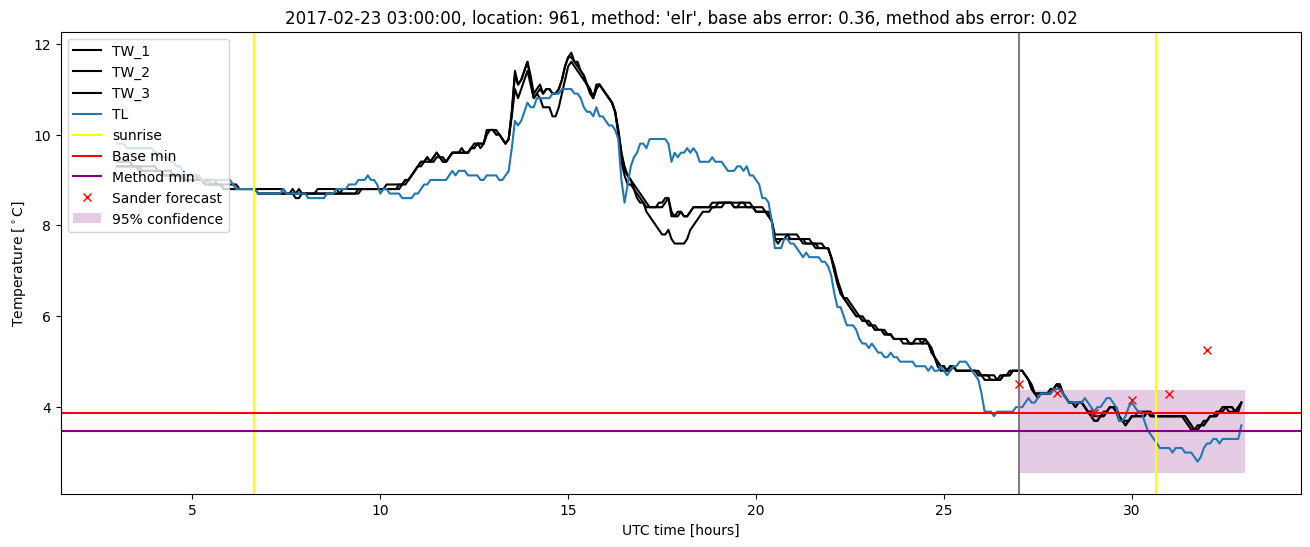
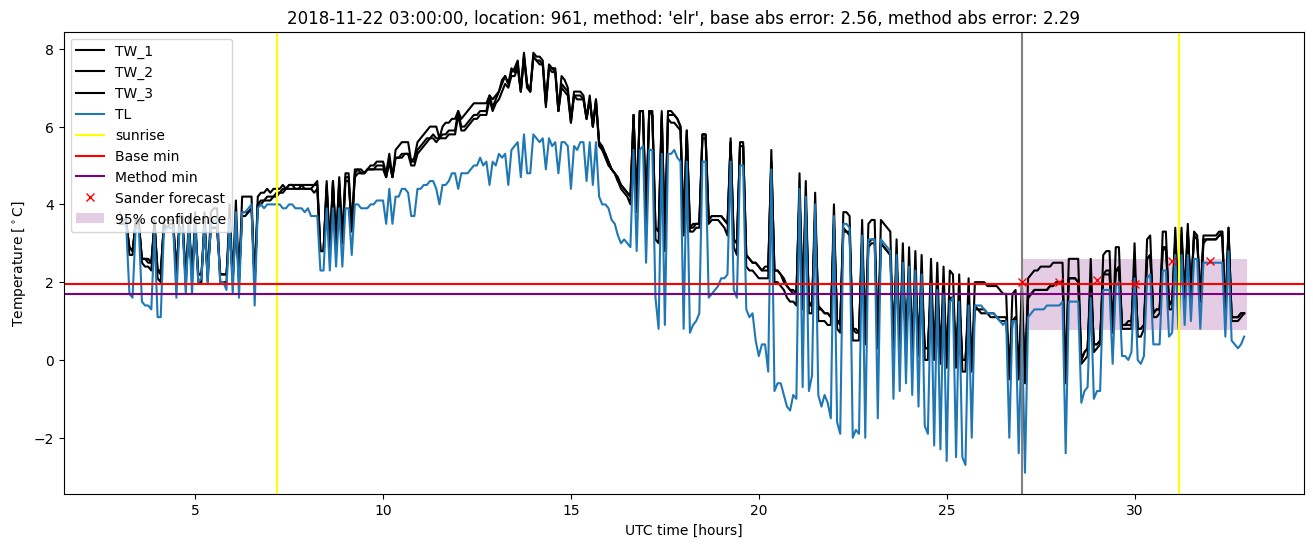
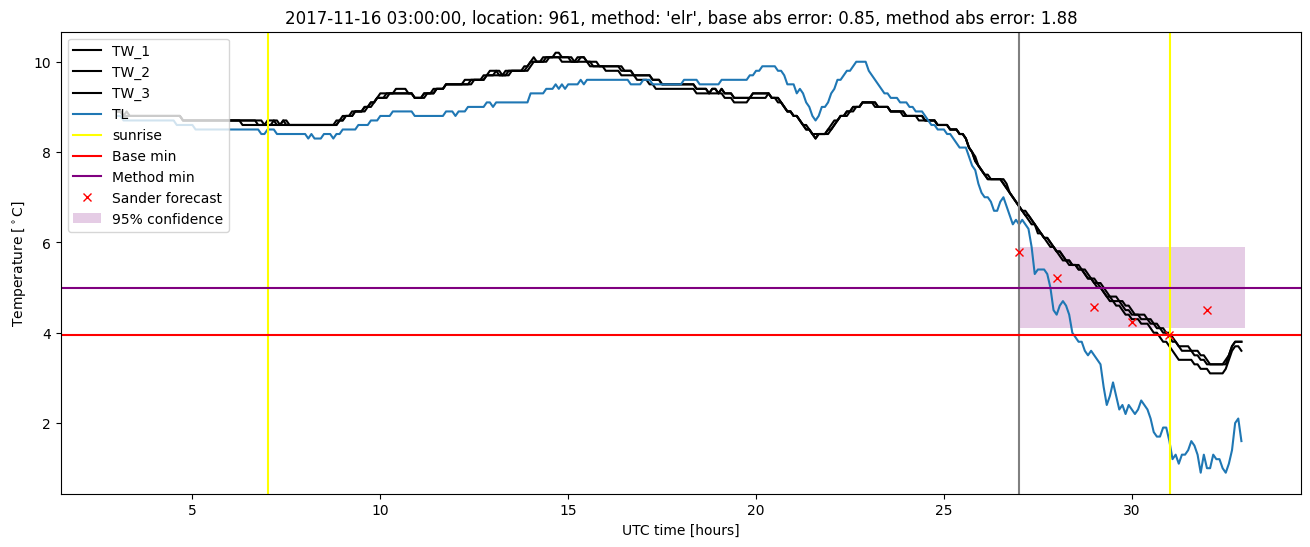
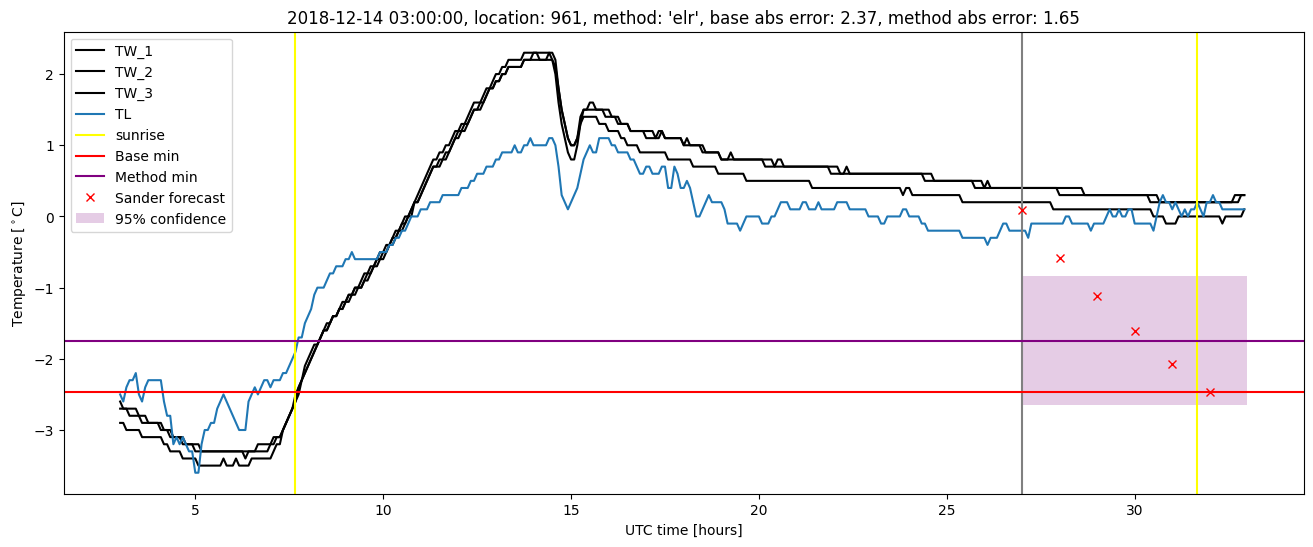
Extended logistic regression plots