GMS location: 958
Random forest results
| names |
period |
power |
significance |
meanSquareError |
absError |
maxError |
CRPS |
IGN |
| baseline |
winter 2016 |
0.977 |
0.111 |
0.354 |
0.465 |
1.576 |
NaN |
NaN |
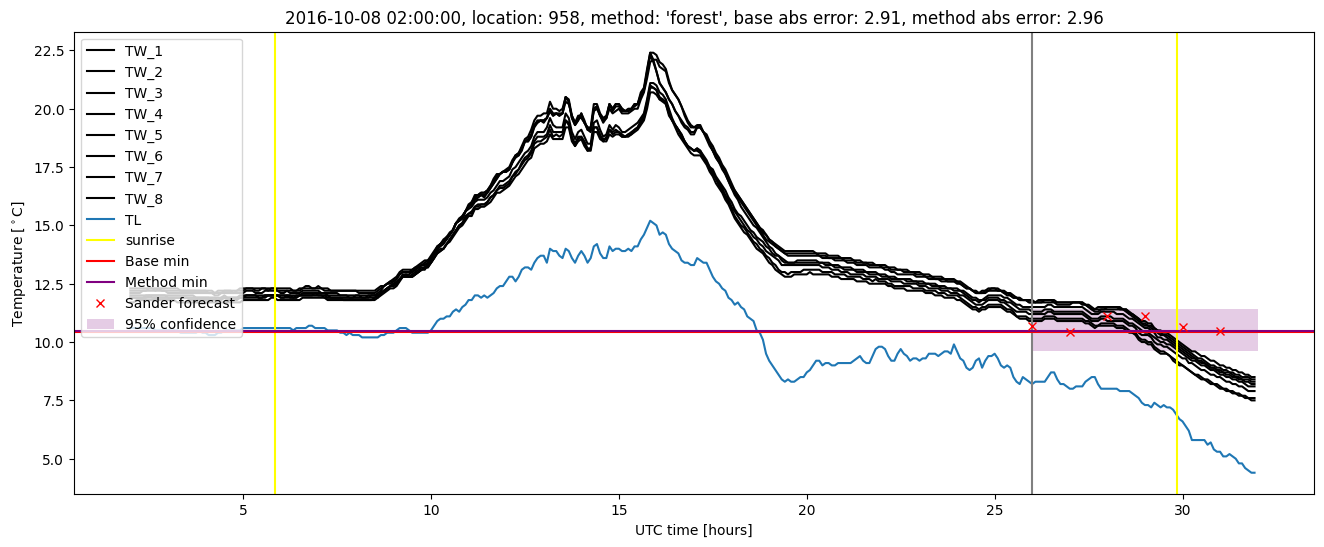
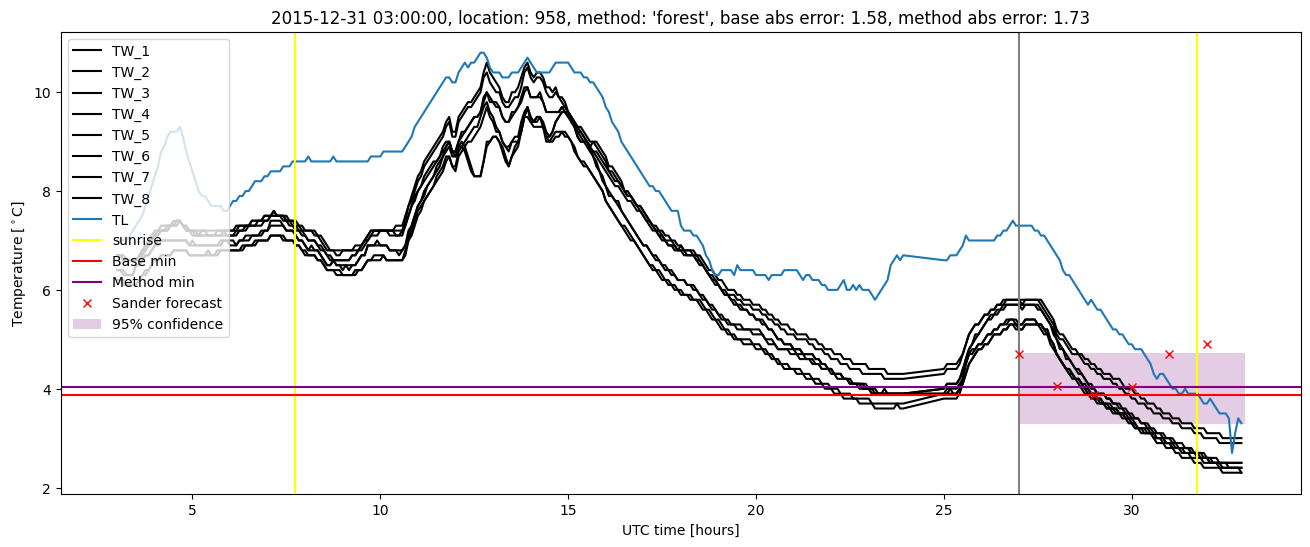
| forest |
winter 2016 |
0.983 |
0.111 |
0.269 |
0.398 |
1.734 |
0.477 |
6.319 |
| baseline |
winter 2017 |
0.975 |
0.065 |
0.374 |
0.424 |
2.912 |
NaN |
NaN |
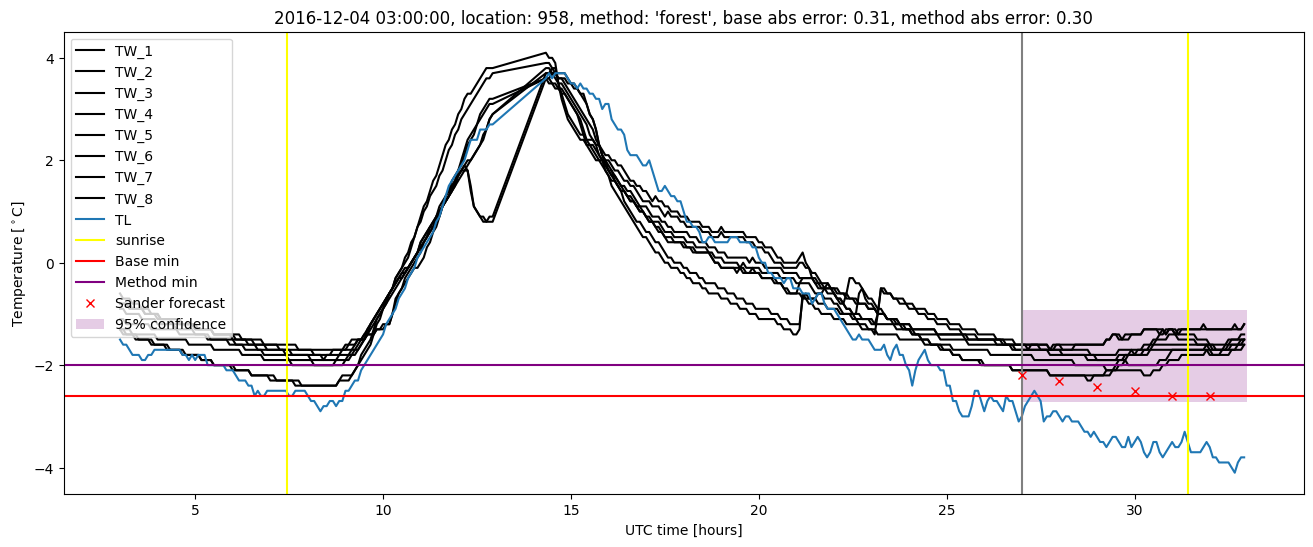
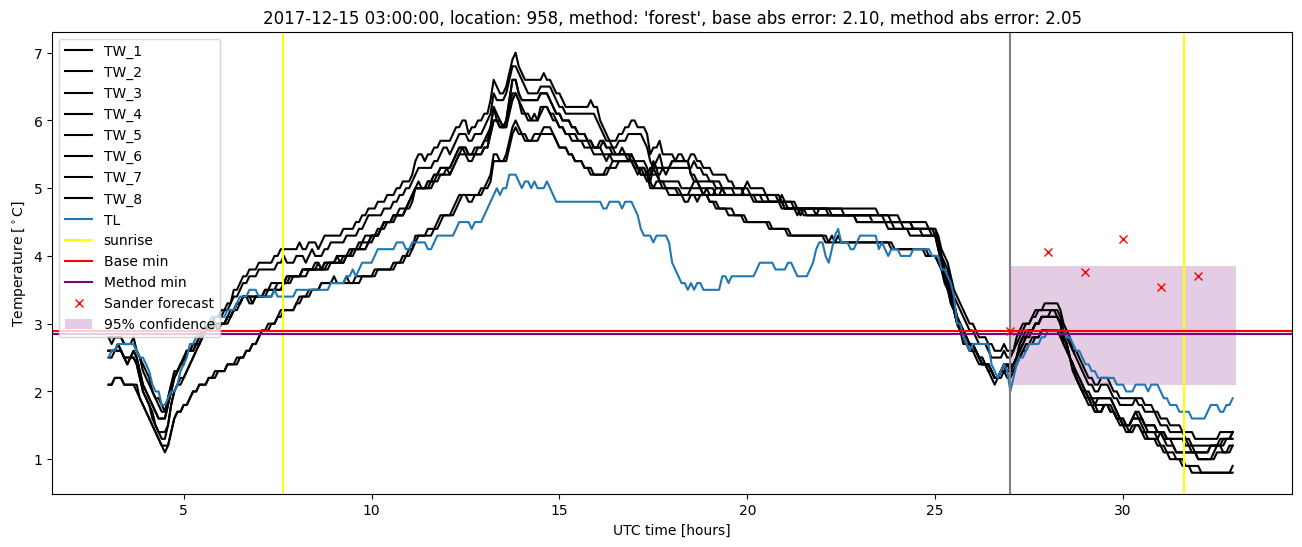
| forest |
winter 2017 |
0.967 |
0.032 |
0.255 |
0.334 |
2.955 |
0.474 |
4.229 |
| baseline |
winter 2018 |
0.985 |
0.250 |
0.327 |
0.420 |
2.099 |
NaN |
NaN |
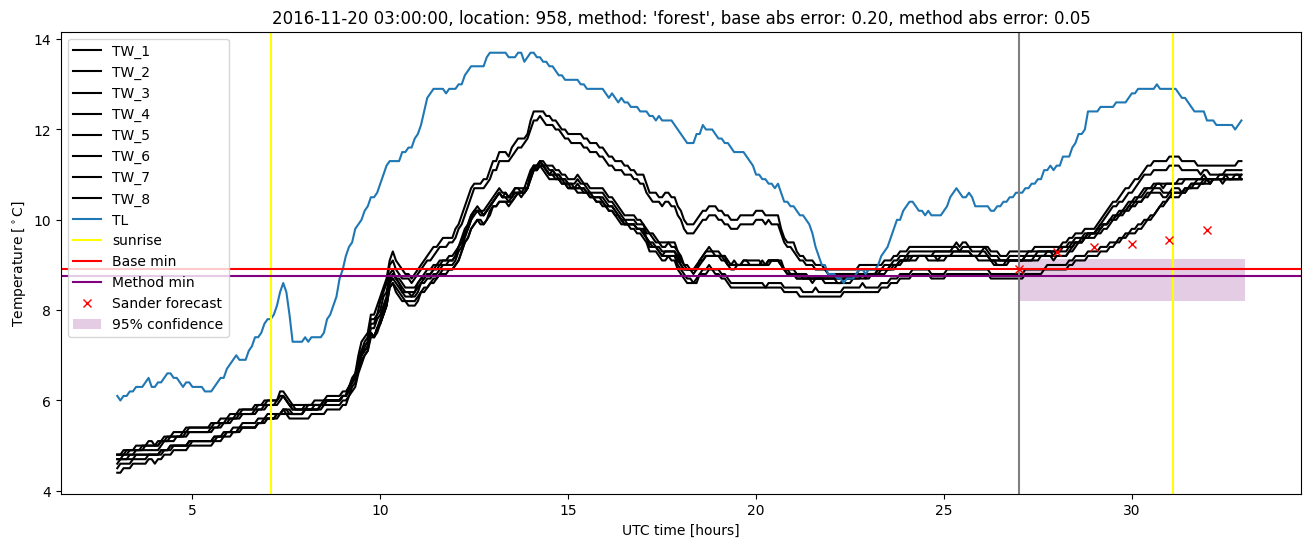
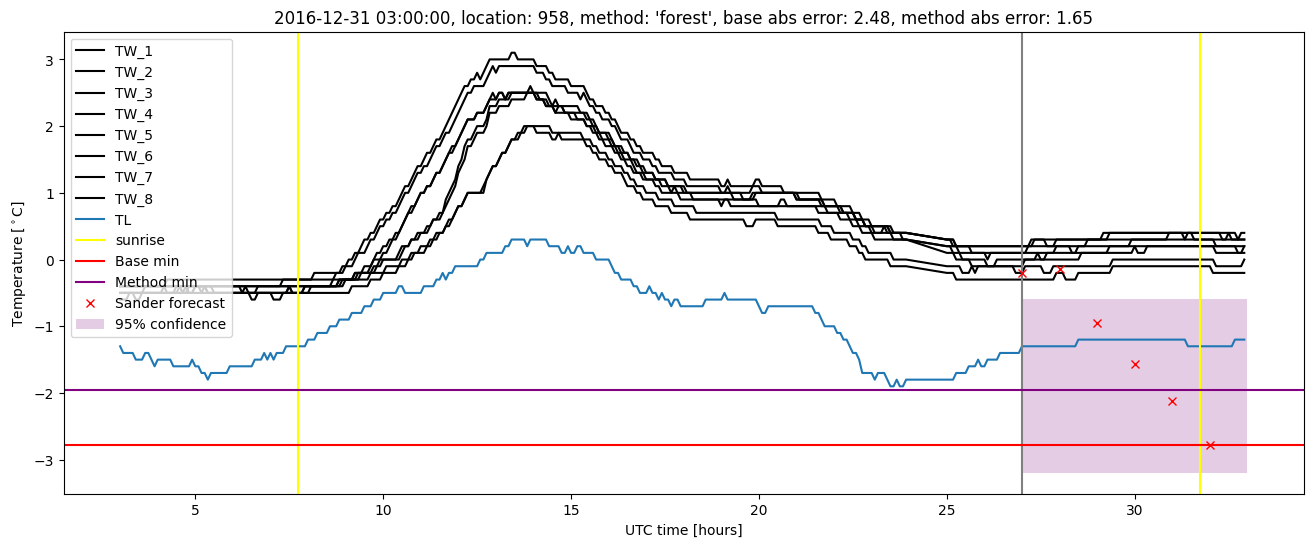
| forest |
winter 2018 |
0.985 |
0.250 |
0.271 |
0.369 |
2.051 |
0.483 |
3.642 |
| baseline |
winter 2019 |
0.979 |
0.000e+00 |
0.379 |
0.445 |
2.181 |
NaN |
NaN |
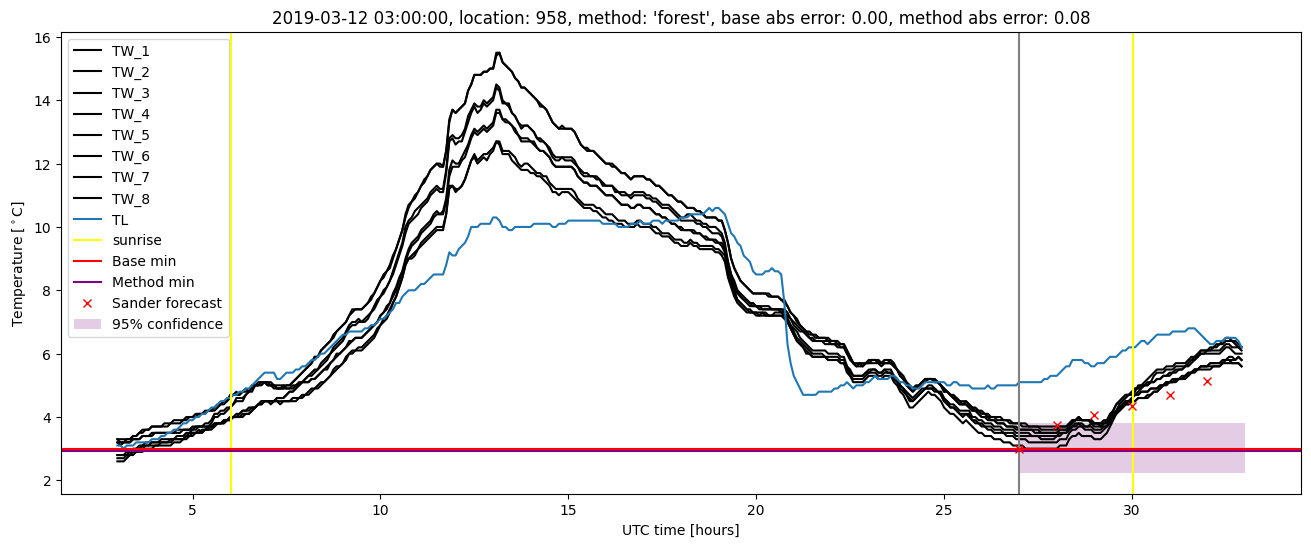
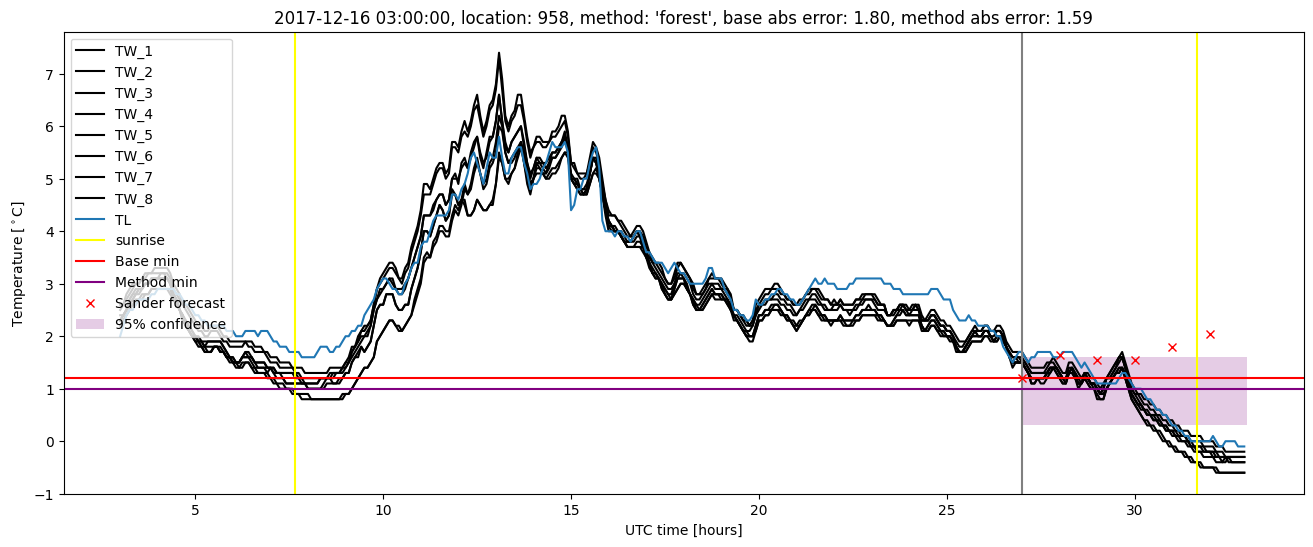
| forest |
winter 2019 |
0.993 |
0.000e+00 |
0.228 |
0.360 |
1.546 |
0.451 |
3.054 |
| baseline |
all |
0.978 |
0.075 |
0.363 |
0.443 |
2.912 |
NaN |
NaN |
| forest |
all |
0.982 |
0.060 |
0.254 |
0.367 |
2.955 |
0.470 |
4.548 |
Random forest plots
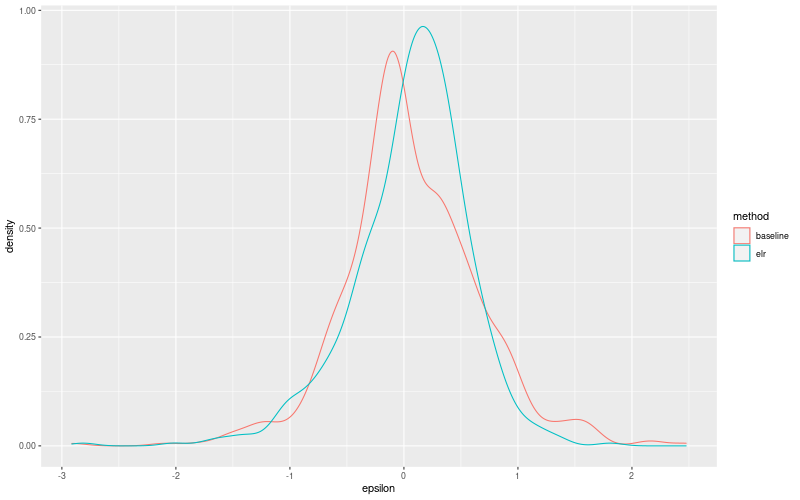
Extended logistic regression results
| names |
period |
power |
significance |
meanSquareError |
absError |
maxError |
CRPS |
IGN |
| baseline |
winter 2016 |
0.977 |
0.111 |
0.354 |
0.465 |
1.576 |
NaN |
NaN |
| elr |
winter 2016 |
0.989 |
0.111 |
0.257 |
0.394 |
1.739 |
0.571 |
7.313 |
| baseline |
winter 2017 |
0.975 |
0.065 |
0.374 |
0.424 |
2.912 |
NaN |
NaN |
| elr |
winter 2017 |
0.975 |
0.065 |
0.278 |
0.376 |
2.815 |
0.572 |
7.078 |
| baseline |
winter 2018 |
0.985 |
0.250 |
0.327 |
0.420 |
2.099 |
NaN |
NaN |
| elr |
winter 2018 |
0.970 |
0.250 |
0.326 |
0.431 |
2.020 |
0.608 |
8.162 |
| baseline |
winter 2019 |
0.979 |
0.000e+00 |
0.379 |
0.445 |
2.181 |
NaN |
NaN |
| elr |
winter 2019 |
0.979 |
0.000e+00 |
0.218 |
0.373 |
1.376 |
0.541 |
5.891 |
| baseline |
all |
0.978 |
0.075 |
0.363 |
0.443 |
2.912 |
NaN |
NaN |
| elr |
all |
0.980 |
0.075 |
0.261 |
0.388 |
2.815 |
0.568 |
6.969 |
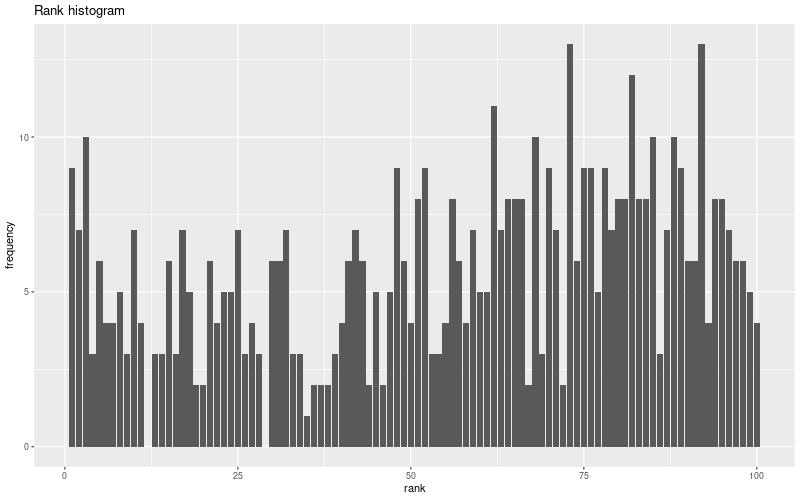
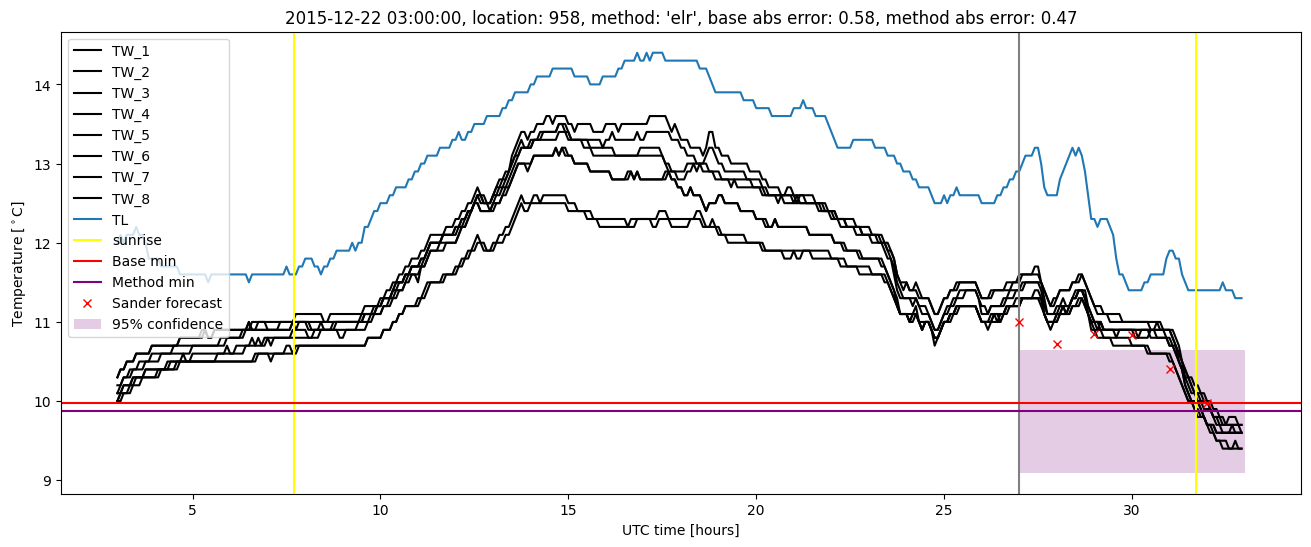
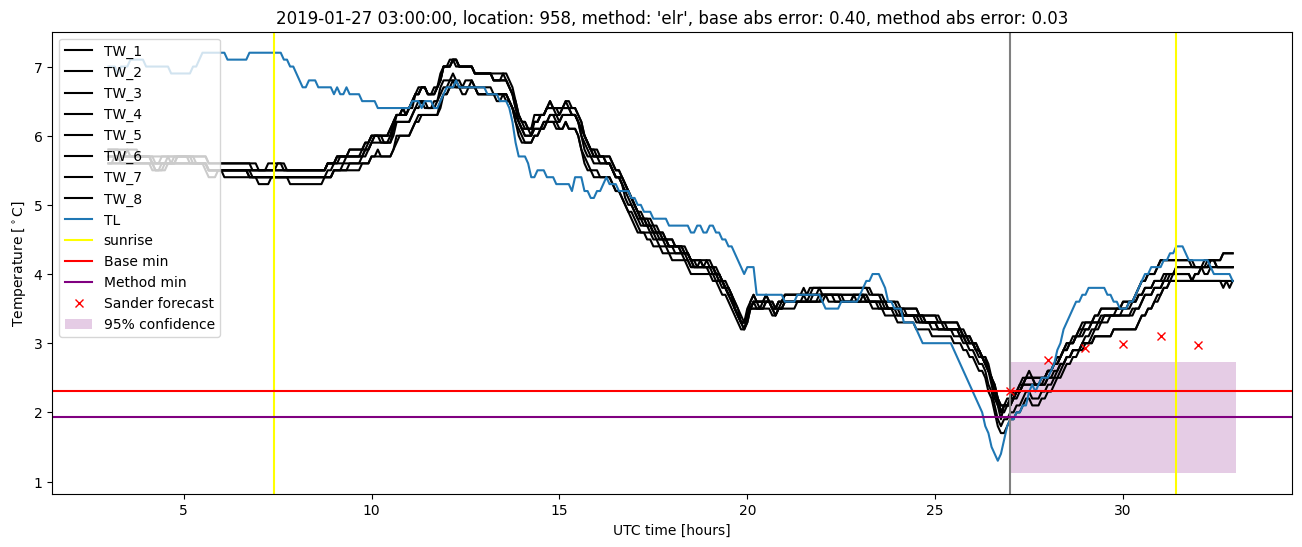
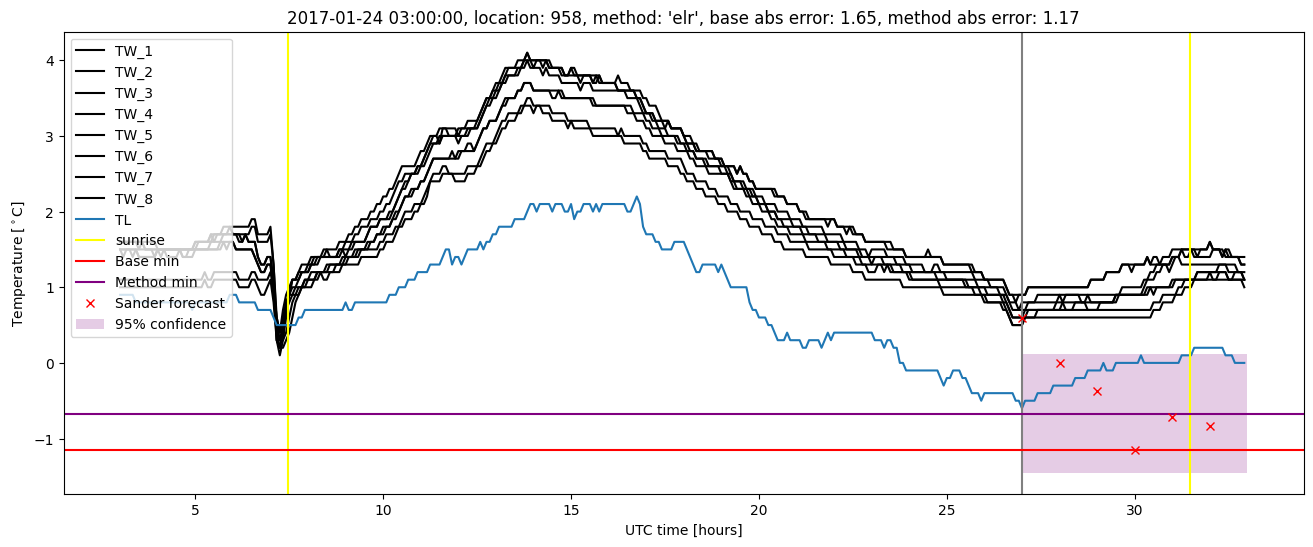
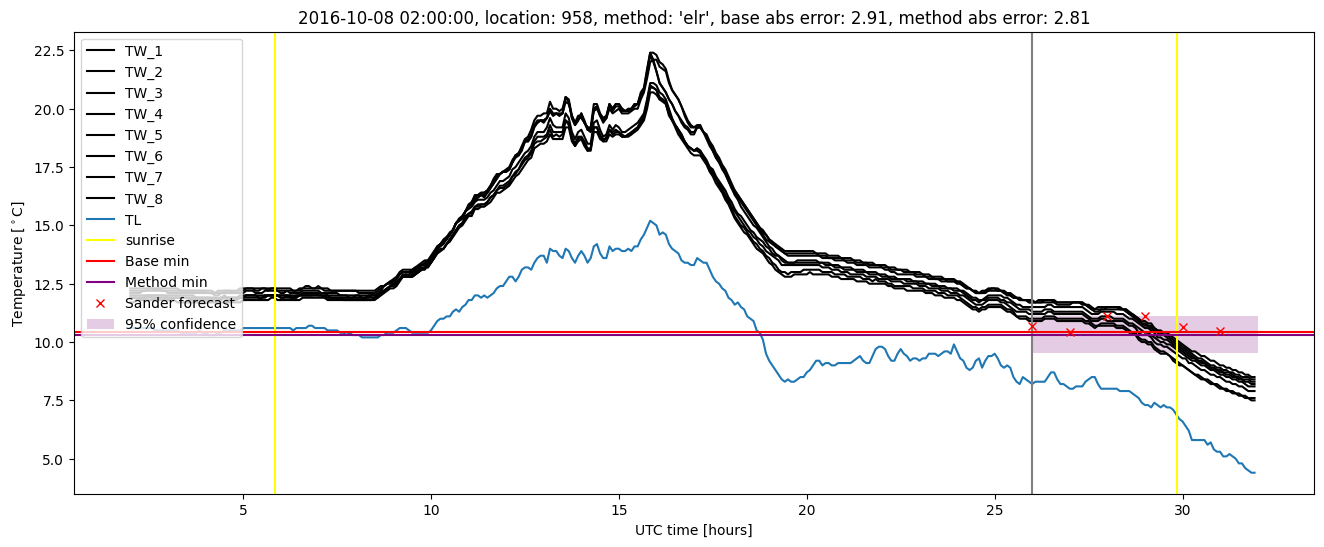
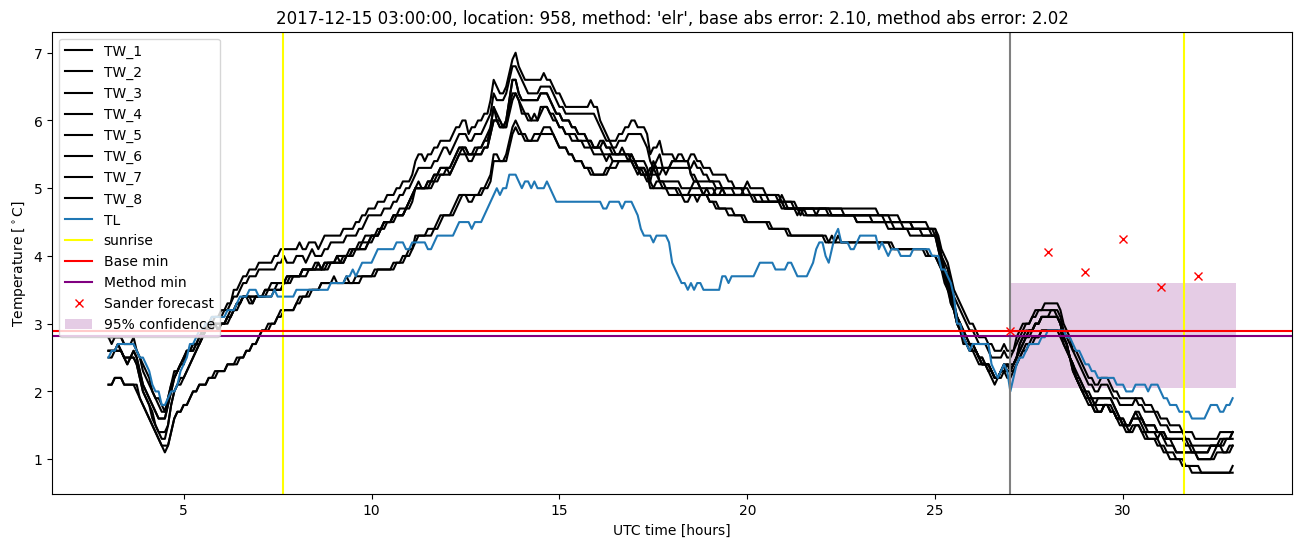
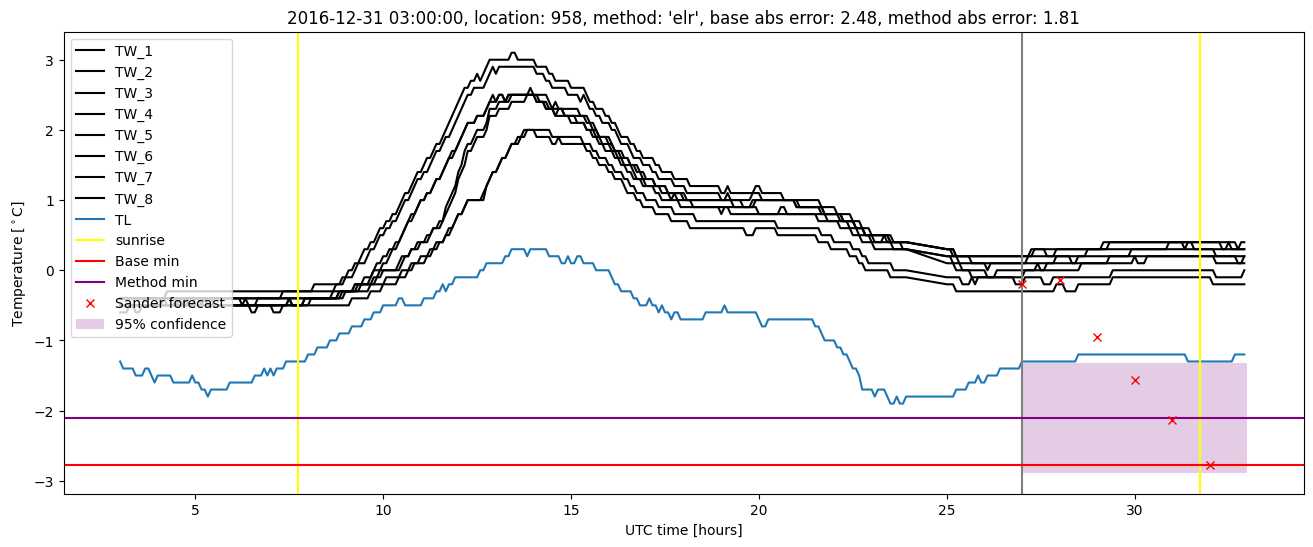
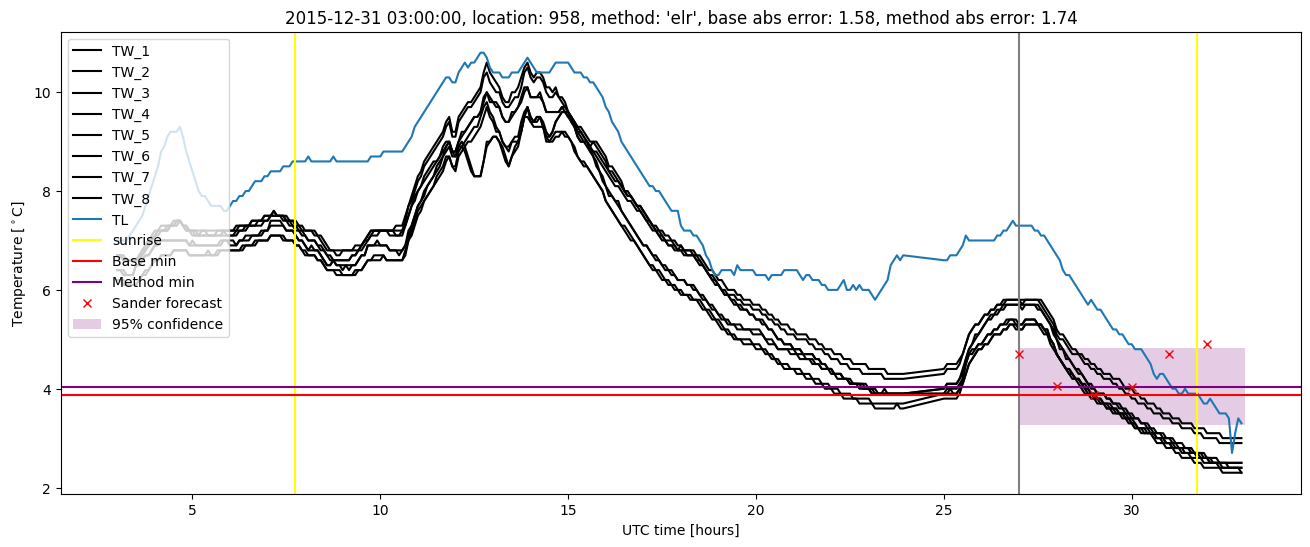
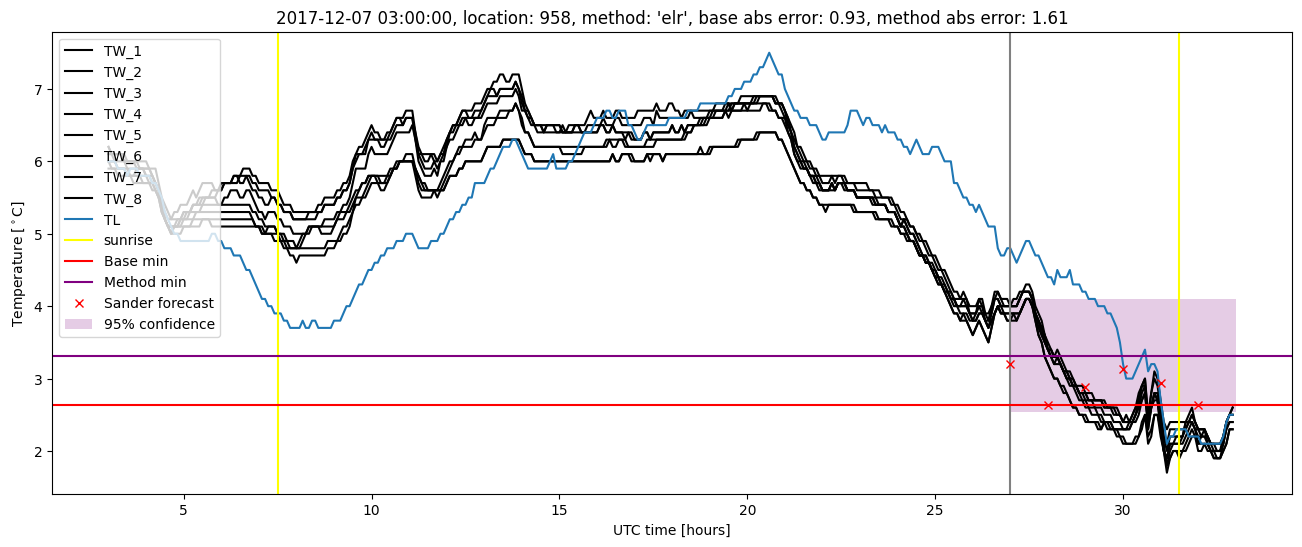
Extended logistic regression plots