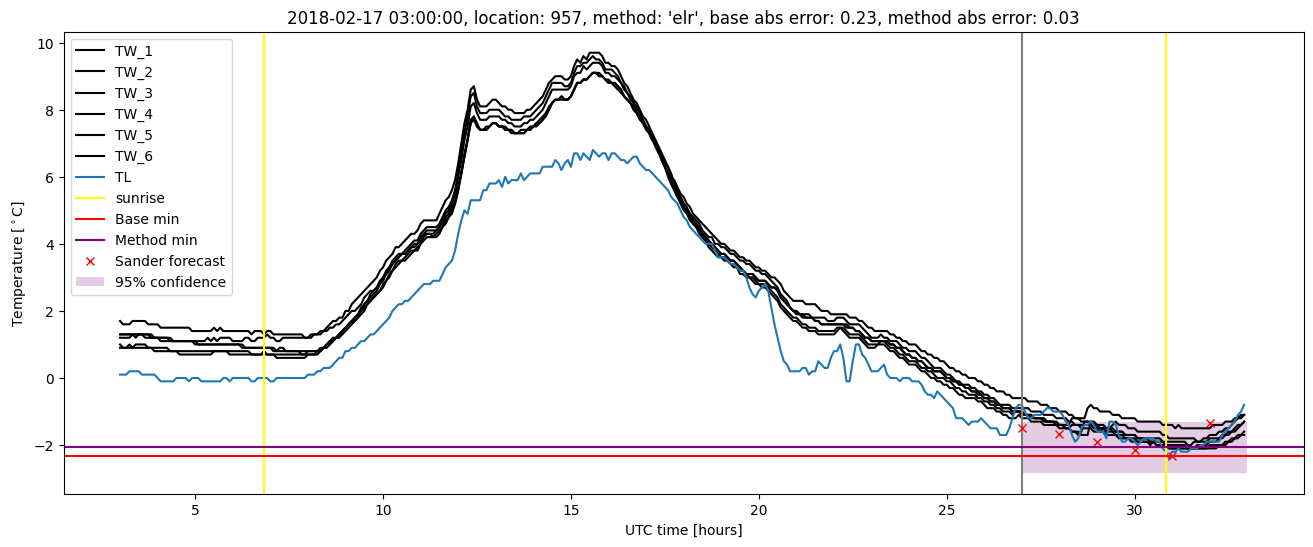
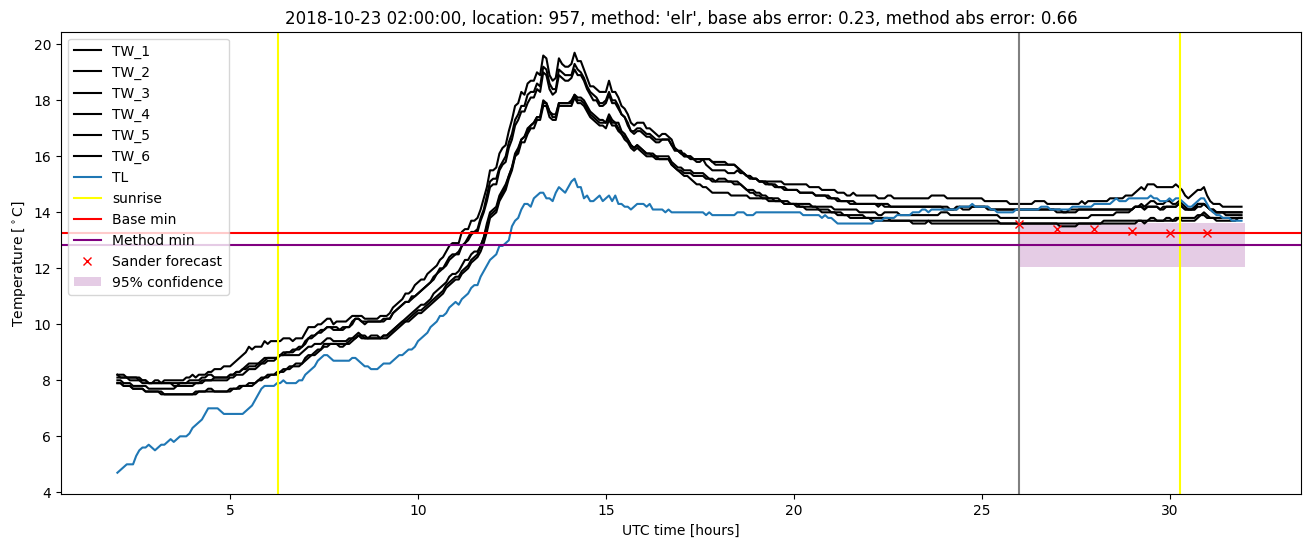
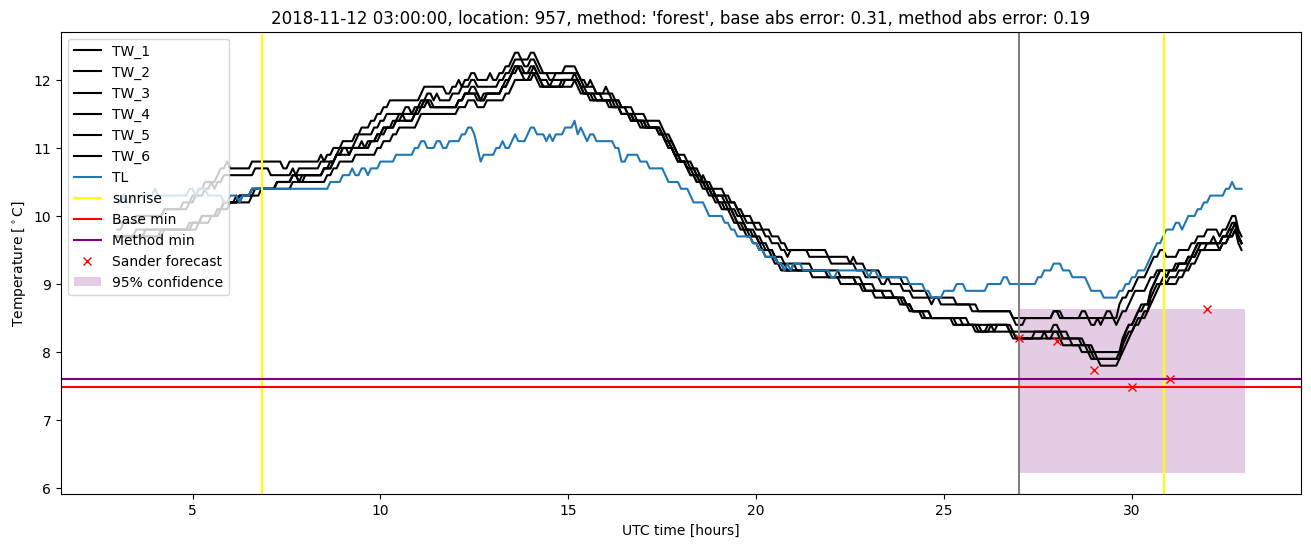
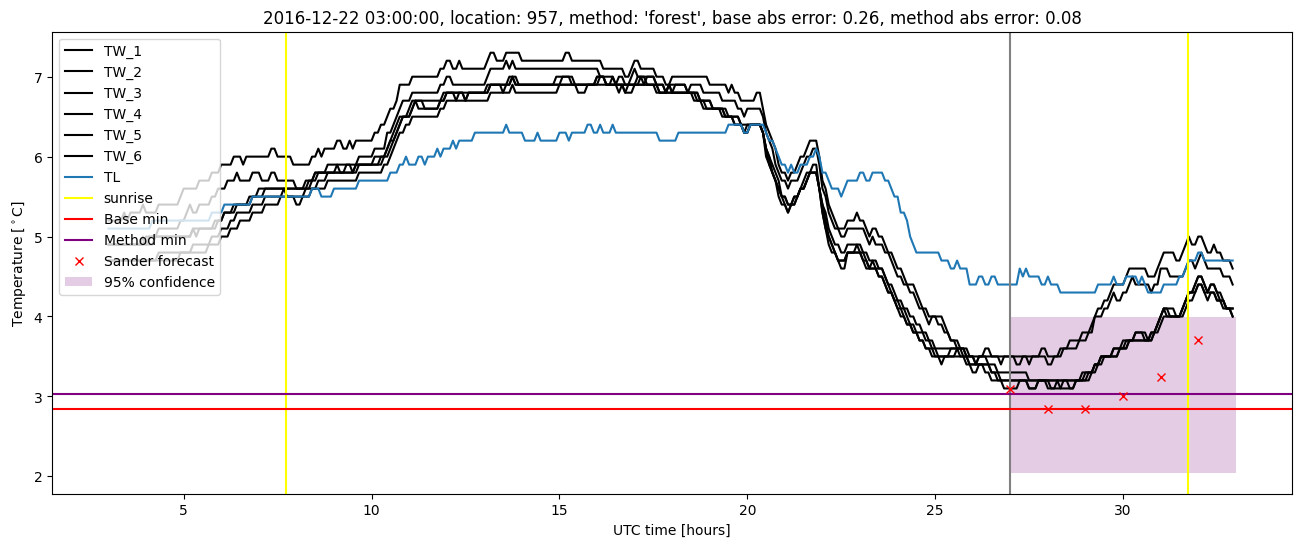
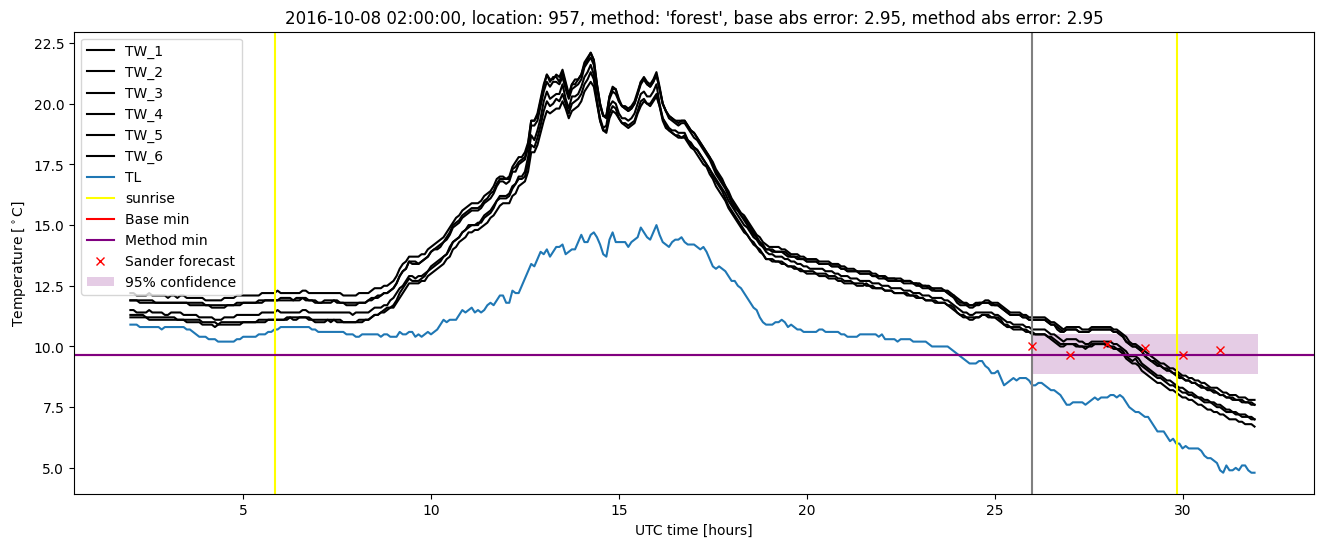
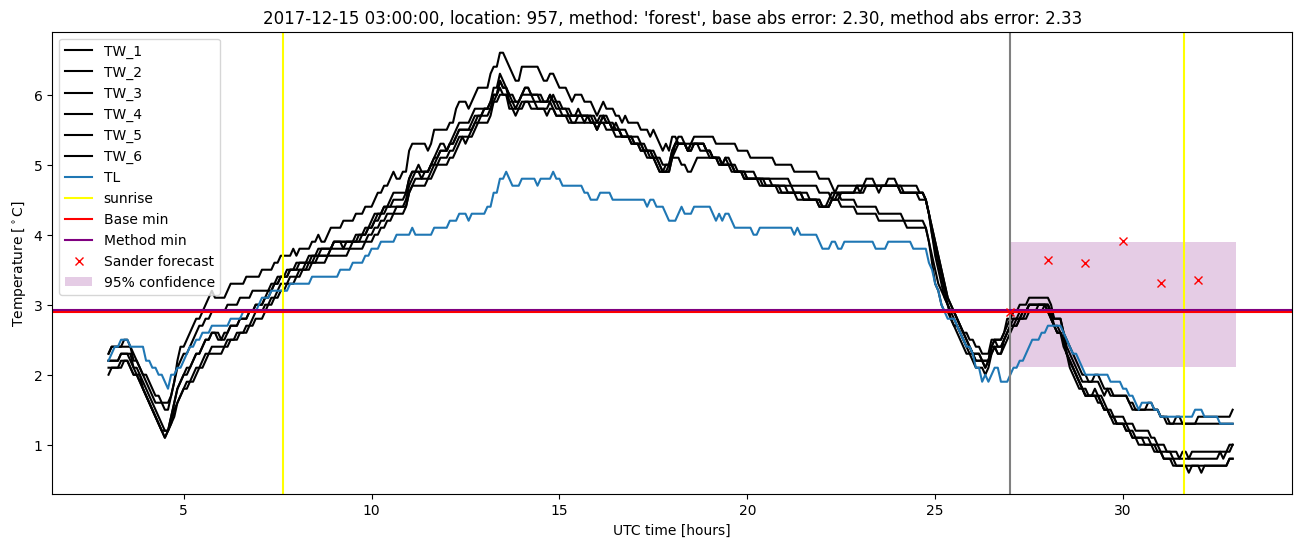
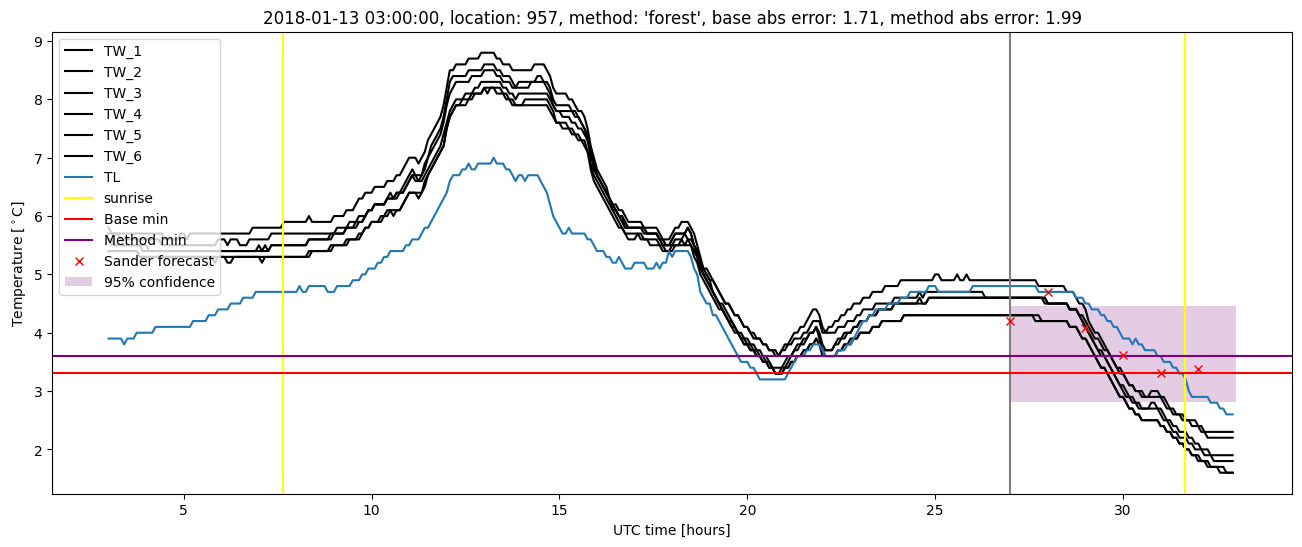
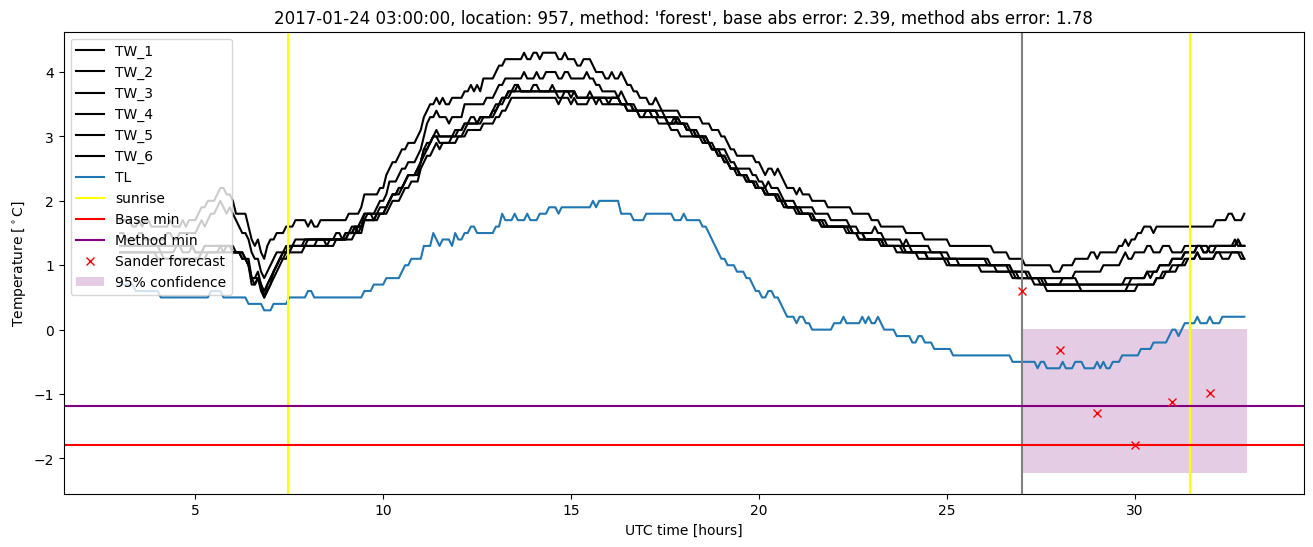
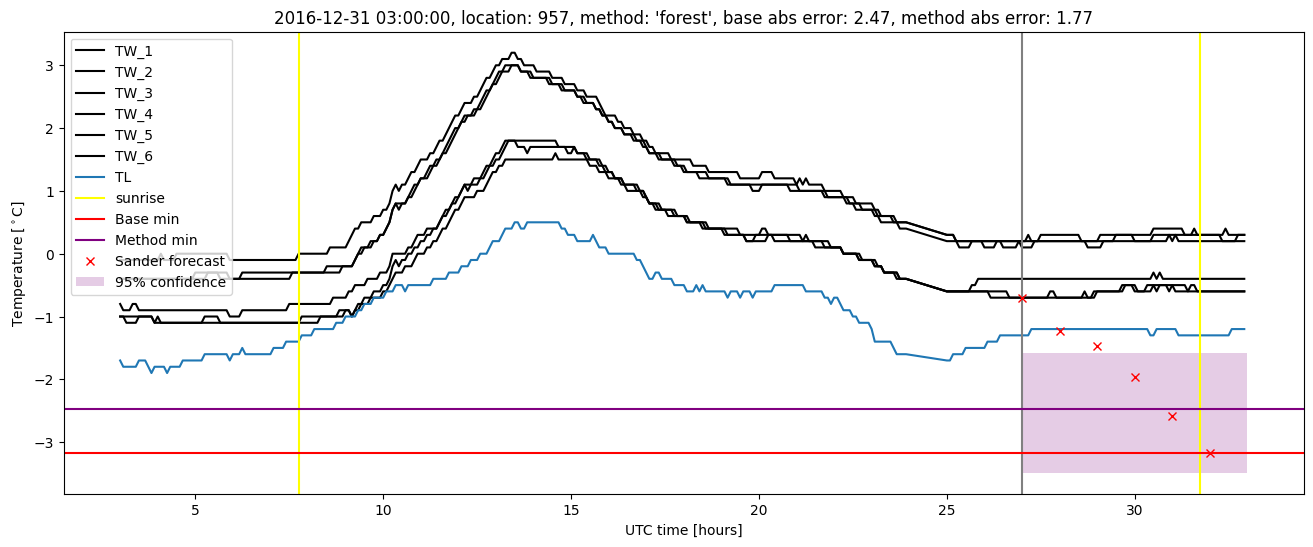
GMS location: 957
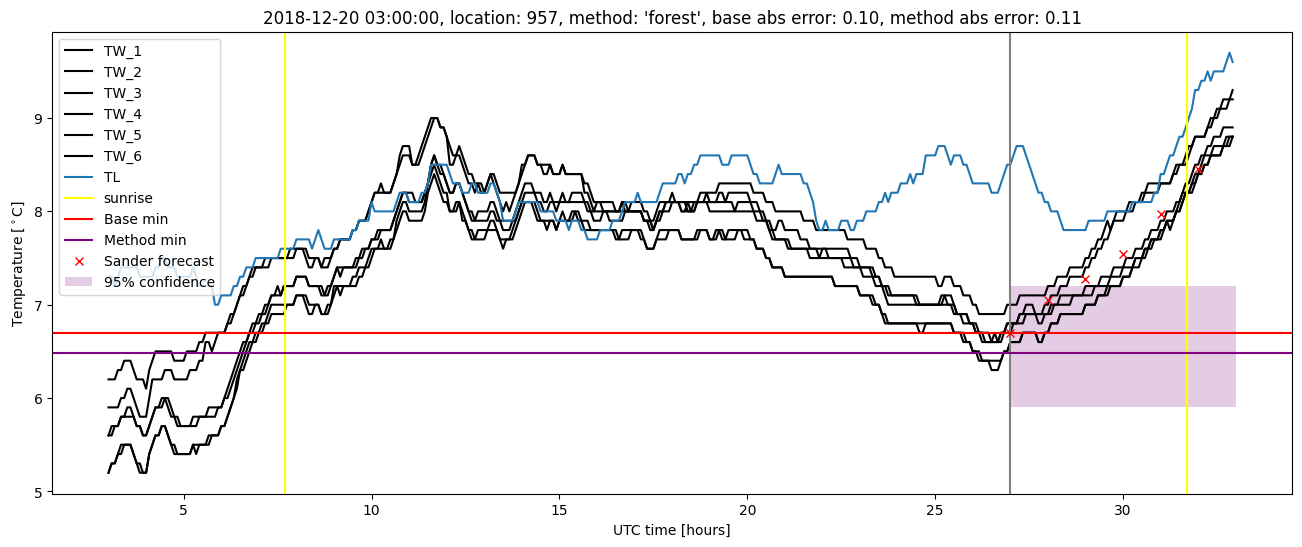
Random forest results
| names |
period |
power |
significance |
meanSquareError |
absError |
maxError |
CRPS |
IGN |
| baseline |
winter 2016 |
0.989 |
0.000e+00 |
0.287 |
0.417 |
1.790 |
NaN |
NaN |
| forest |
winter 2016 |
0.989 |
0.105 |
0.219 |
0.360 |
1.502 |
0.462 |
4.771 |
| baseline |
winter 2017 |
0.967 |
0.030 |
0.406 |
0.427 |
2.953 |
NaN |
NaN |
| forest |
winter 2017 |
0.975 |
0.030 |
0.285 |
0.364 |
2.954 |
0.471 |
5.563 |
| baseline |
winter 2018 |
0.987 |
0.069 |
0.332 |
0.417 |
2.299 |
NaN |
NaN |
| forest |
winter 2018 |
0.987 |
0.069 |
0.273 |
0.383 |
2.330 |
0.464 |
4.933 |
| baseline |
winter 2019 |
0.992 |
0.067 |
0.261 |
0.370 |
1.822 |
NaN |
NaN |
| forest |
winter 2019 |
0.992 |
0.067 |
0.193 |
0.325 |
1.538 |
0.462 |
4.227 |
| baseline |
all |
0.985 |
0.042 |
0.320 |
0.409 |
2.953 |
NaN |
NaN |
| forest |
all |
0.986 |
0.062 |
0.243 |
0.360 |
2.954 |
0.464 |
4.878 |
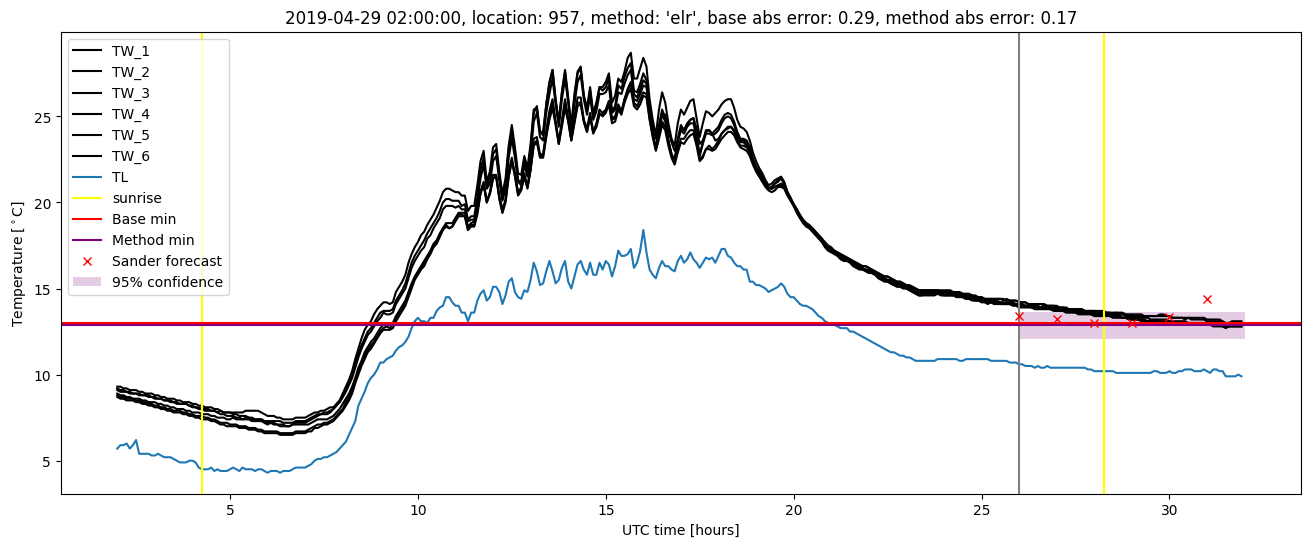
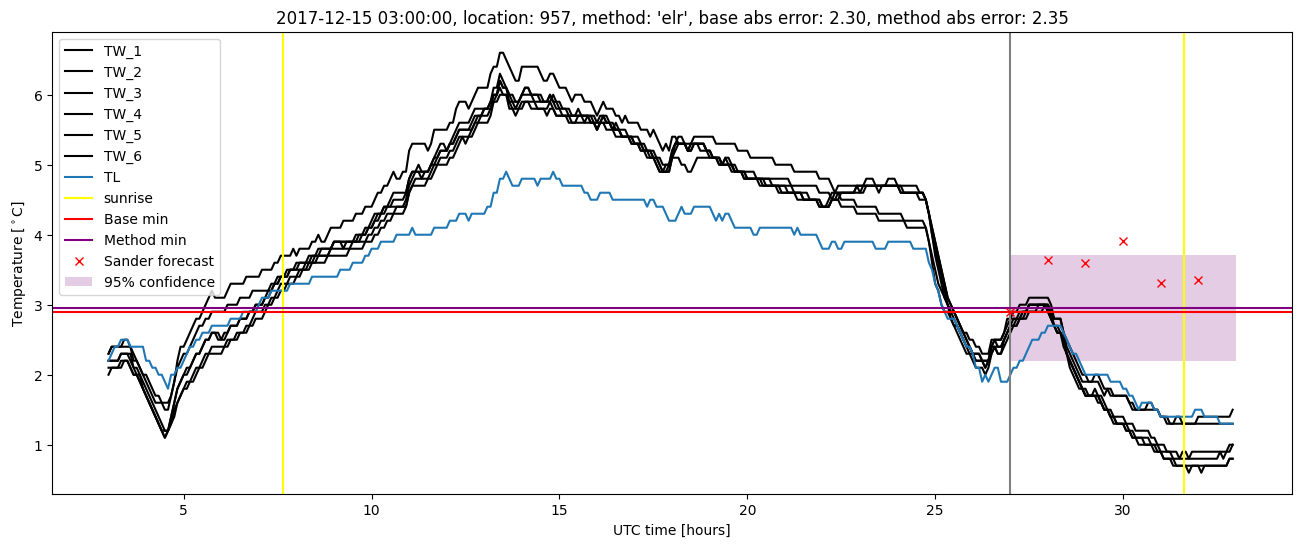
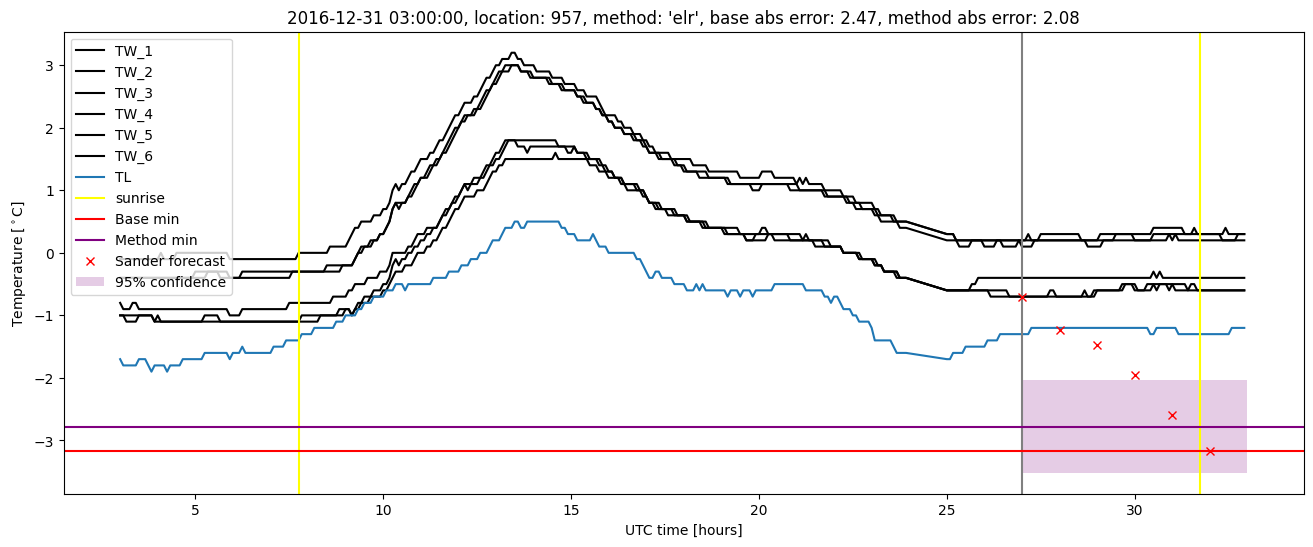
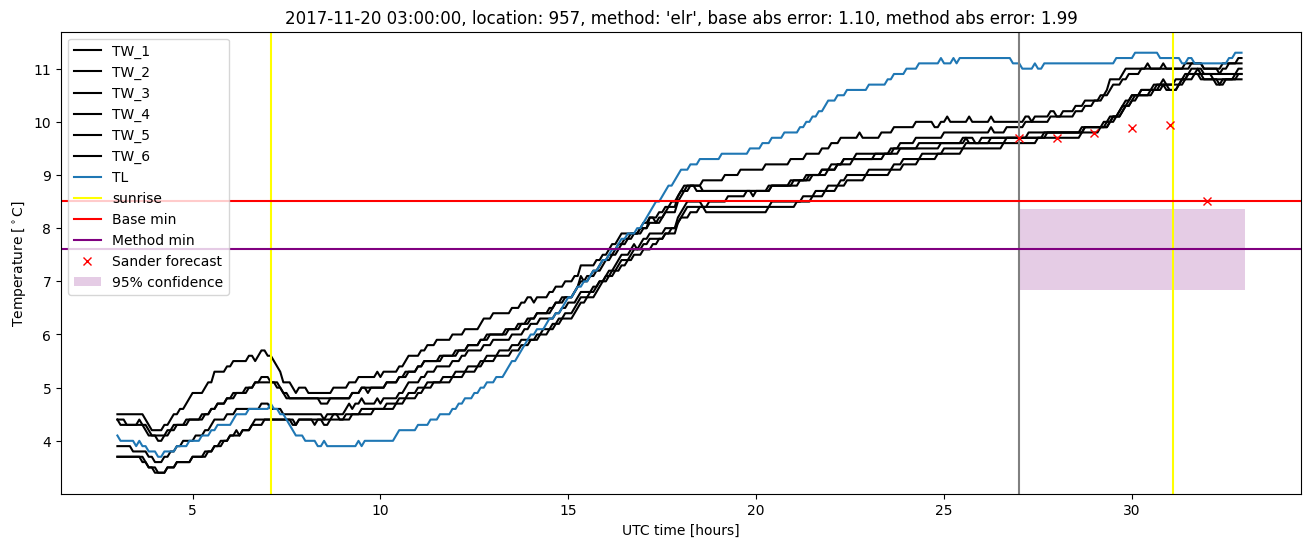
Random forest plots
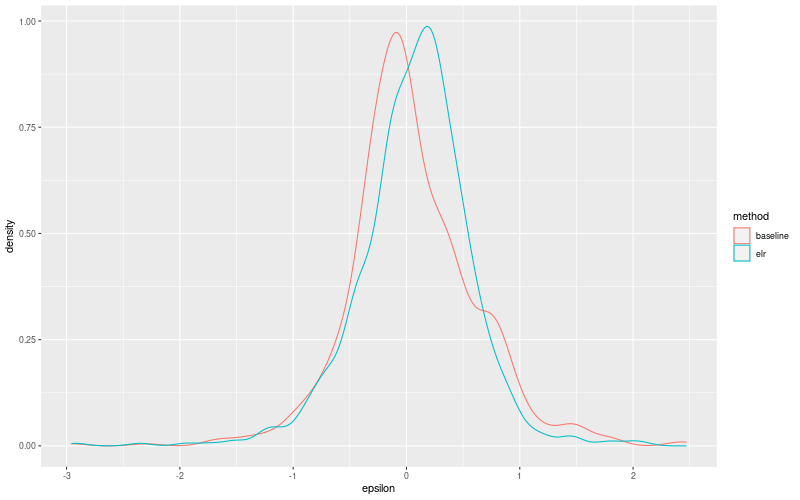
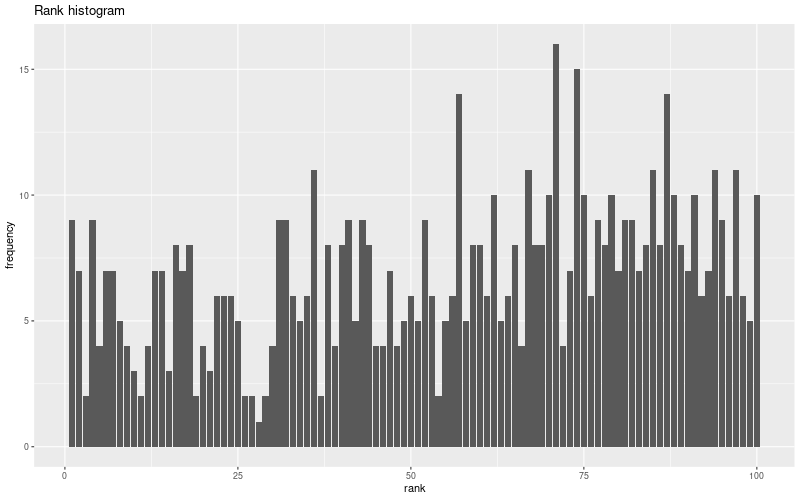
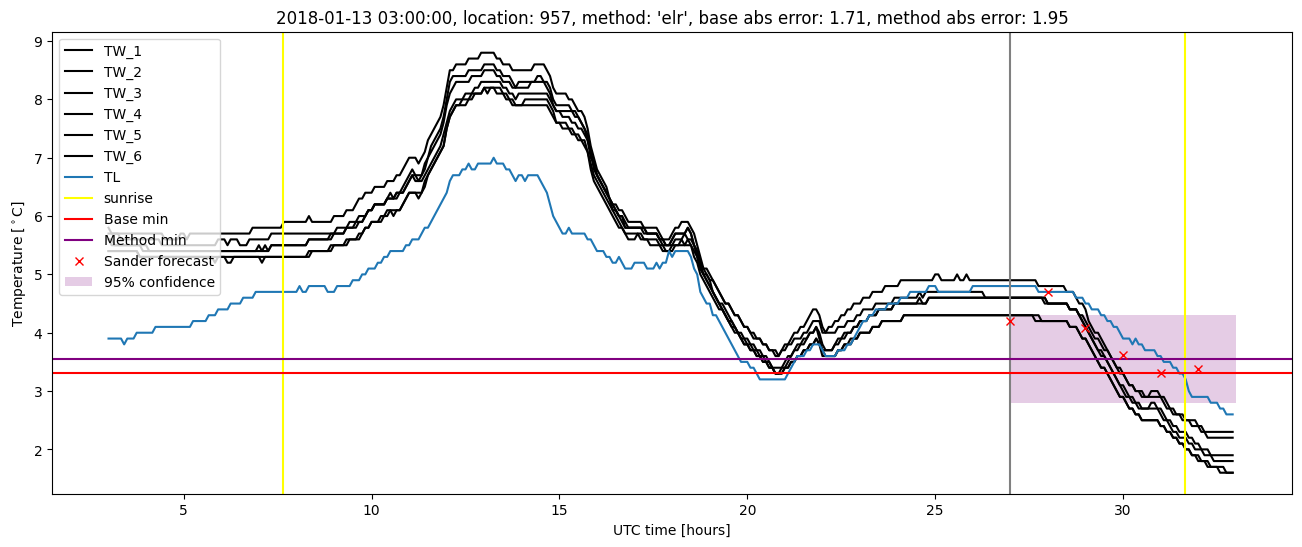
Extended logistic regression results
| names |
period |
power |
significance |
meanSquareError |
absError |
maxError |
CRPS |
IGN |
| baseline |
winter 2016 |
0.989 |
0.000e+00 |
0.287 |
0.417 |
1.790 |
NaN |
NaN |
| elr |
winter 2016 |
0.984 |
0.000e+00 |
0.221 |
0.357 |
1.735 |
0.578 |
7.817 |
| baseline |
winter 2017 |
0.967 |
0.030 |
0.406 |
0.427 |
2.953 |
NaN |
NaN |
| elr |
winter 2017 |
0.967 |
0.061 |
0.332 |
0.418 |
2.918 |
0.555 |
8.384 |
| baseline |
winter 2018 |
0.987 |
0.069 |
0.332 |
0.417 |
2.299 |
NaN |
NaN |
| elr |
winter 2018 |
0.987 |
0.035 |
0.275 |
0.376 |
2.354 |
0.559 |
7.664 |
| baseline |
winter 2019 |
0.992 |
0.067 |
0.261 |
0.370 |
1.822 |
NaN |
NaN |
| elr |
winter 2019 |
0.992 |
0.067 |
0.208 |
0.357 |
1.518 |
0.555 |
6.388 |
| baseline |
all |
0.985 |
0.042 |
0.320 |
0.409 |
2.953 |
NaN |
NaN |
| elr |
all |
0.983 |
0.042 |
0.257 |
0.376 |
2.918 |
0.563 |
7.606 |
Extended logistic regression plots