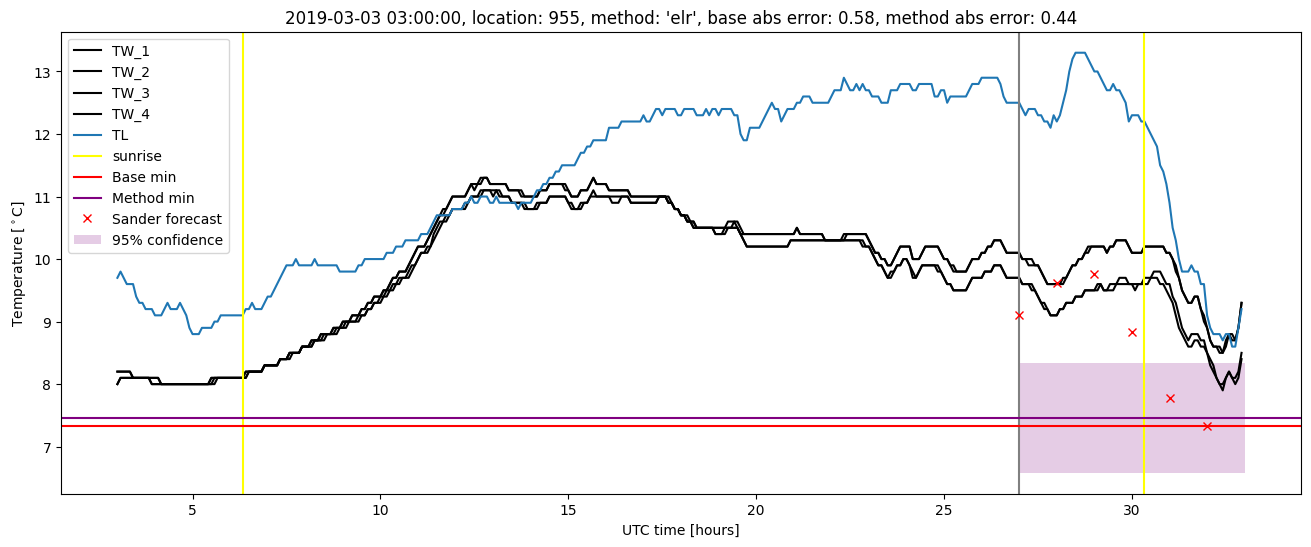
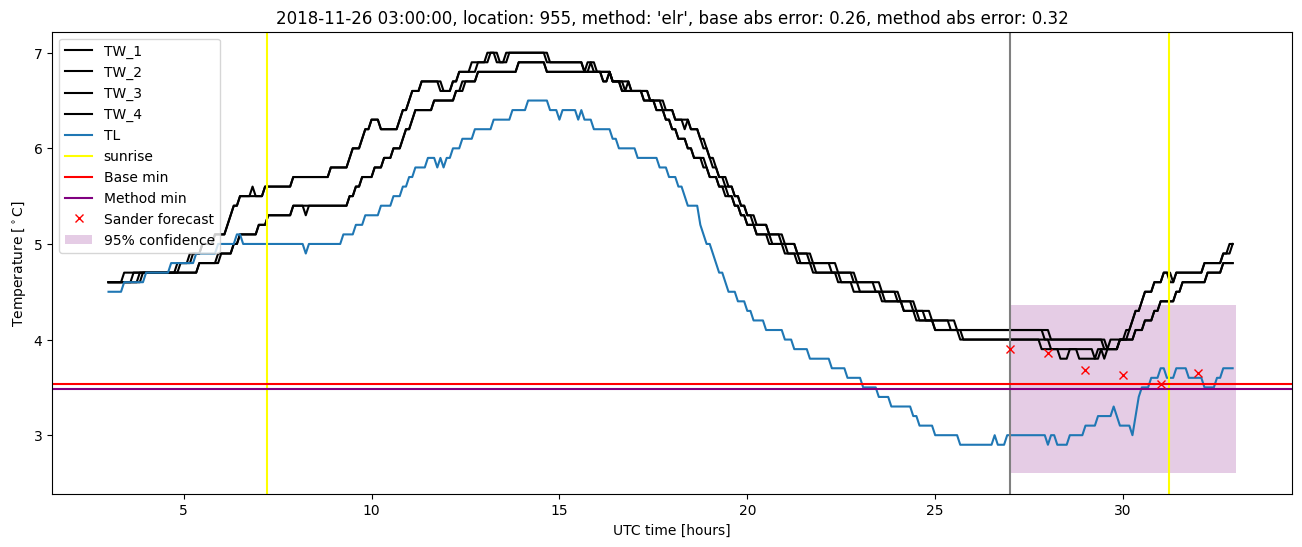
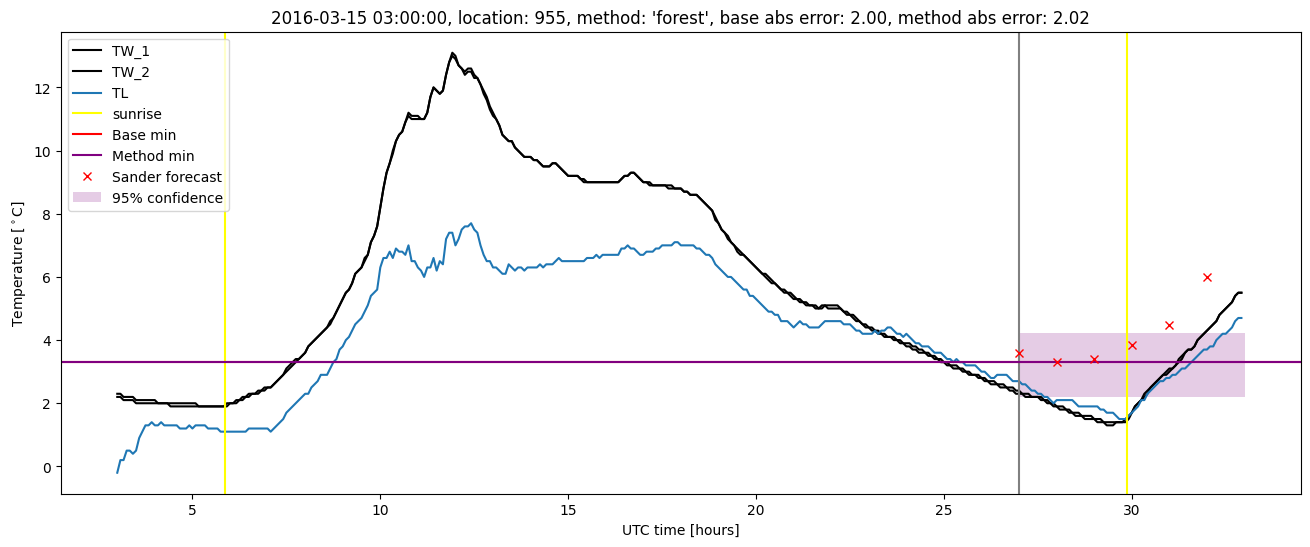
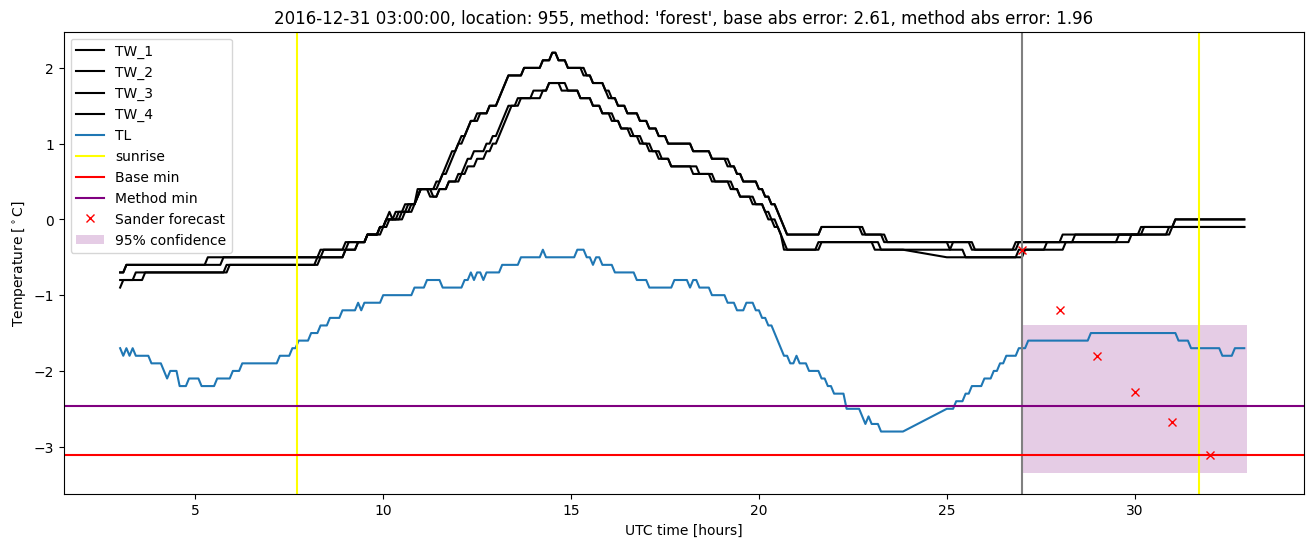
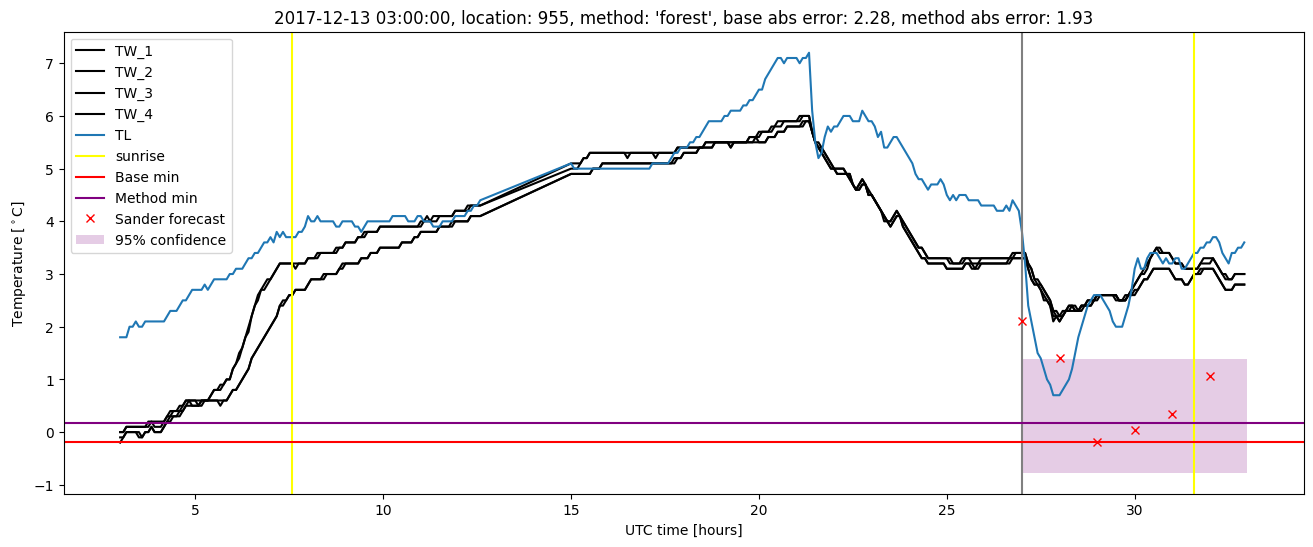
GMS location: 955
Random forest results
| names |
period |
power |
significance |
meanSquareError |
absError |
maxError |
CRPS |
IGN |
| baseline |
winter 2016 |
0.988 |
0.111 |
0.365 |
0.445 |
2.102 |
NaN |
NaN |
| forest |
winter 2016 |
0.994 |
0.167 |
0.296 |
0.396 |
2.116 |
0.449 |
4.073 |
| baseline |
winter 2017 |
0.966 |
0.077 |
0.441 |
0.471 |
2.610 |
NaN |
NaN |
| forest |
winter 2017 |
0.975 |
0.115 |
0.322 |
0.411 |
1.957 |
0.455 |
3.933 |
| baseline |
winter 2018 |
0.973 |
0.080 |
0.378 |
0.439 |
2.282 |
NaN |
NaN |
| forest |
winter 2018 |
0.980 |
0.080 |
0.287 |
0.383 |
2.107 |
0.448 |
3.297 |
| baseline |
winter 2019 |
1.000 |
0.083 |
0.321 |
0.429 |
1.711 |
NaN |
NaN |
| forest |
winter 2019 |
1.000 |
0.083 |
0.259 |
0.397 |
1.282 |
0.453 |
3.039 |
| baseline |
all |
0.982 |
0.086 |
0.376 |
0.446 |
2.610 |
NaN |
NaN |
| forest |
all |
0.988 |
0.111 |
0.291 |
0.396 |
2.116 |
0.451 |
3.606 |
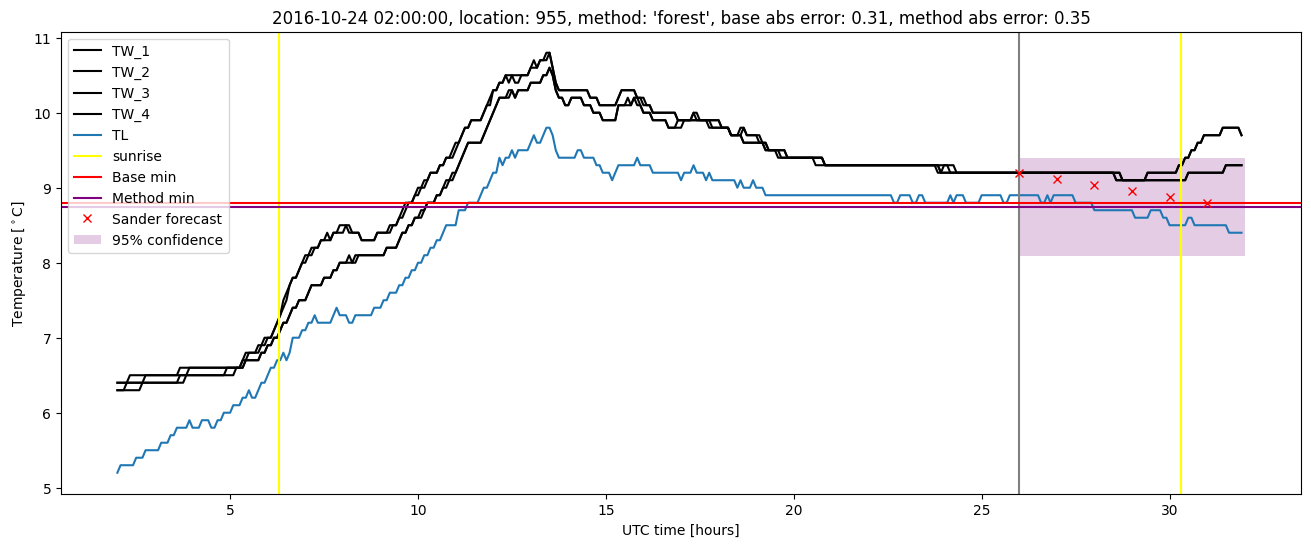
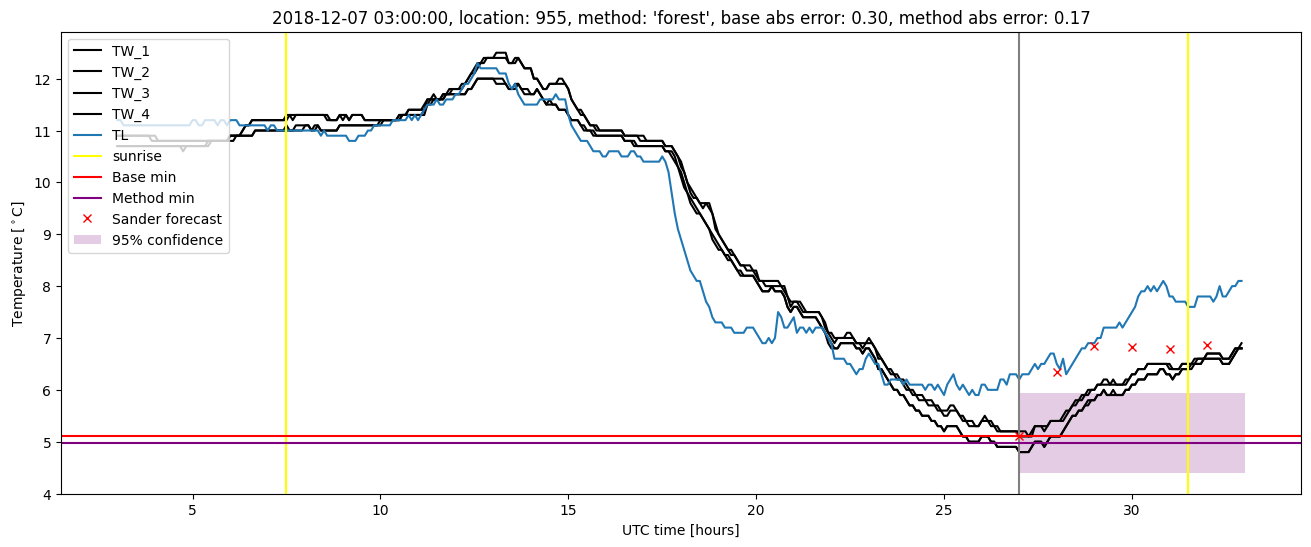
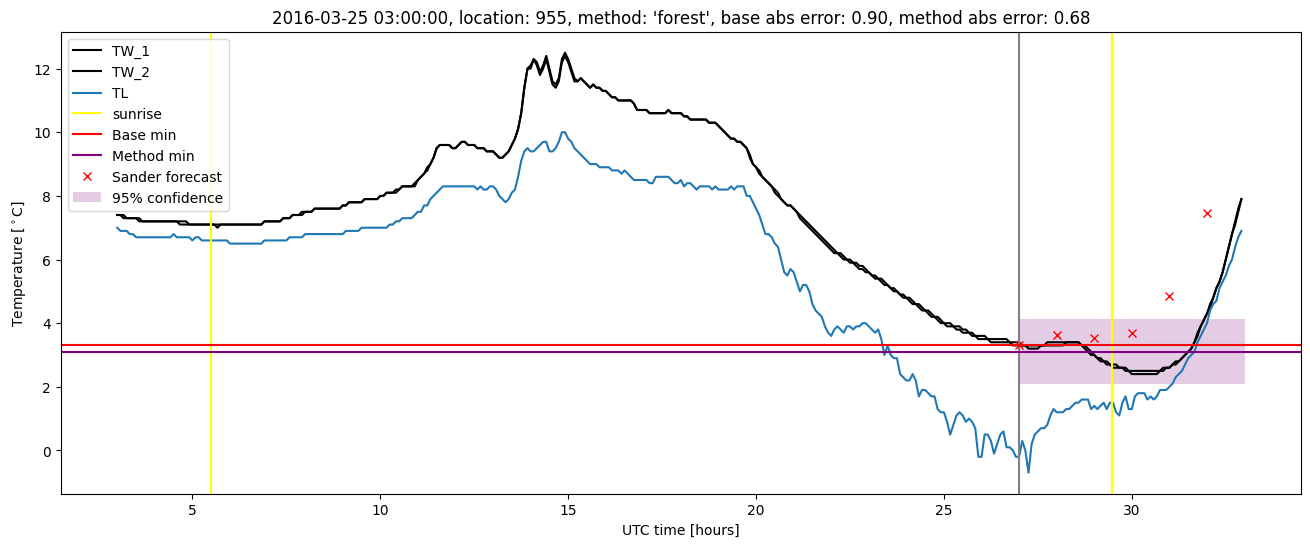
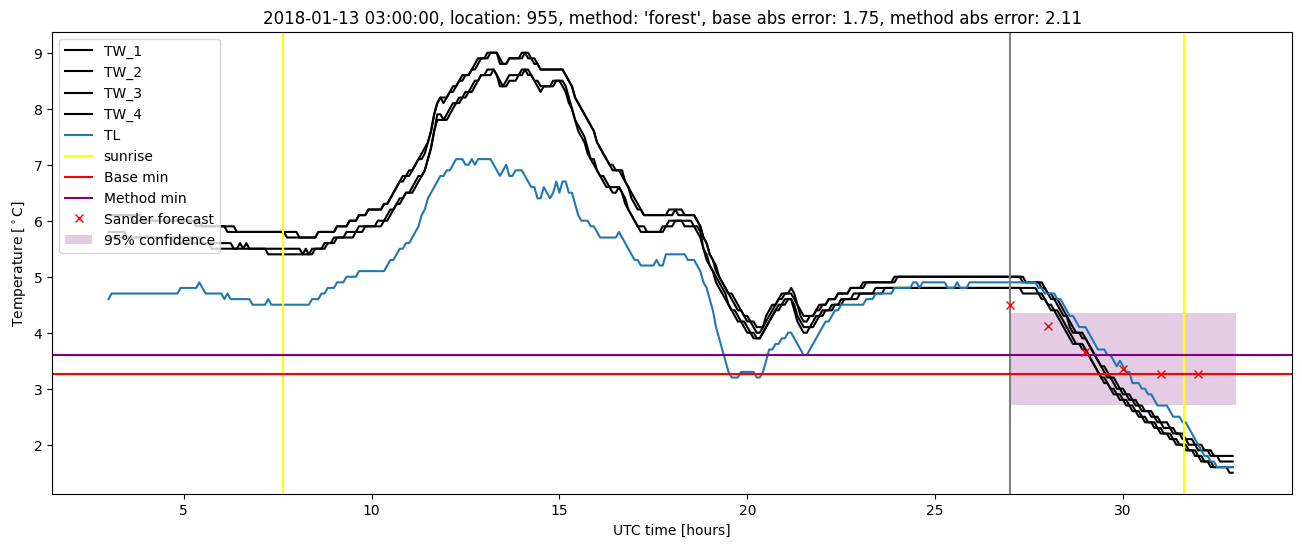
Random forest plots

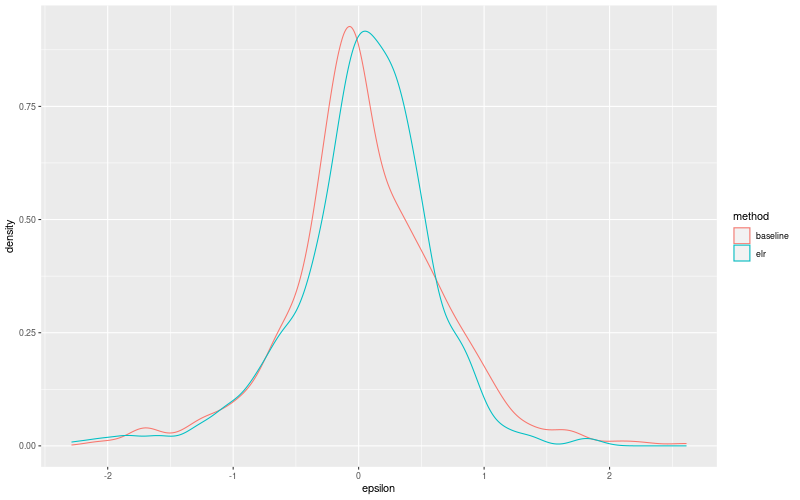
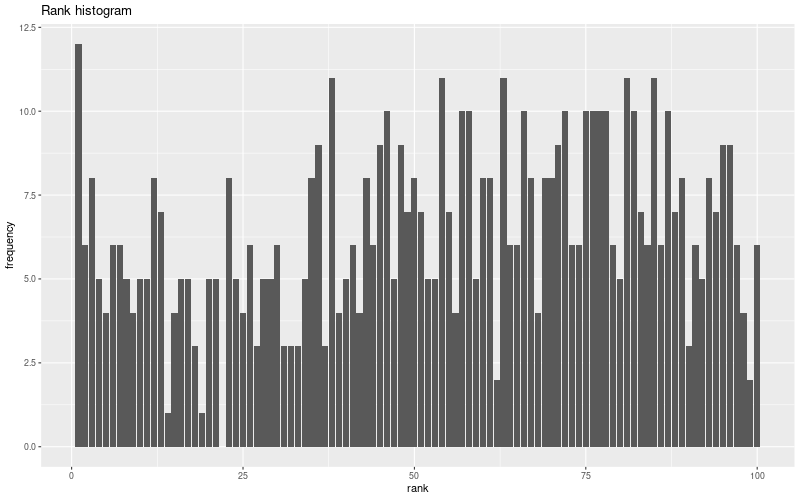
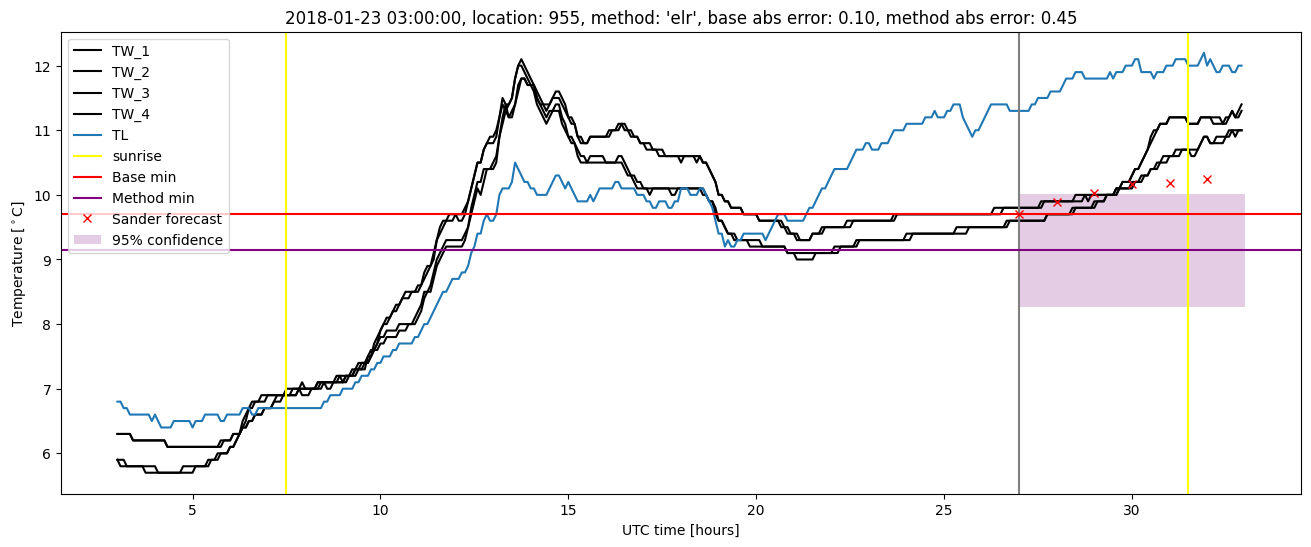
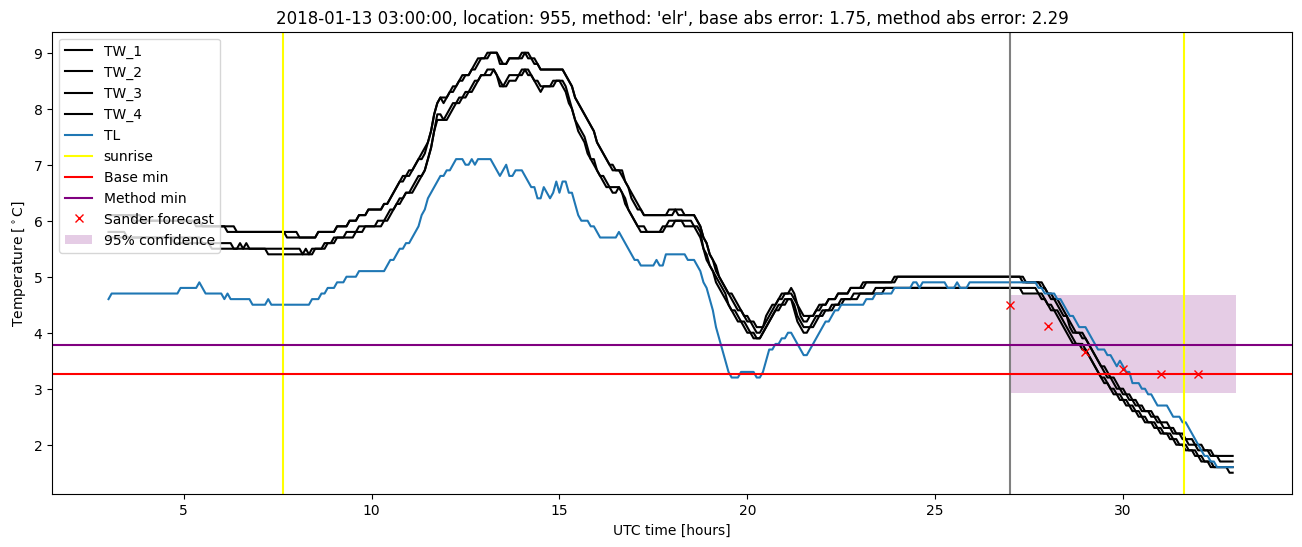
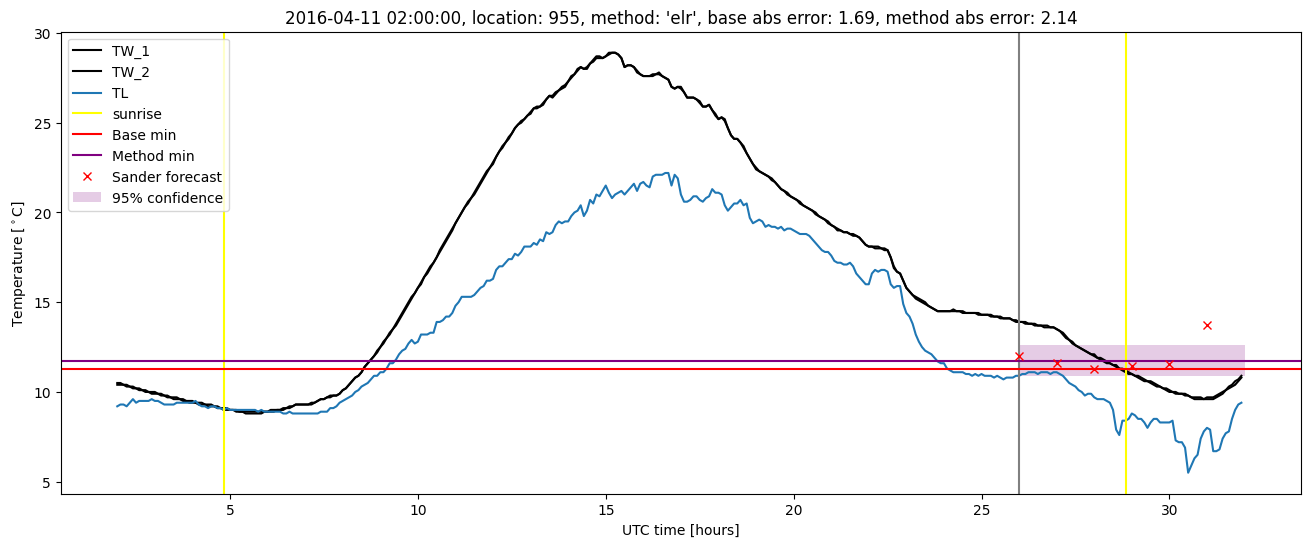
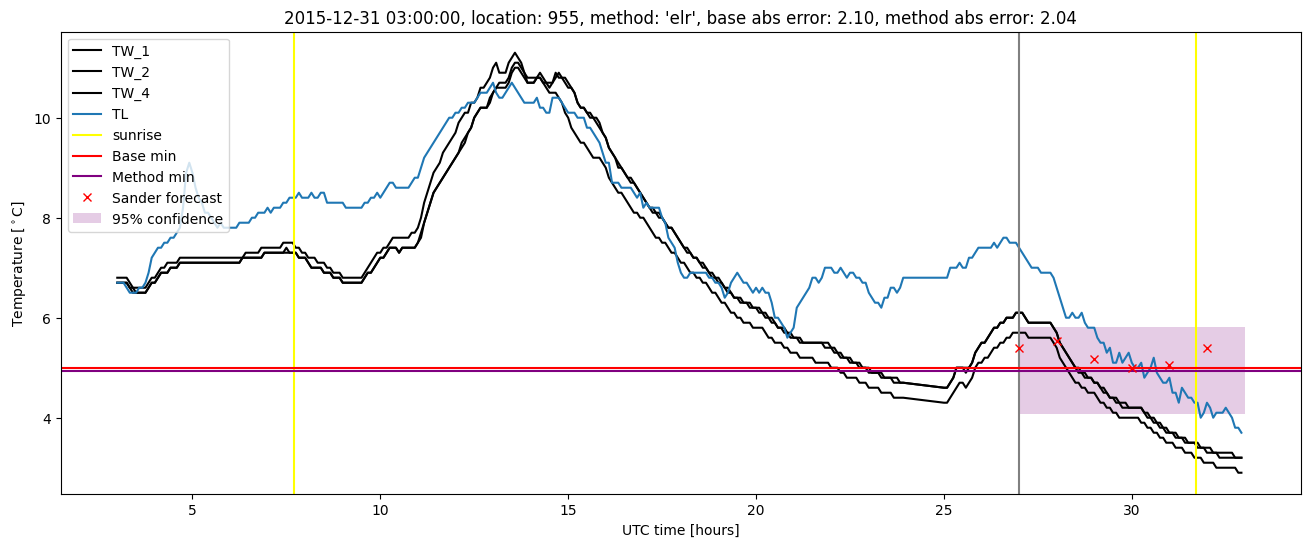
Extended logistic regression results
| names |
period |
power |
significance |
meanSquareError |
absError |
maxError |
CRPS |
IGN |
| baseline |
winter 2016 |
0.988 |
0.111 |
0.365 |
0.445 |
2.102 |
NaN |
NaN |
| elr |
winter 2016 |
0.988 |
0.167 |
0.313 |
0.419 |
2.135 |
0.536 |
4.374 |
| baseline |
winter 2017 |
0.966 |
0.077 |
0.441 |
0.471 |
2.610 |
NaN |
NaN |
| elr |
winter 2017 |
0.983 |
0.038 |
0.318 |
0.400 |
1.886 |
0.527 |
4.620 |
| baseline |
winter 2018 |
0.973 |
0.080 |
0.378 |
0.439 |
2.282 |
NaN |
NaN |
| elr |
winter 2018 |
0.980 |
0.080 |
0.286 |
0.392 |
2.286 |
0.529 |
4.132 |
| baseline |
winter 2019 |
1.000 |
0.083 |
0.321 |
0.429 |
1.711 |
NaN |
NaN |
| elr |
winter 2019 |
0.992 |
0.000e+00 |
0.257 |
0.391 |
1.483 |
0.519 |
4.037 |
| baseline |
all |
0.982 |
0.086 |
0.376 |
0.446 |
2.610 |
NaN |
NaN |
| elr |
all |
0.986 |
0.074 |
0.295 |
0.401 |
2.286 |
0.528 |
4.291 |
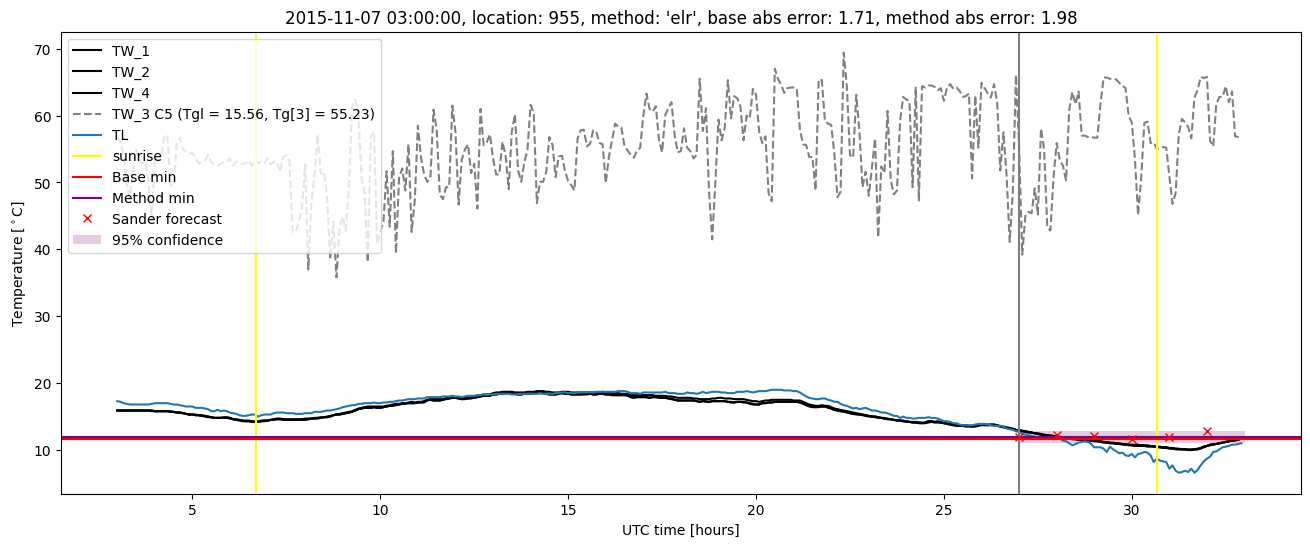
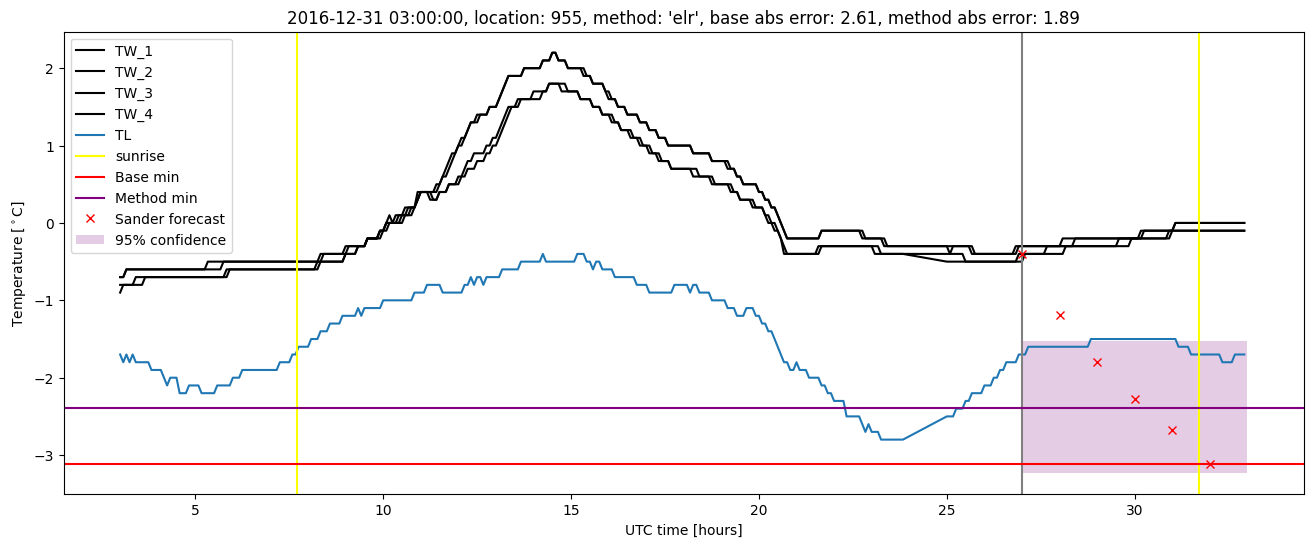
Extended logistic regression plots