GMS location: 954
Random forest results
| names |
period |
power |
significance |
meanSquareError |
absError |
maxError |
CRPS |
IGN |
| baseline |
winter 2016 |
1.000 |
0.048 |
0.332 |
0.423 |
2.006 |
NaN |
NaN |
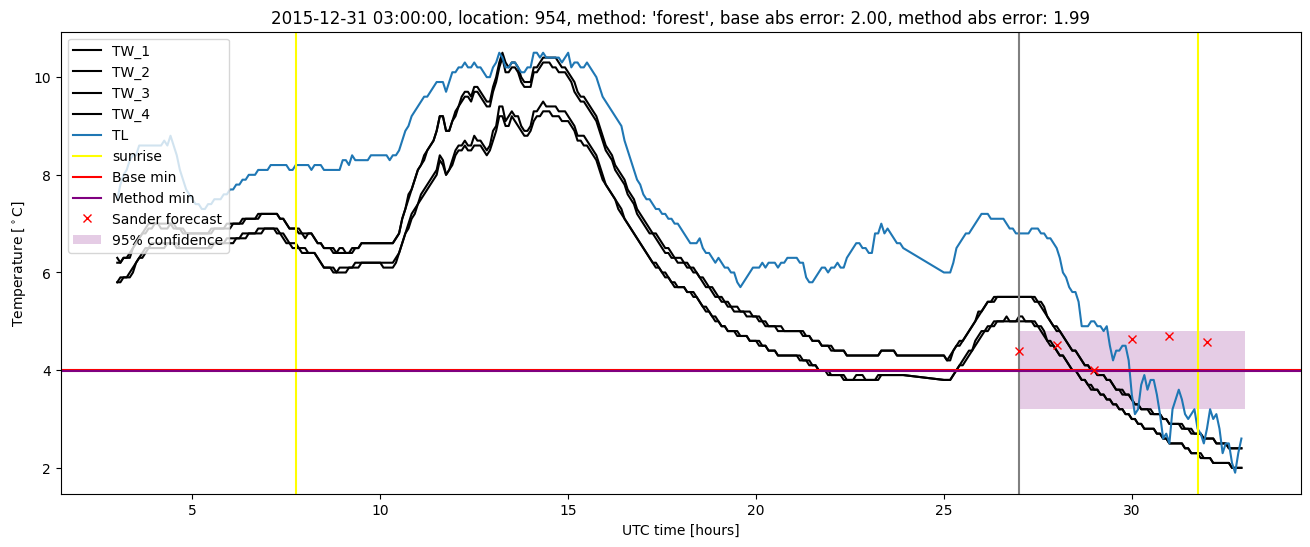
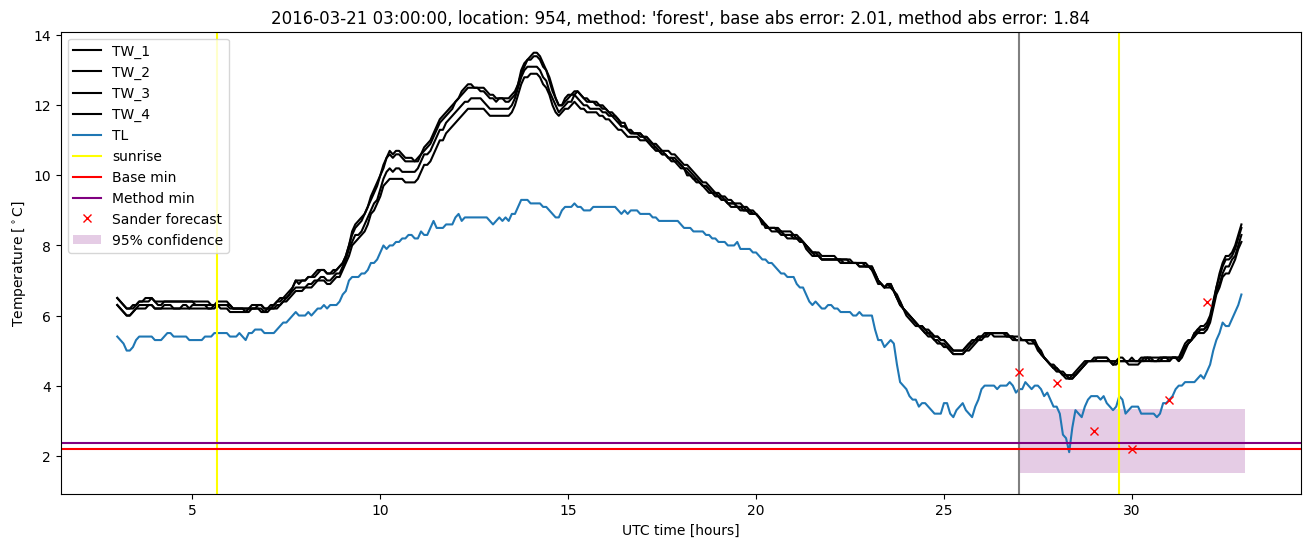
| forest |
winter 2016 |
1.000 |
0.048 |
0.268 |
0.370 |
1.985 |
0.500 |
5.744 |
| baseline |
winter 2017 |
0.991 |
0.088 |
0.399 |
0.416 |
2.597 |
NaN |
NaN |
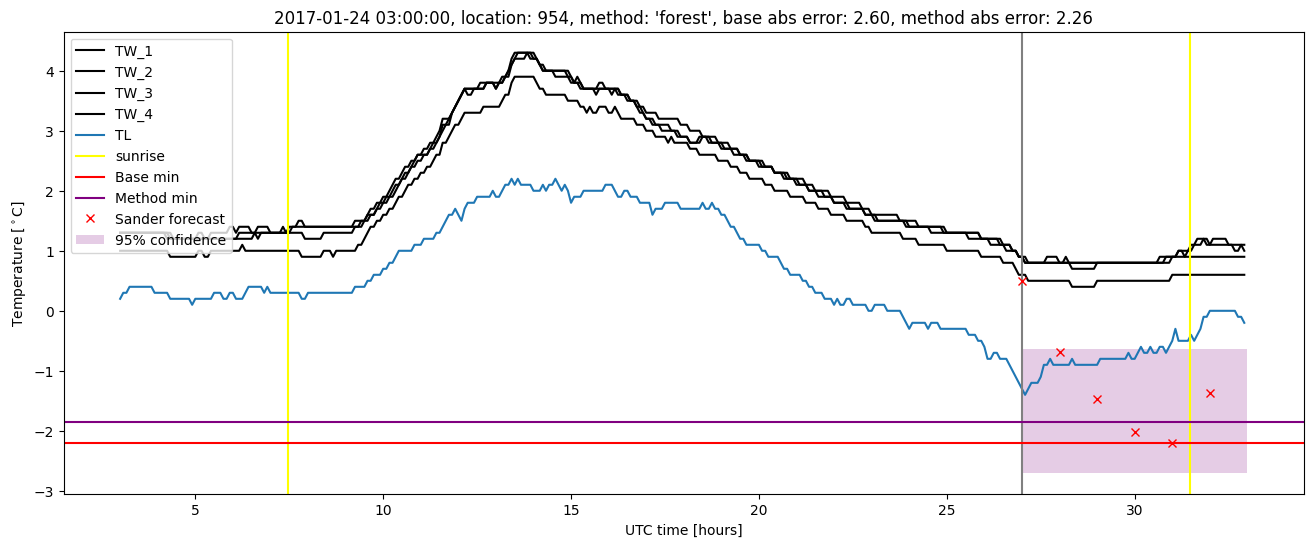
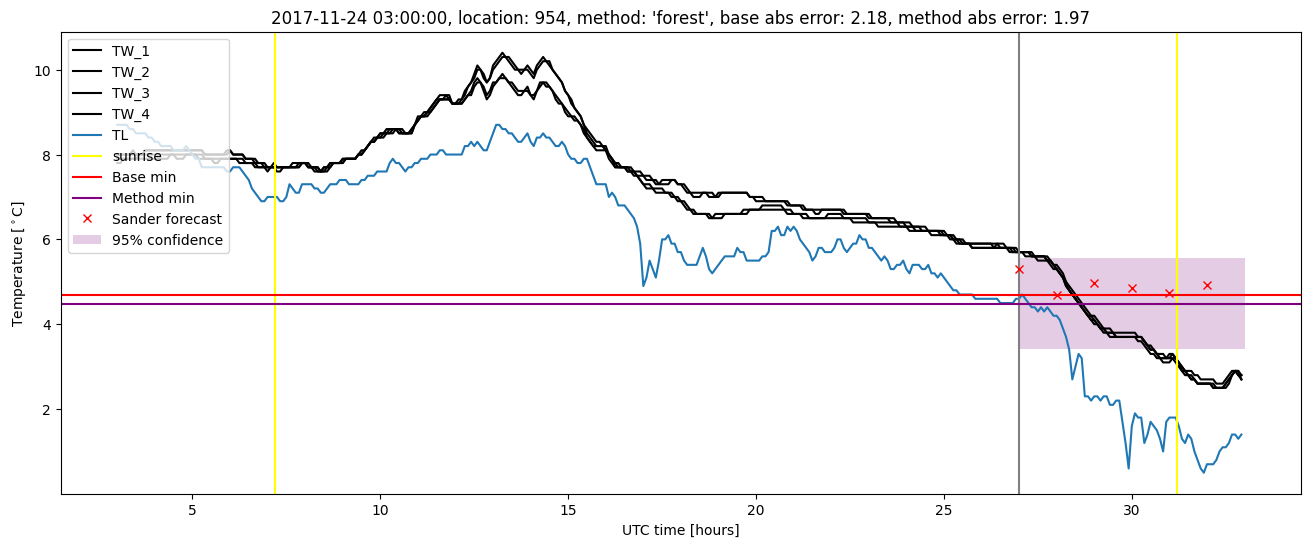
| forest |
winter 2017 |
0.974 |
0.059 |
0.306 |
0.375 |
2.259 |
0.505 |
4.992 |
| baseline |
winter 2018 |
0.987 |
0.077 |
0.308 |
0.414 |
2.179 |
NaN |
NaN |
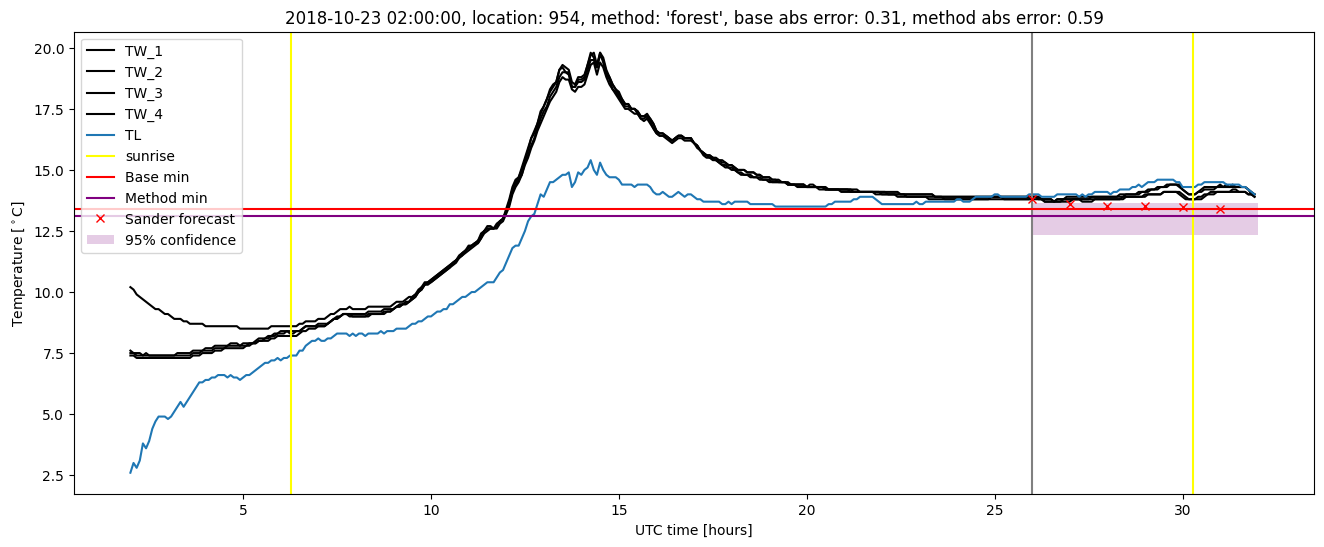
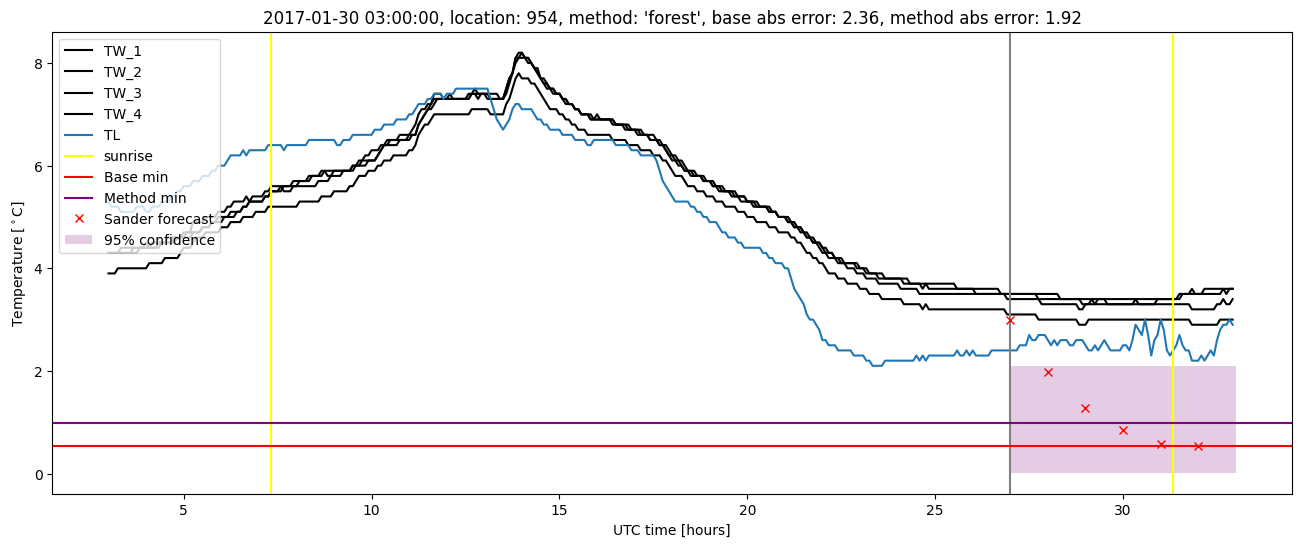
| forest |
winter 2018 |
0.993 |
0.115 |
0.256 |
0.377 |
1.967 |
0.495 |
3.332 |
| baseline |
winter 2019 |
0.987 |
0.083 |
0.294 |
0.361 |
2.418 |
NaN |
NaN |
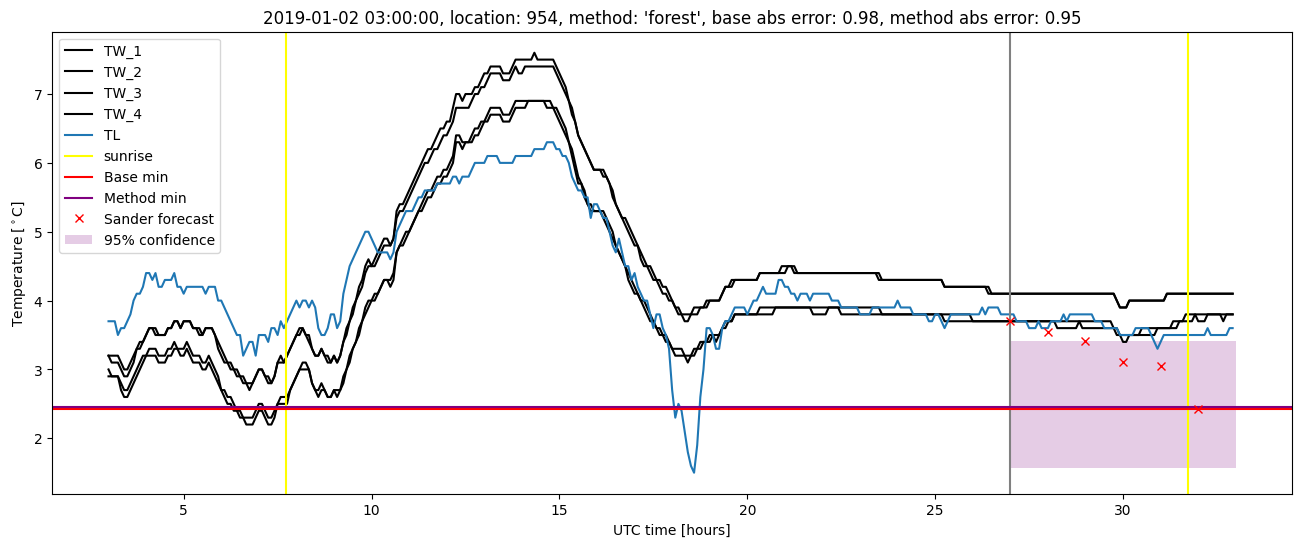
| forest |
winter 2019 |
0.987 |
0.083 |
0.230 |
0.335 |
1.587 |
0.501 |
3.949 |
| baseline |
all |
0.992 |
0.075 |
0.331 |
0.405 |
2.597 |
NaN |
NaN |
| forest |
all |
0.990 |
0.075 |
0.264 |
0.365 |
2.259 |
0.500 |
4.543 |
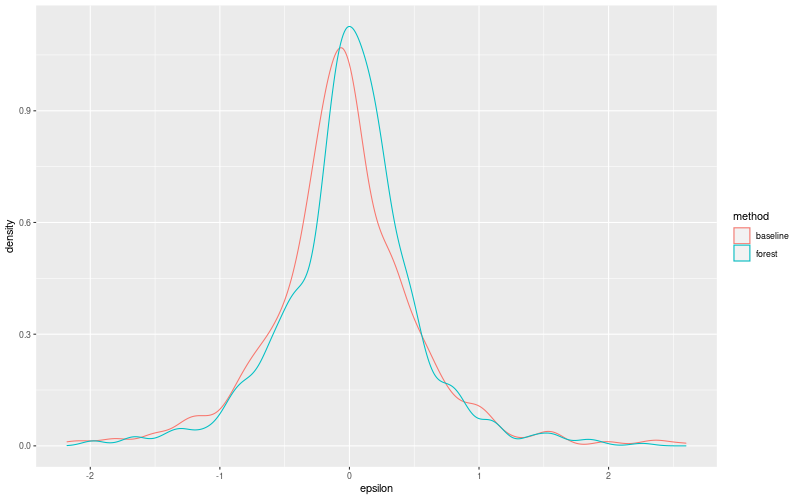
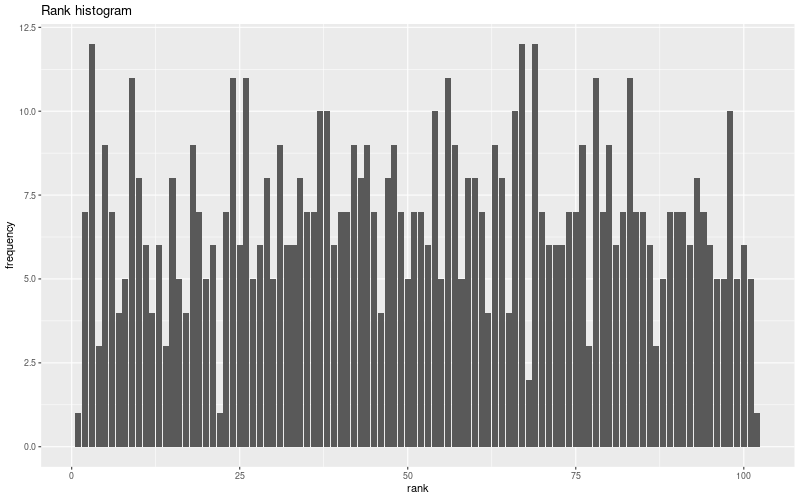
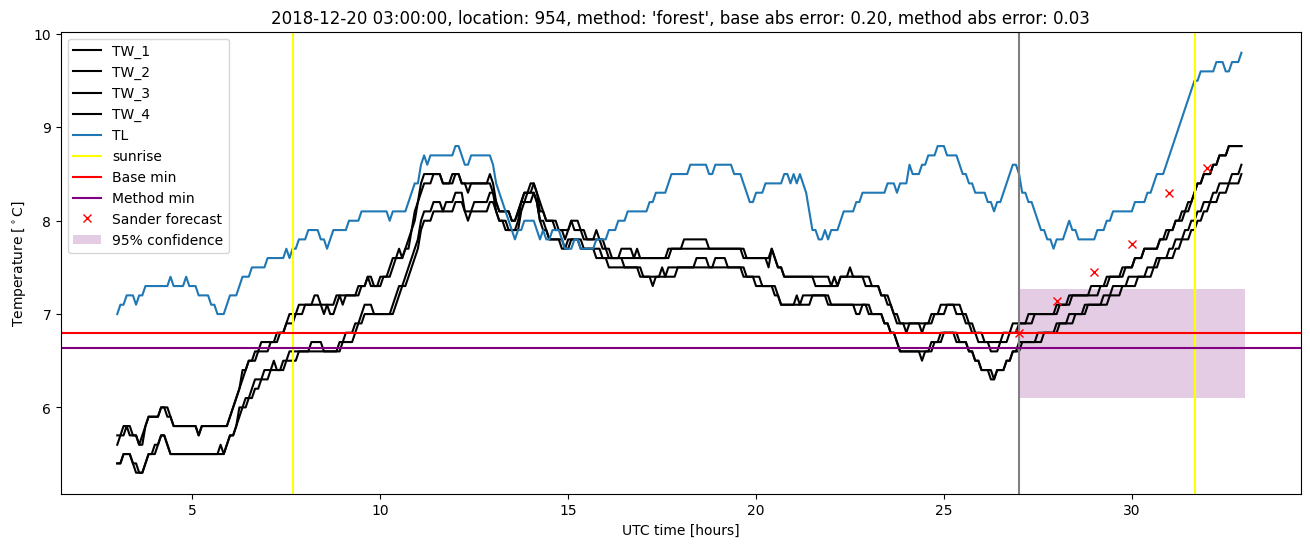
Random forest plots
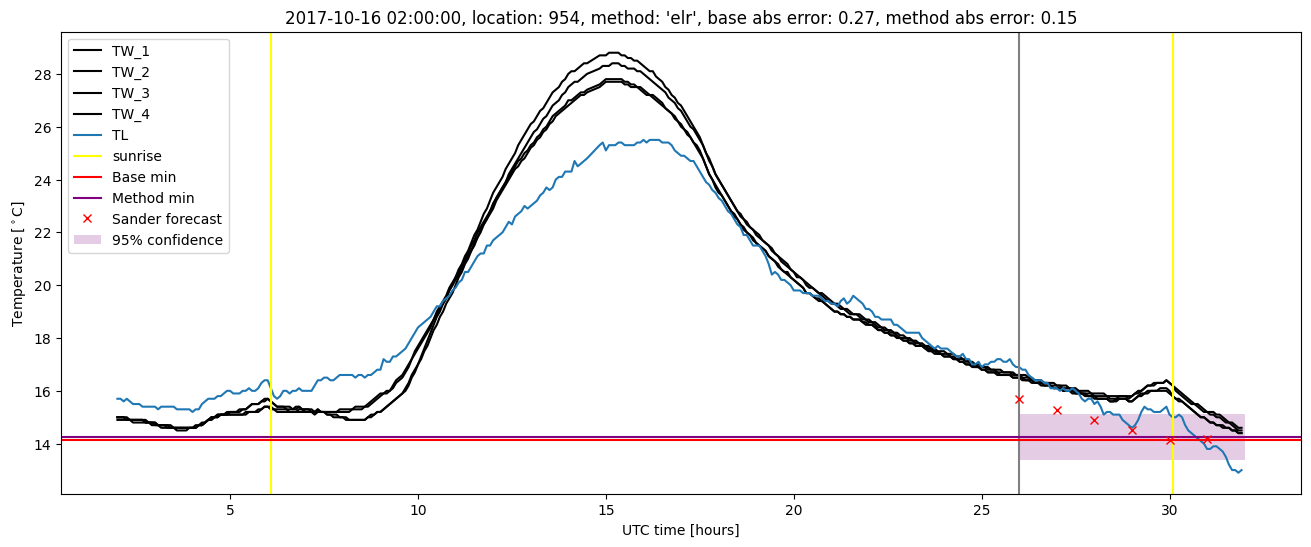
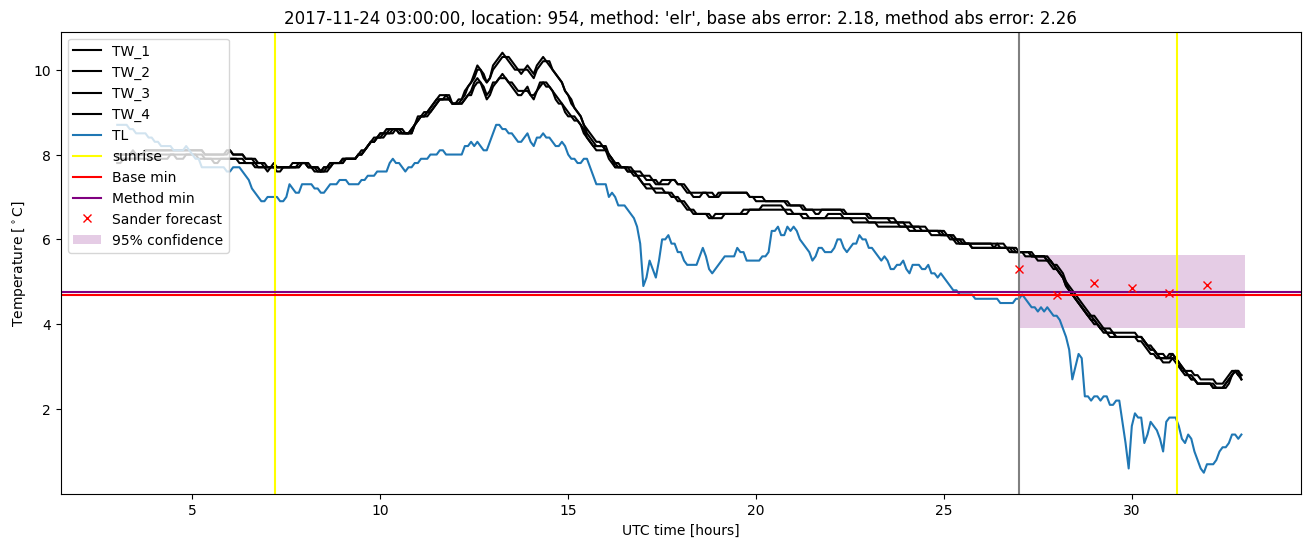
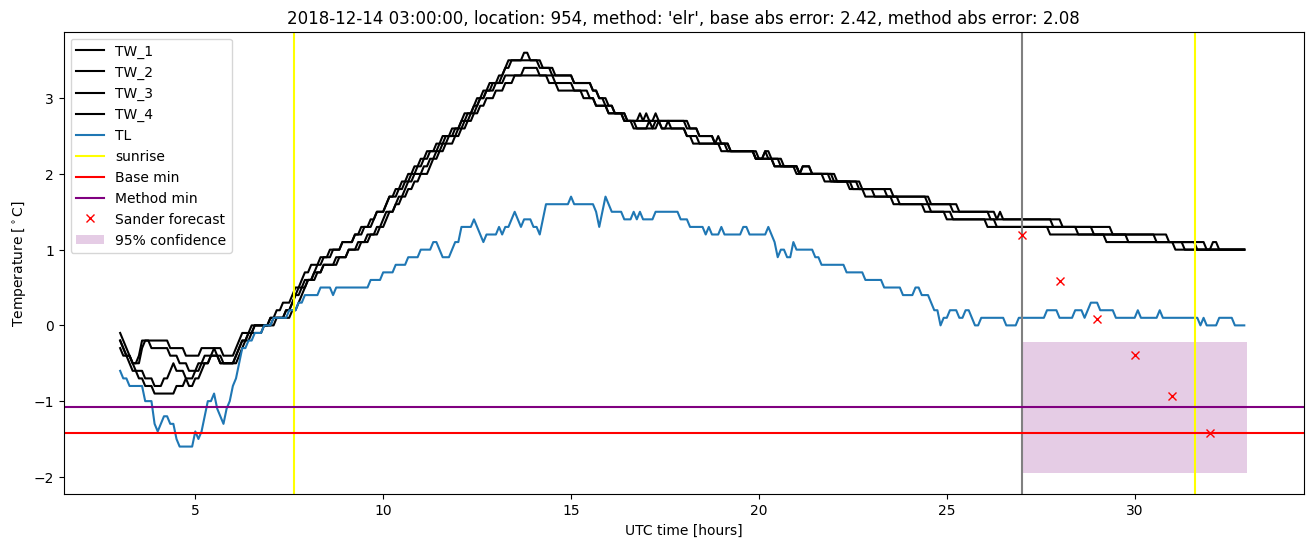
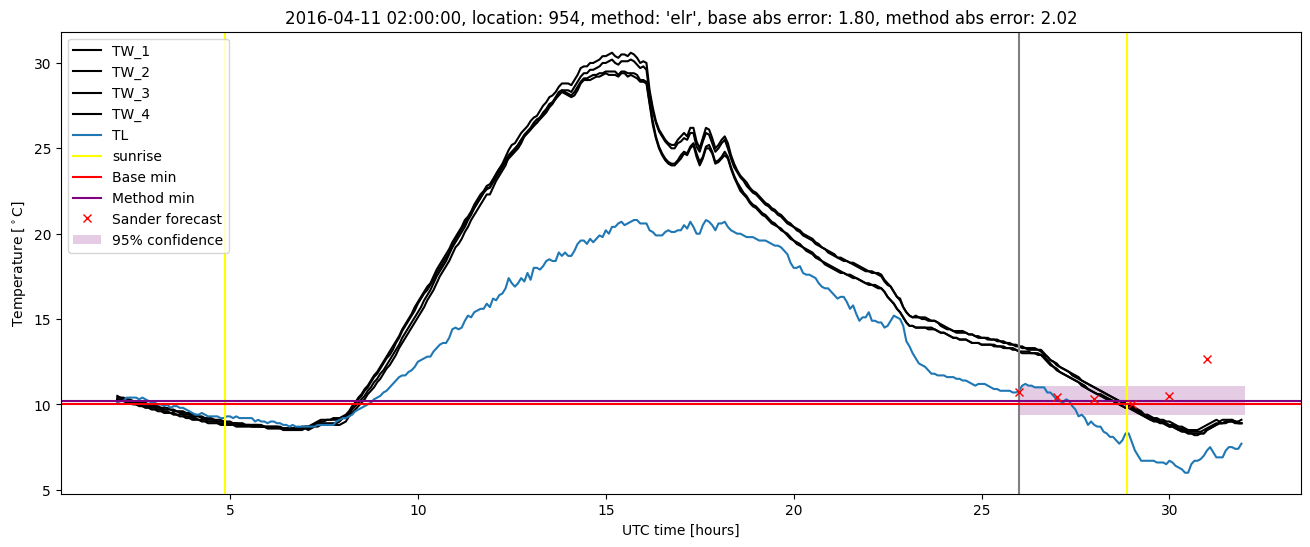
Extended logistic regression results
| names |
period |
power |
significance |
meanSquareError |
absError |
maxError |
CRPS |
IGN |
| baseline |
winter 2016 |
1.000 |
0.048 |
0.332 |
0.423 |
2.006 |
NaN |
NaN |
| elr |
winter 2016 |
0.989 |
0.048 |
0.288 |
0.399 |
2.018 |
0.573 |
5.668 |
| baseline |
winter 2017 |
0.991 |
0.088 |
0.399 |
0.416 |
2.597 |
NaN |
NaN |
| elr |
winter 2017 |
0.983 |
0.118 |
0.337 |
0.411 |
1.922 |
0.533 |
4.977 |
| baseline |
winter 2018 |
0.987 |
0.077 |
0.308 |
0.414 |
2.179 |
NaN |
NaN |
| elr |
winter 2018 |
0.980 |
0.115 |
0.273 |
0.390 |
2.262 |
0.562 |
5.041 |
| baseline |
winter 2019 |
0.987 |
0.083 |
0.294 |
0.361 |
2.418 |
NaN |
NaN |
| elr |
winter 2019 |
0.975 |
0.083 |
0.246 |
0.358 |
2.083 |
0.605 |
5.549 |
| baseline |
all |
0.992 |
0.075 |
0.331 |
0.405 |
2.597 |
NaN |
NaN |
| elr |
all |
0.982 |
0.097 |
0.284 |
0.389 |
2.262 |
0.569 |
5.333 |
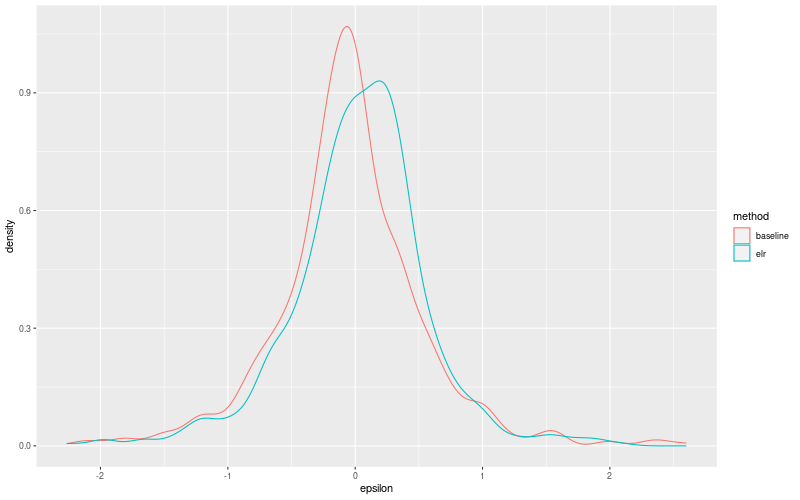
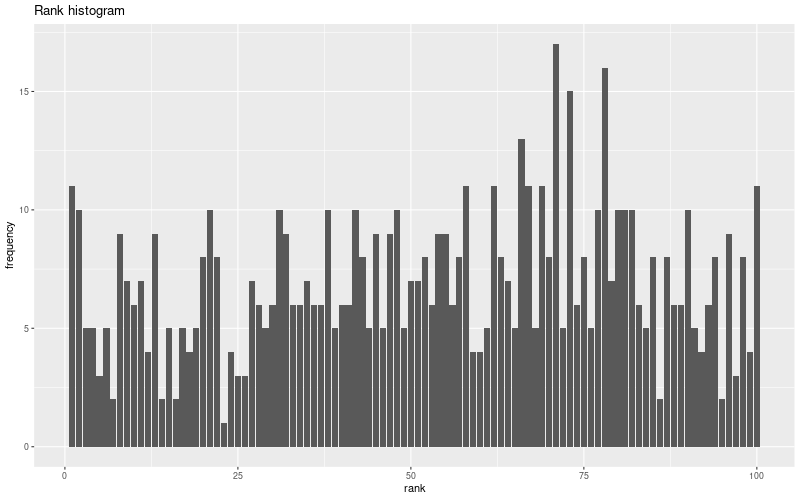
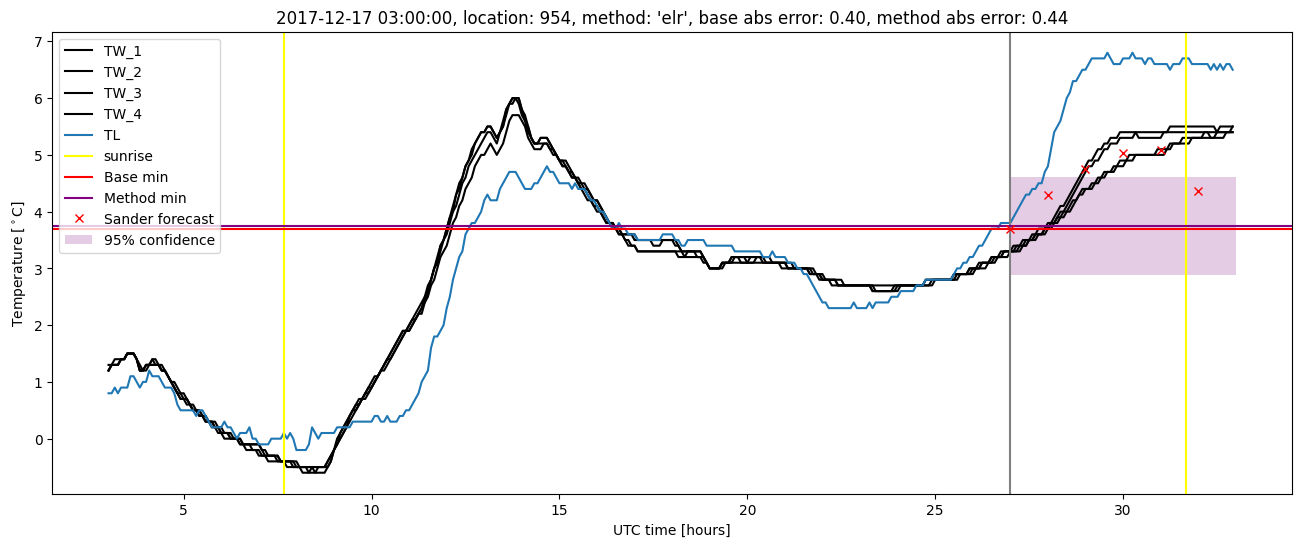
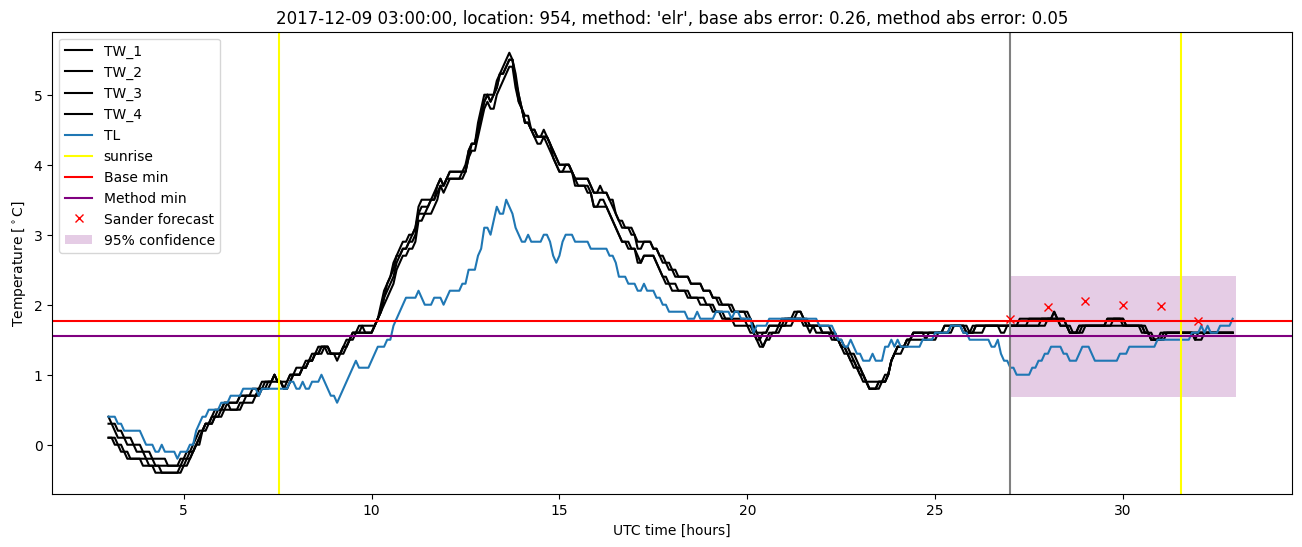
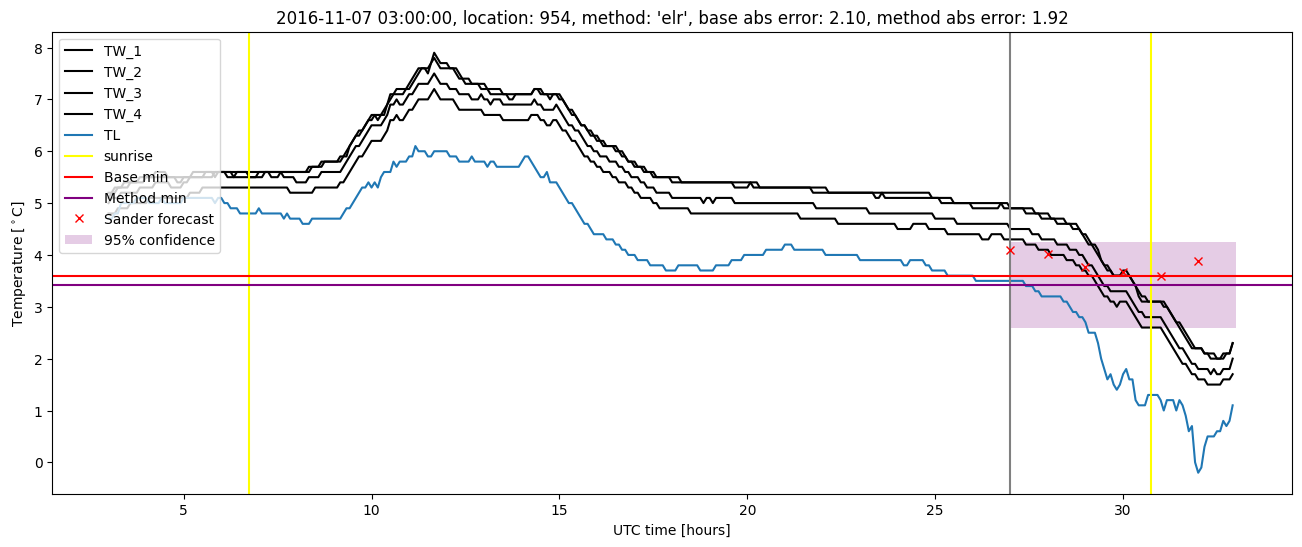
Extended logistic regression plots