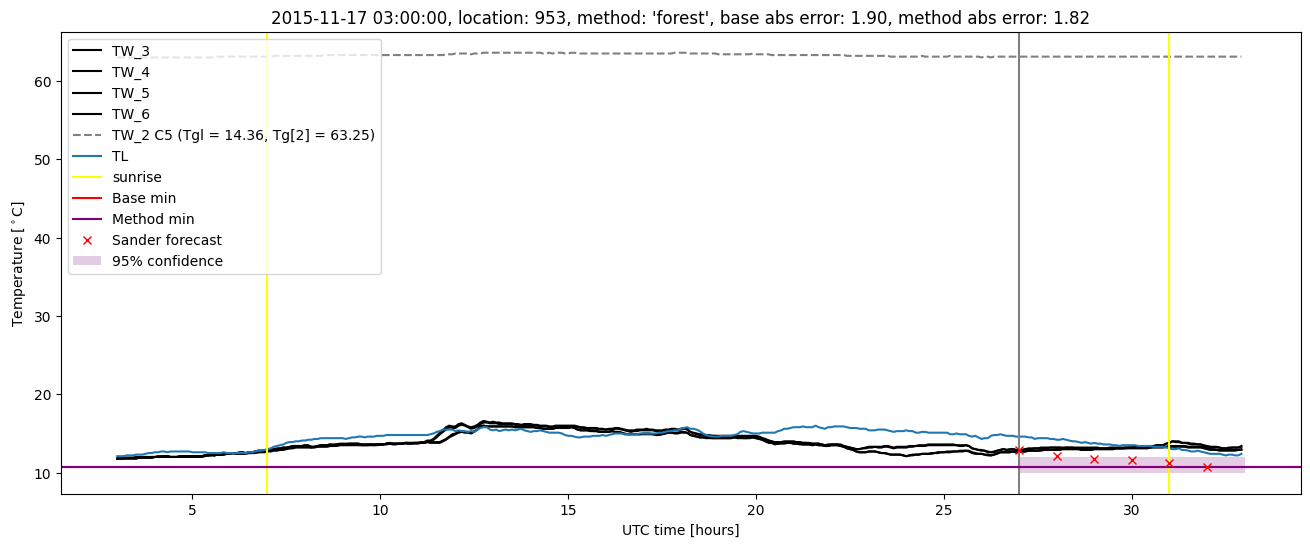
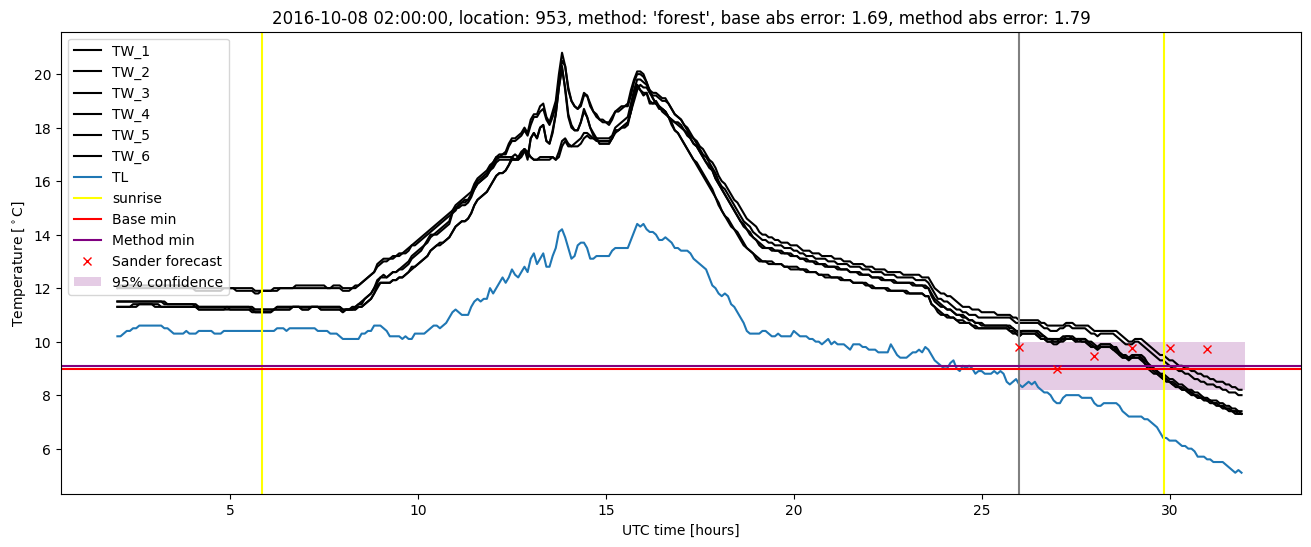
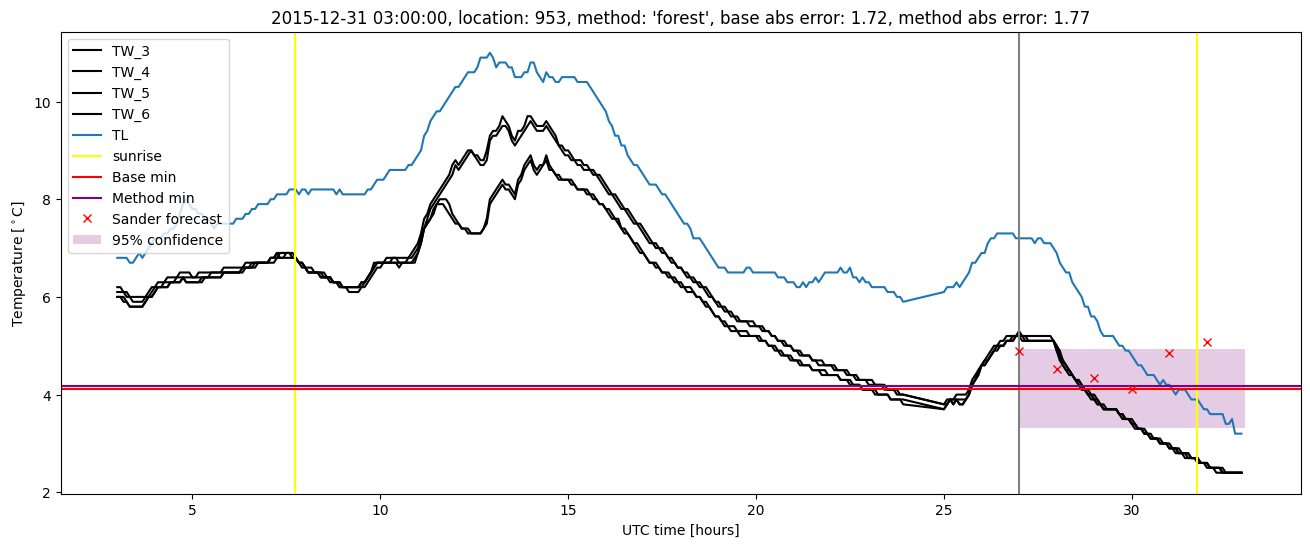
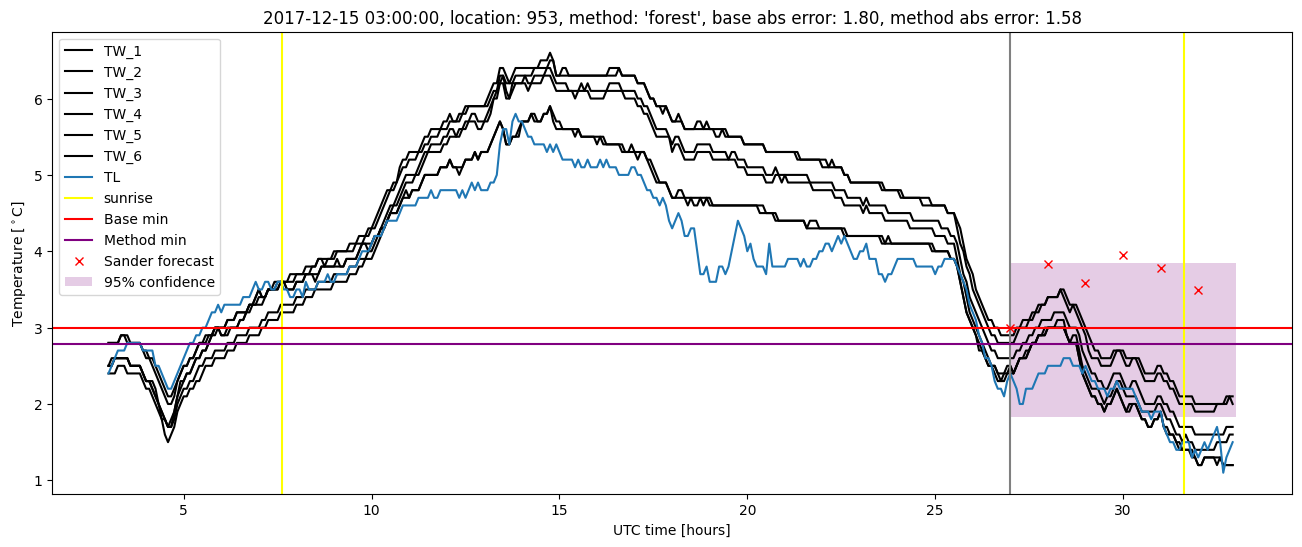
GMS location: 953
Random forest results
| names |
period |
power |
significance |
meanSquareError |
absError |
maxError |
CRPS |
IGN |
| baseline |
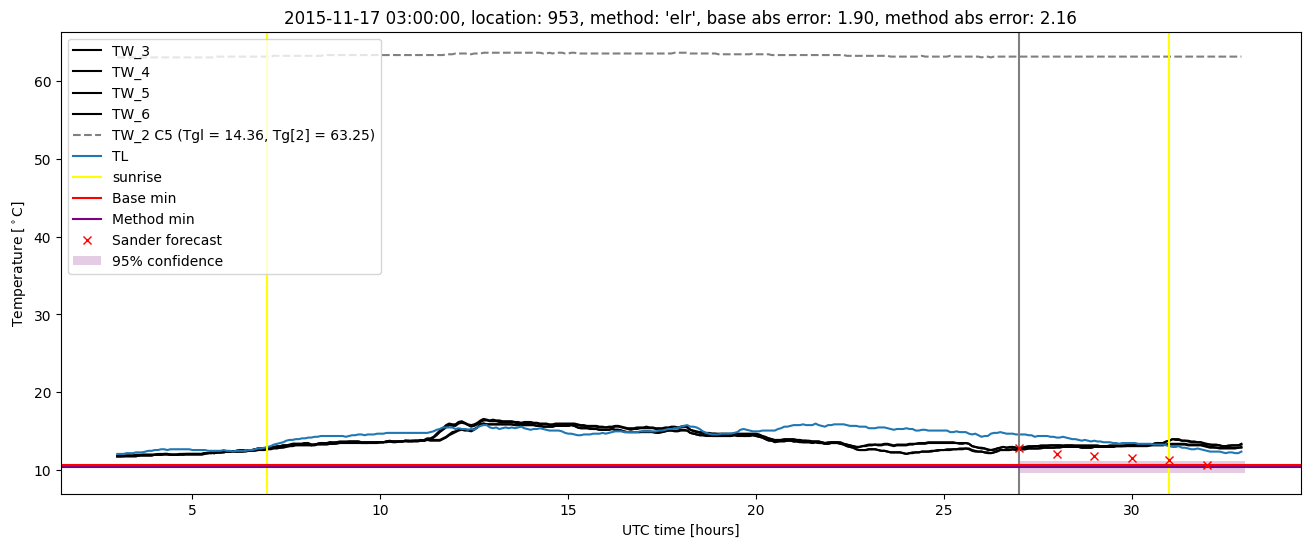
winter 2016 |
1.000 |
0.158 |
0.358 |
0.461 |
1.898 |
NaN |
NaN |
| forest |
winter 2016 |
0.995 |
0.210 |
0.295 |
0.409 |
1.819 |
0.455 |
6.884 |
| baseline |
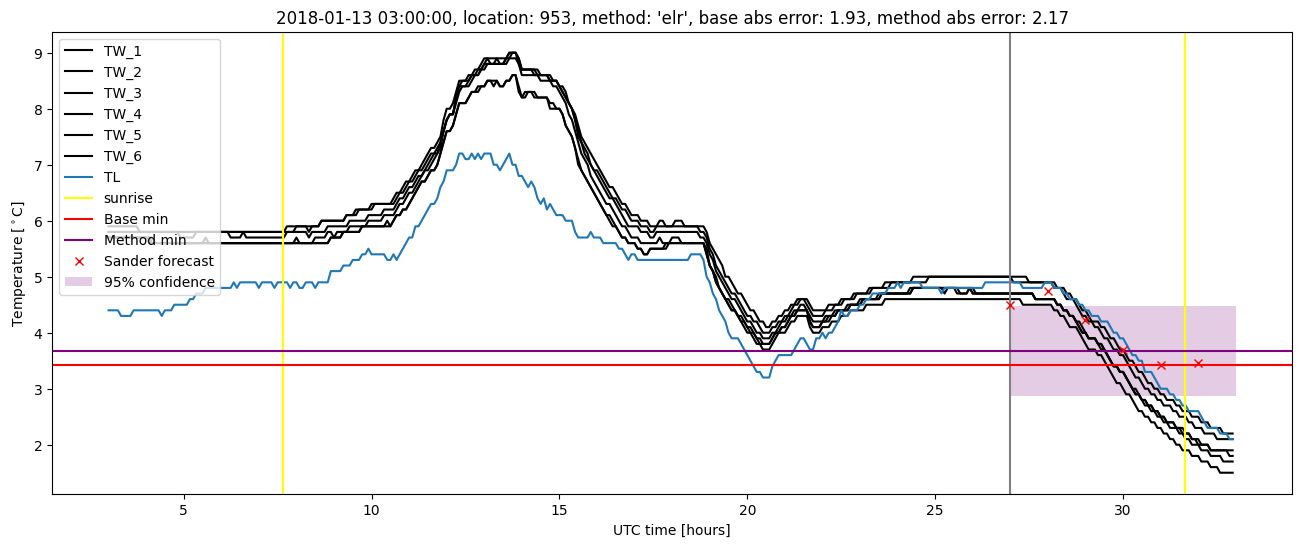
winter 2017 |
0.974 |
0.086 |
0.337 |
0.430 |
2.326 |
NaN |
NaN |
| forest |
winter 2017 |
0.991 |
0.029 |
0.236 |
0.358 |
1.793 |
0.451 |
5.661 |
| baseline |
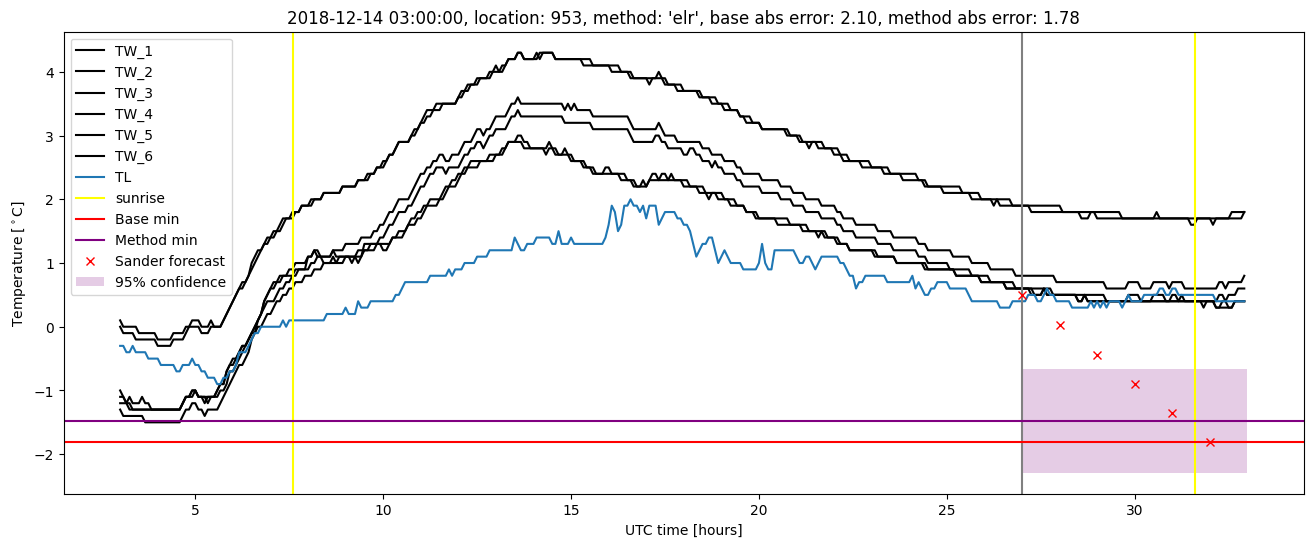
winter 2018 |
0.973 |
0.071 |
0.337 |
0.426 |
2.064 |
NaN |
NaN |
| forest |
winter 2018 |
0.973 |
0.071 |
0.233 |
0.339 |
2.305 |
0.444 |
4.644 |
| baseline |
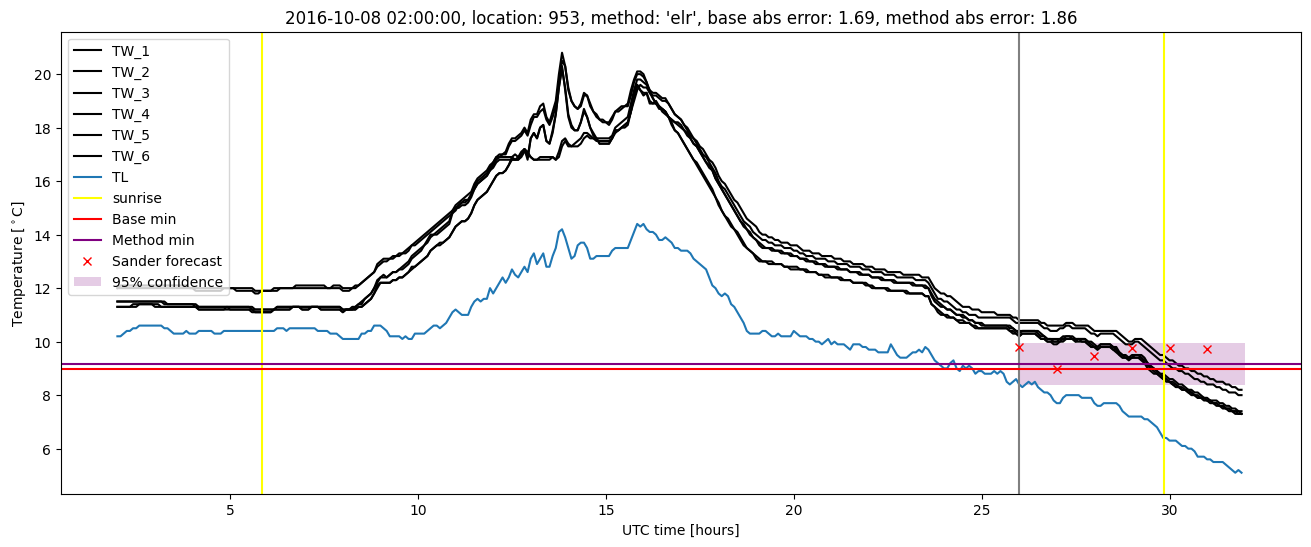
winter 2019 |
0.987 |
0.000e+00 |
0.307 |
0.412 |
2.101 |
NaN |
NaN |
| forest |
winter 2019 |
0.987 |
0.071 |
0.200 |
0.349 |
1.171 |
0.434 |
4.143 |
| baseline |
all |
0.985 |
0.083 |
0.336 |
0.434 |
2.326 |
NaN |
NaN |
| forest |
all |
0.987 |
0.083 |
0.245 |
0.366 |
2.305 |
0.447 |
5.412 |
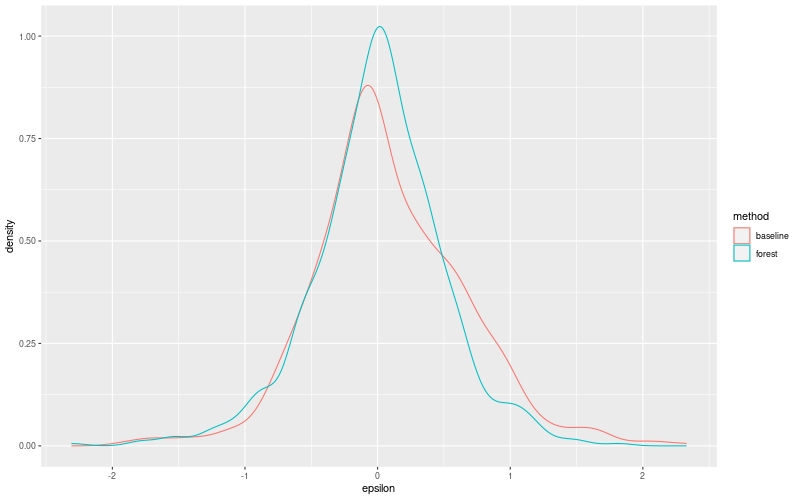
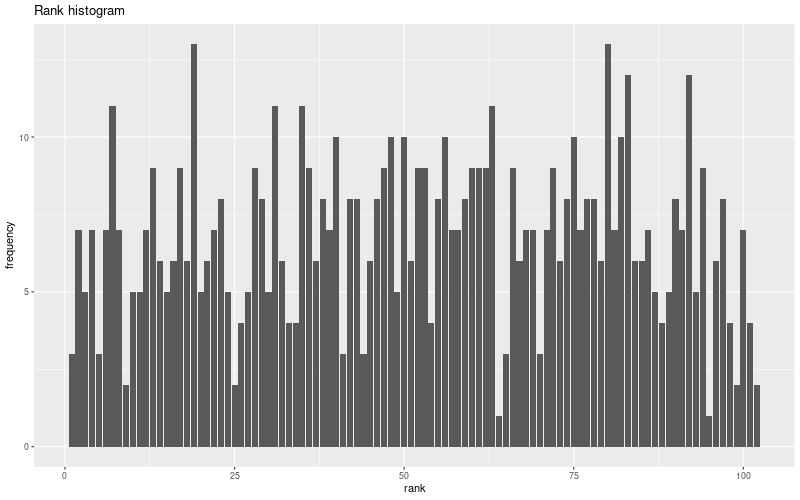
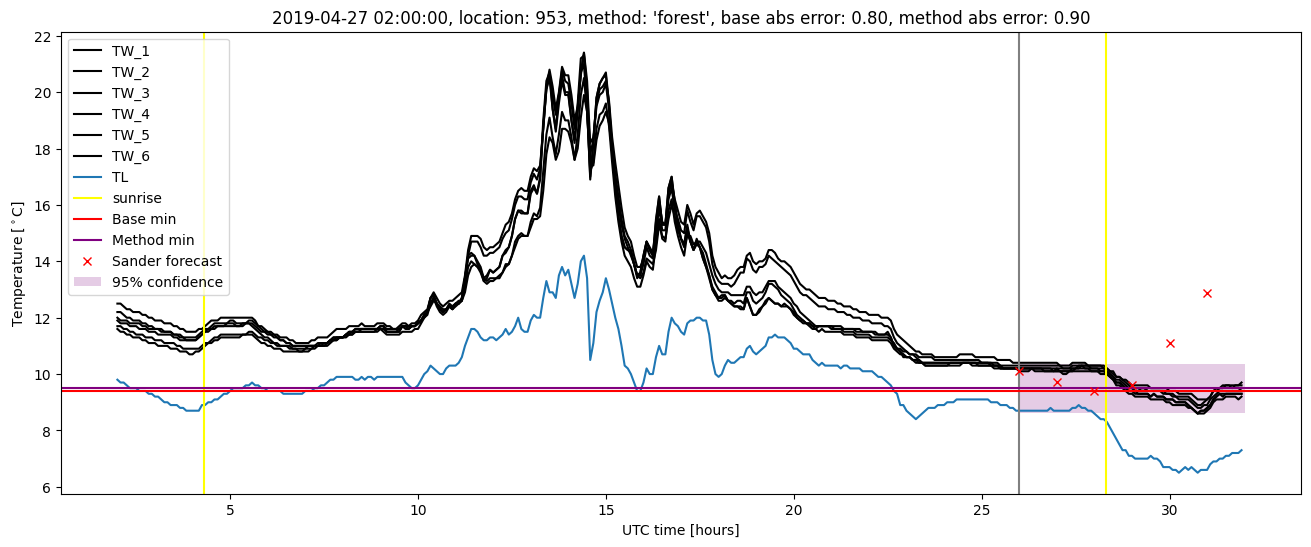
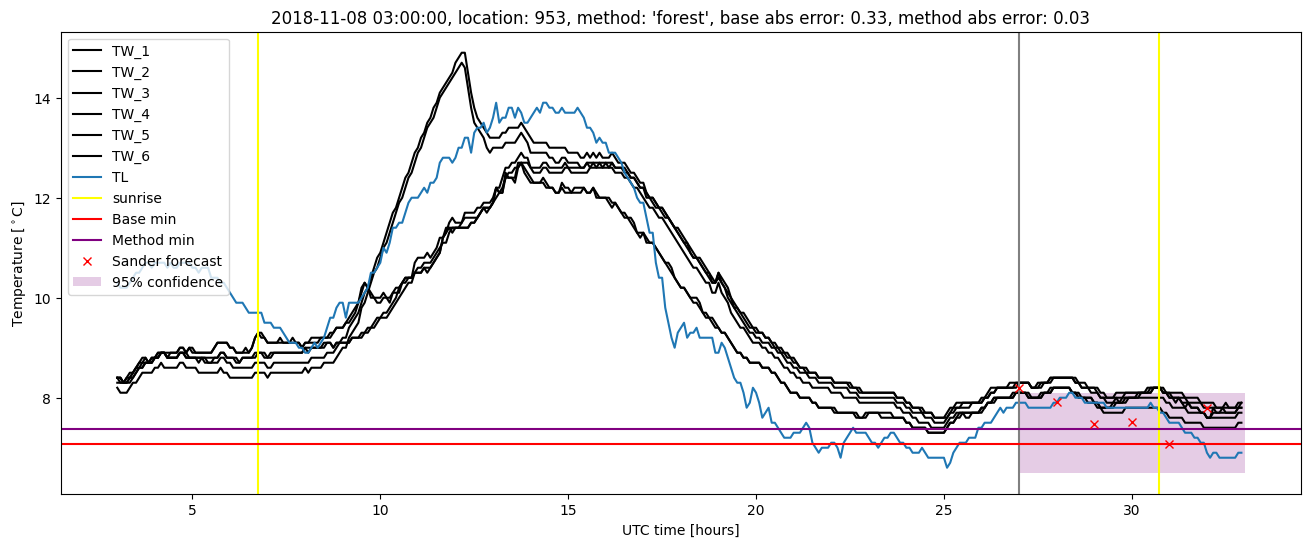
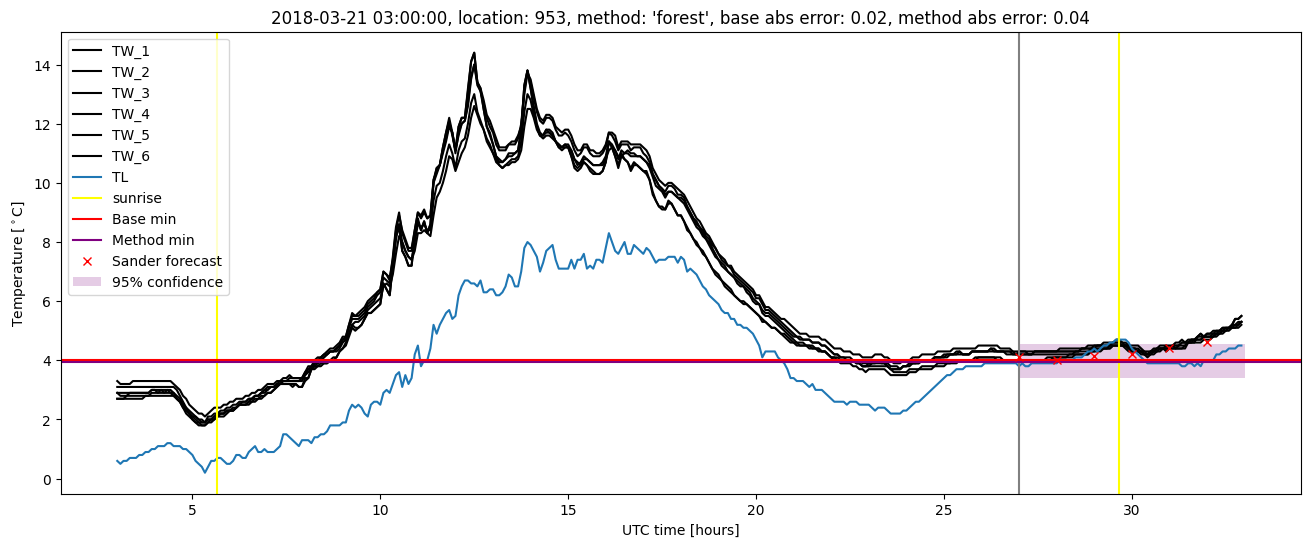
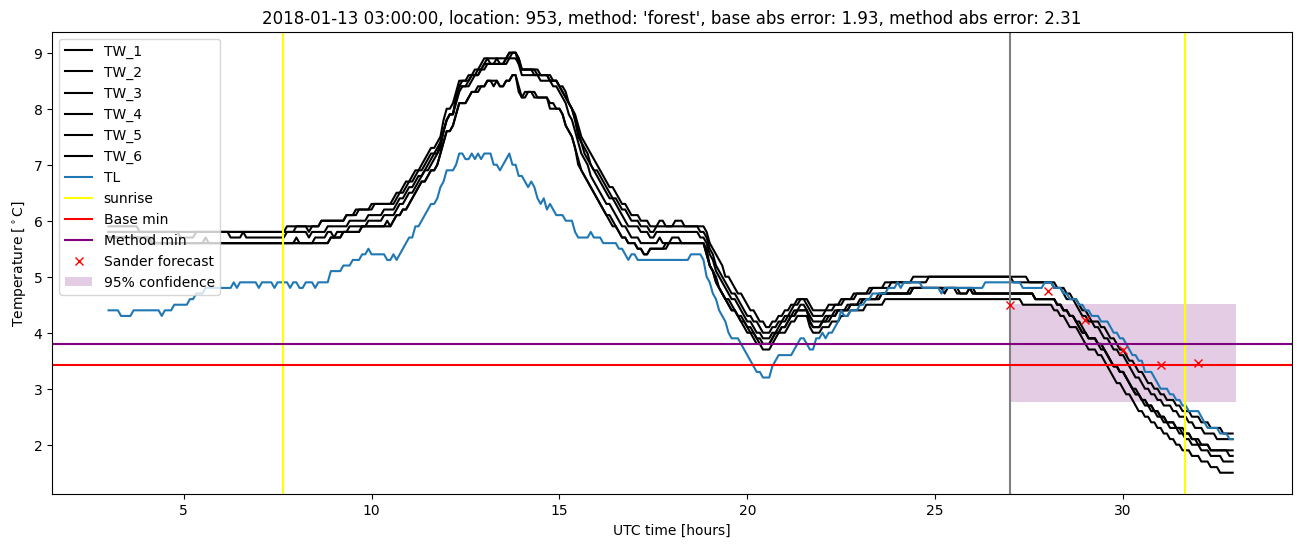
Random forest plots
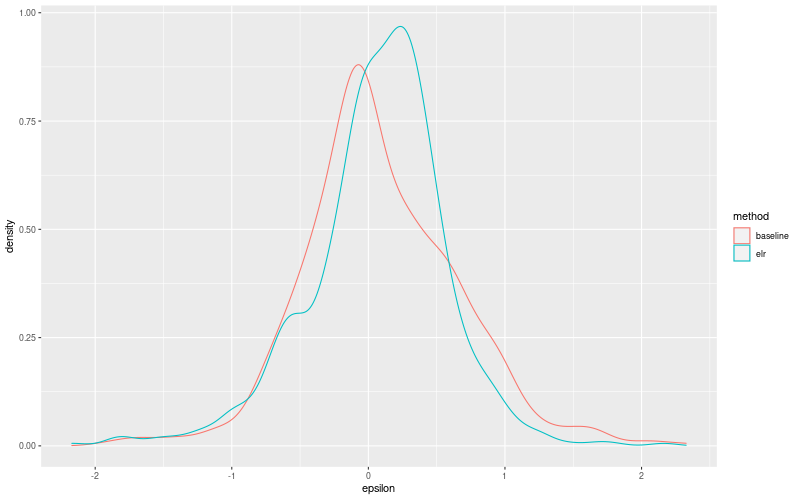
Extended logistic regression results
| names |
period |
power |
significance |
meanSquareError |
absError |
maxError |
CRPS |
IGN |
| baseline |
winter 2016 |
1.000 |
0.158 |
0.358 |
0.461 |
1.898 |
NaN |
NaN |
| elr |
winter 2016 |
1.000 |
0.105 |
0.303 |
0.421 |
2.163 |
0.555 |
8.032 |
| baseline |
winter 2017 |
0.974 |
0.086 |
0.337 |
0.430 |
2.326 |
NaN |
NaN |
| elr |
winter 2017 |
0.983 |
0.086 |
0.249 |
0.377 |
1.856 |
0.531 |
6.277 |
| baseline |
winter 2018 |
0.973 |
0.071 |
0.337 |
0.426 |
2.064 |
NaN |
NaN |
| elr |
winter 2018 |
0.980 |
0.071 |
0.246 |
0.358 |
2.171 |
0.507 |
5.252 |
| baseline |
winter 2019 |
0.987 |
0.000e+00 |
0.307 |
0.412 |
2.101 |
NaN |
NaN |
| elr |
winter 2019 |
0.980 |
0.000e+00 |
0.227 |
0.372 |
1.779 |
0.538 |
5.576 |
| baseline |
all |
0.985 |
0.083 |
0.336 |
0.434 |
2.326 |
NaN |
NaN |
| elr |
all |
0.987 |
0.073 |
0.259 |
0.384 |
2.171 |
0.534 |
6.374 |
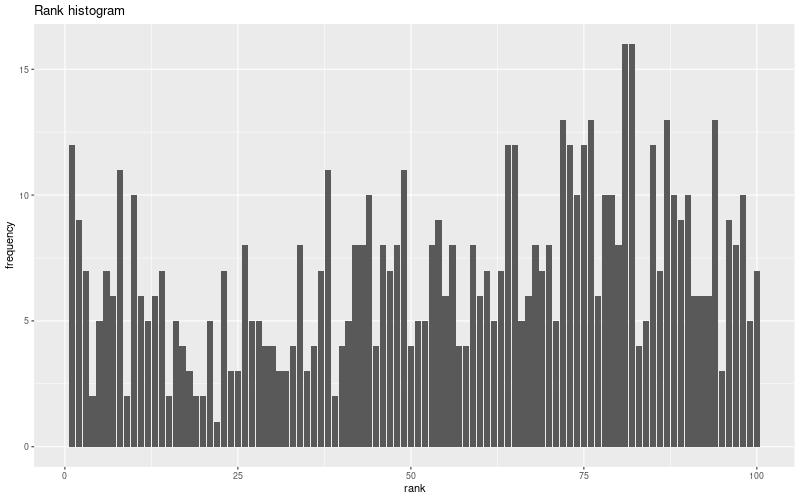
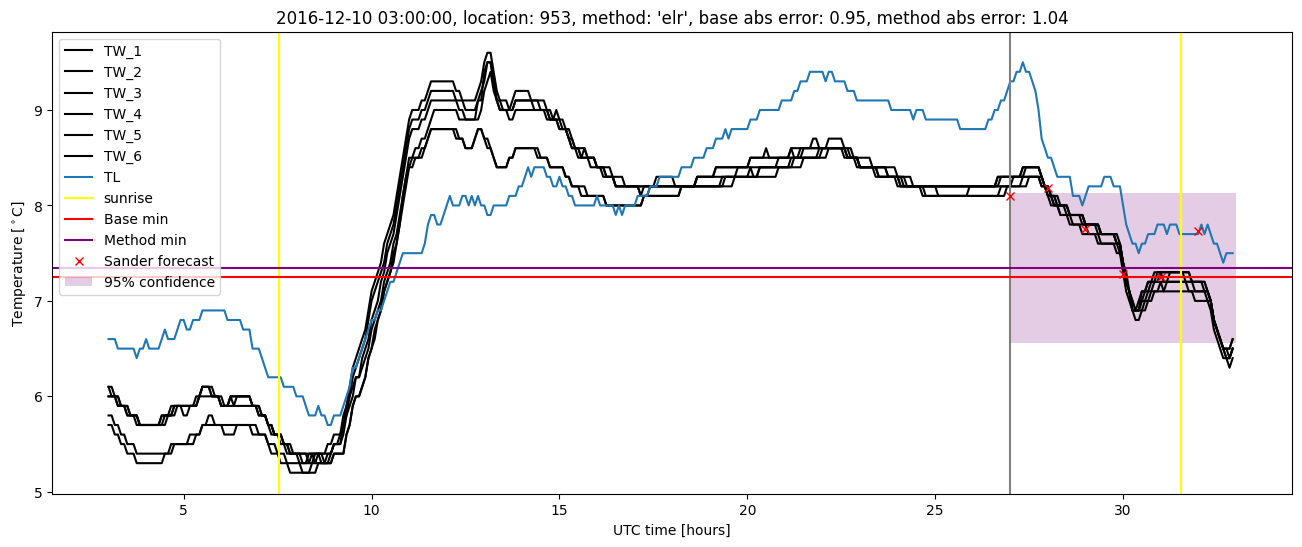
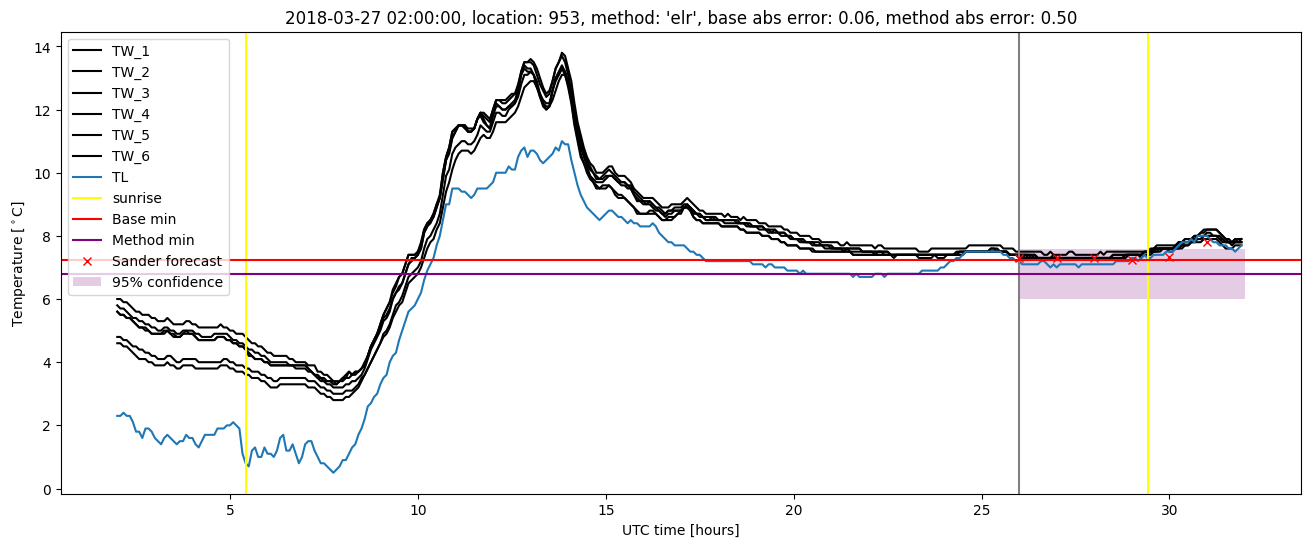
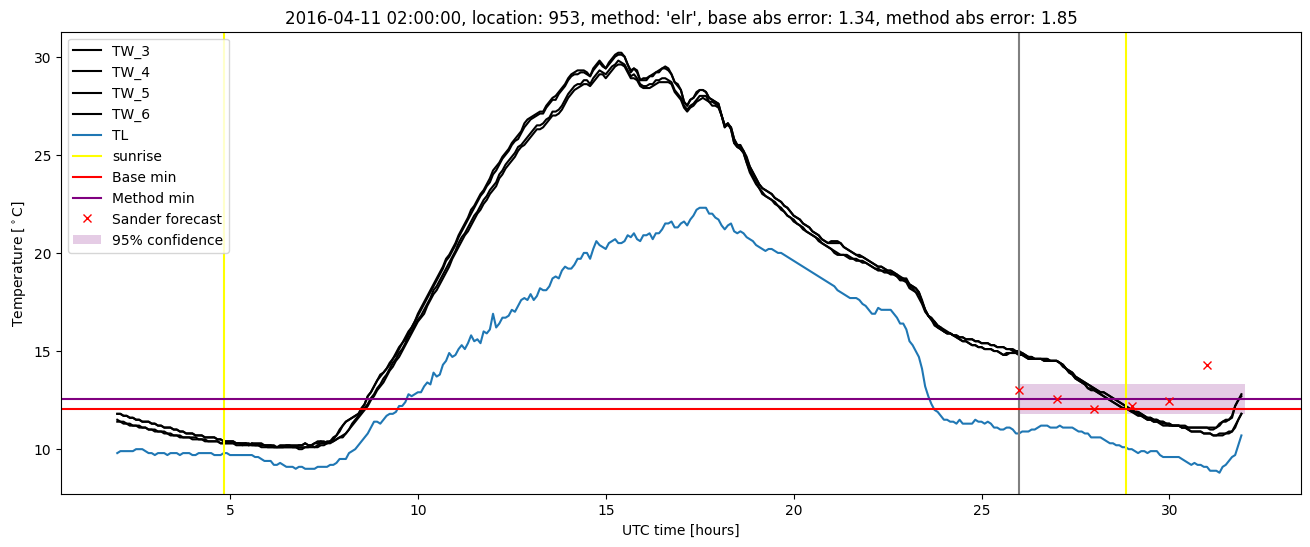
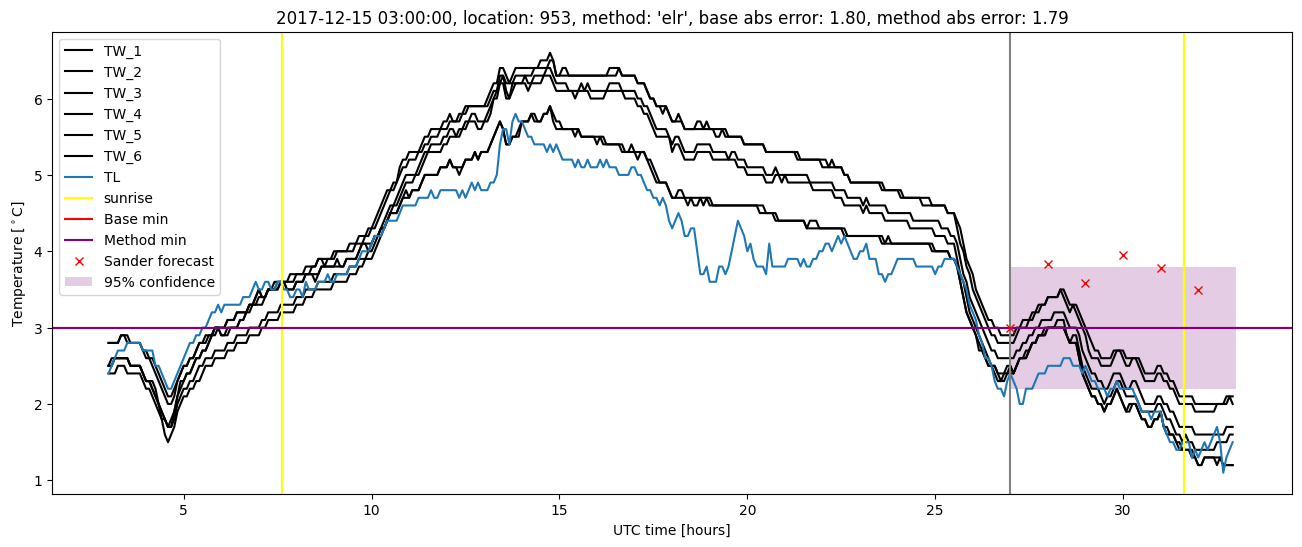
Extended logistic regression plots