GMS location: 952
Random forest results
| names |
period |
power |
significance |
meanSquareError |
absError |
maxError |
CRPS |
IGN |
| baseline |
winter 2016 |
0.983 |
0.222 |
0.383 |
0.470 |
2.505 |
NaN |
NaN |
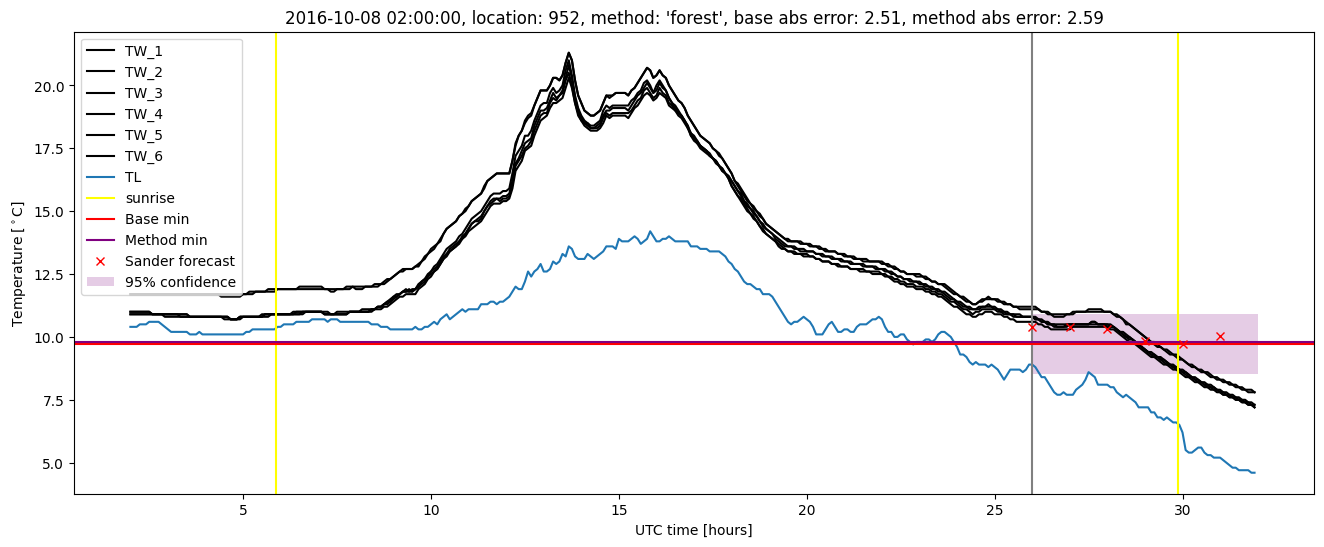
| forest |
winter 2016 |
0.989 |
0.222 |
0.316 |
0.417 |
2.532 |
0.436 |
3.123 |
| baseline |
winter 2017 |
0.967 |
0.031 |
0.345 |
0.412 |
2.509 |
NaN |
NaN |
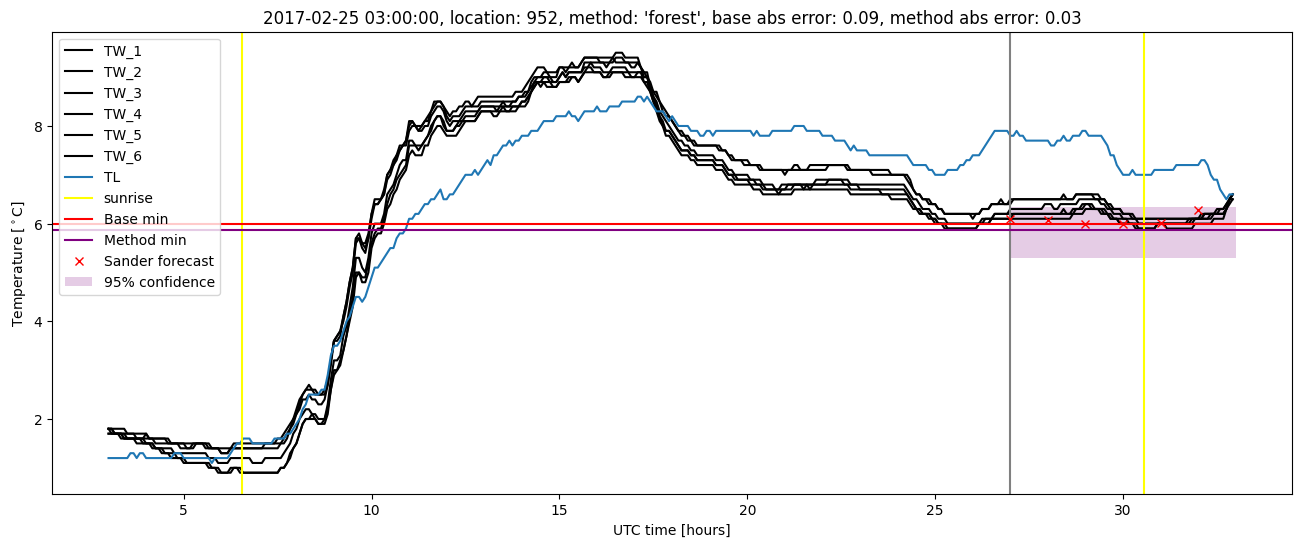
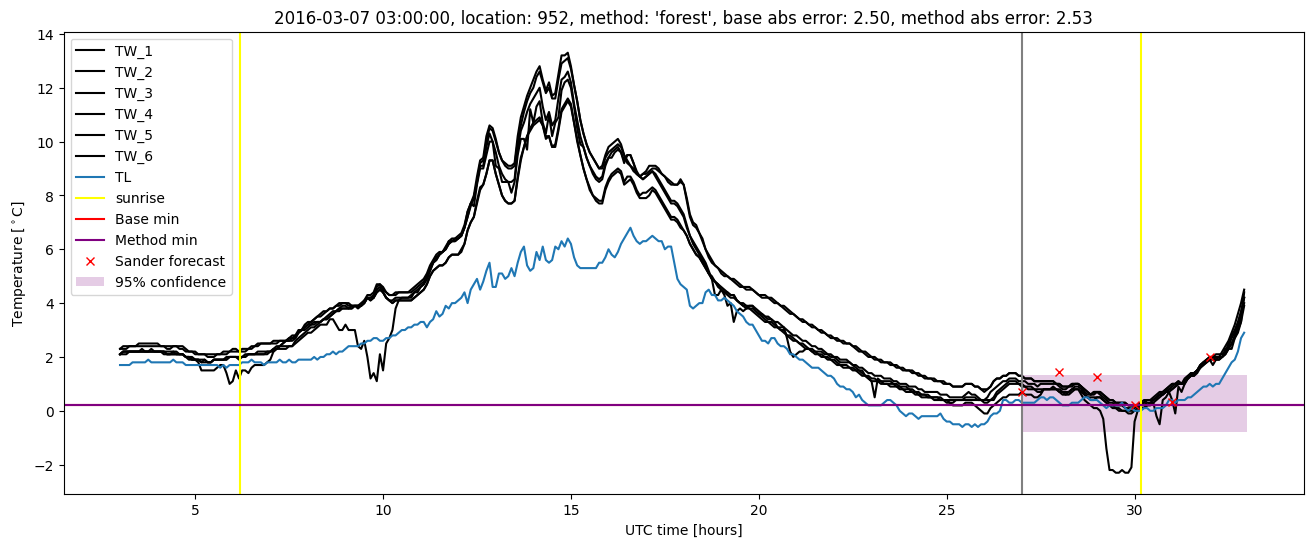
| forest |
winter 2017 |
0.967 |
0.062 |
0.254 |
0.374 |
2.593 |
0.449 |
2.617 |
| baseline |
winter 2018 |
0.986 |
0.032 |
0.397 |
0.451 |
3.618 |
NaN |
NaN |
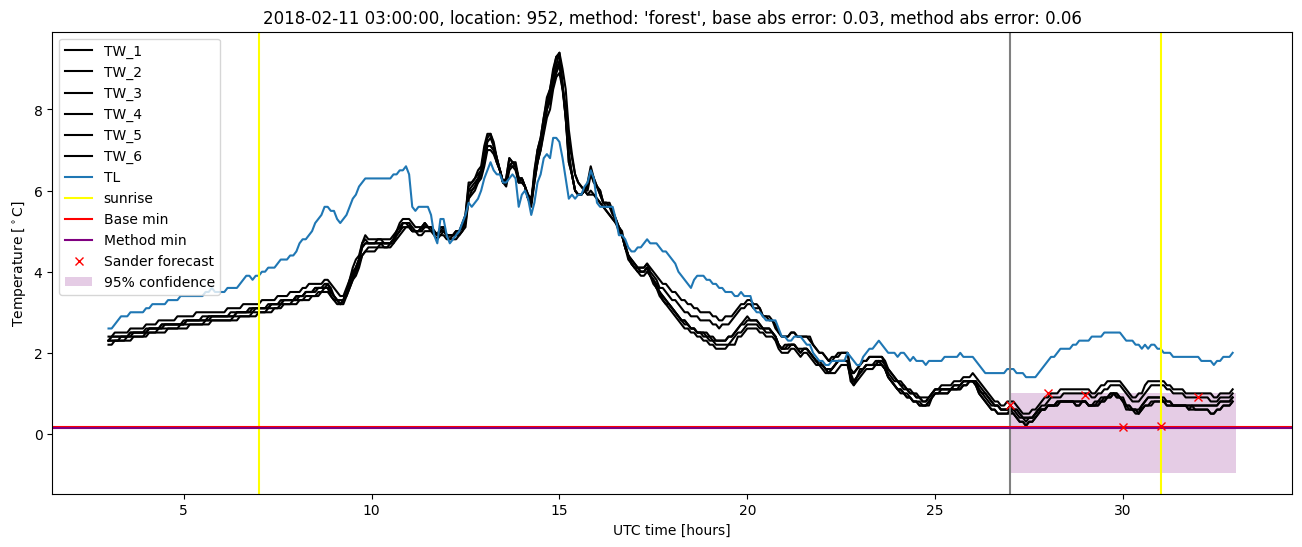
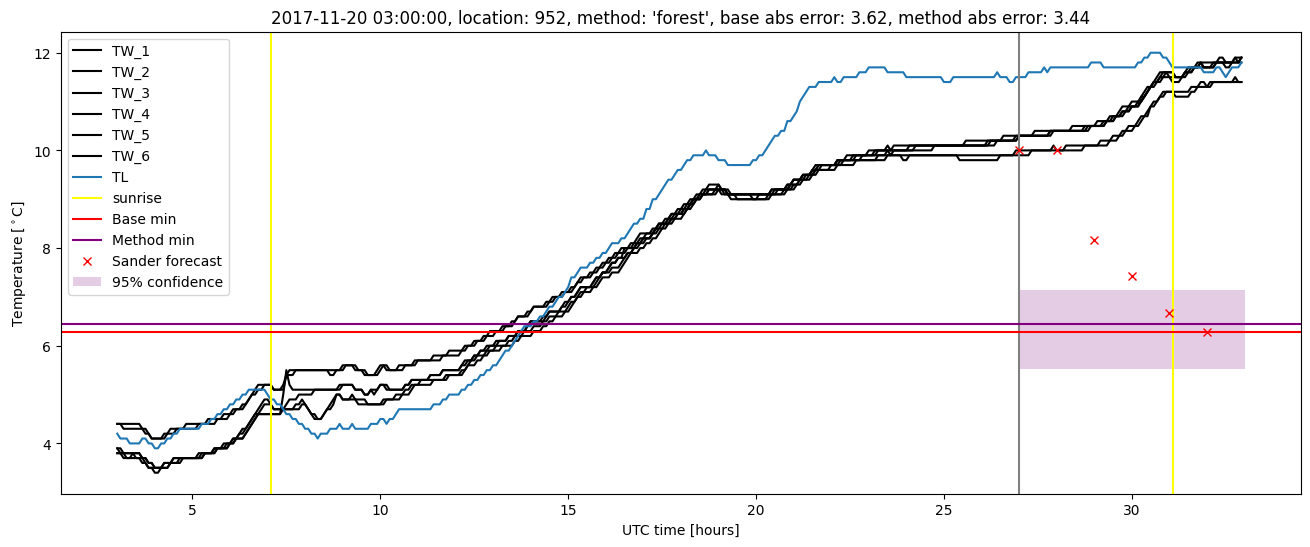
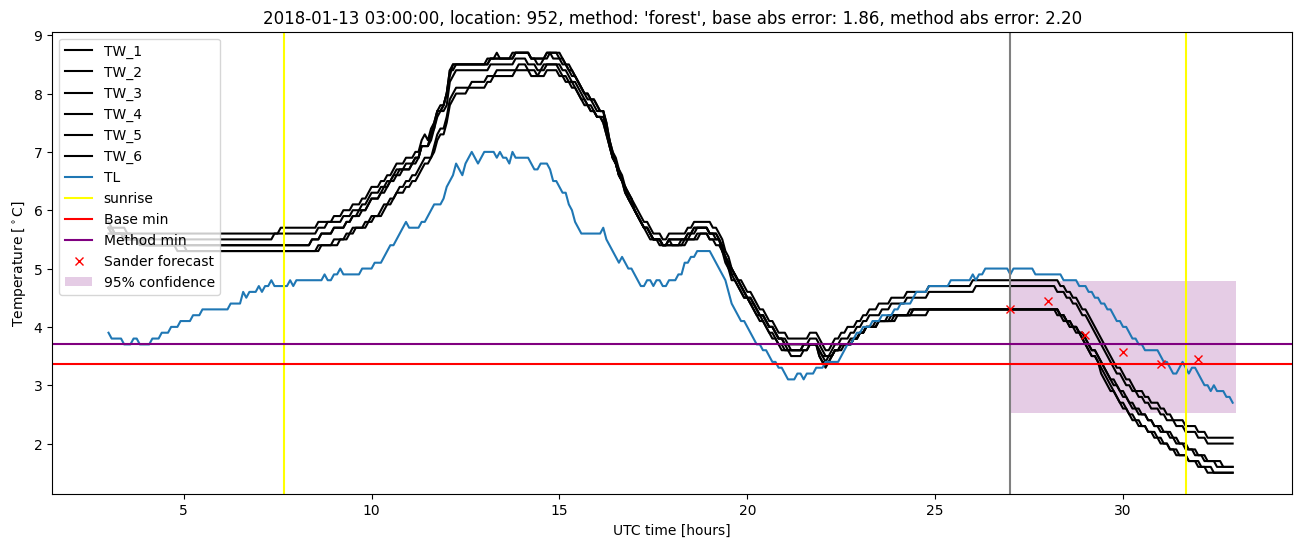
| forest |
winter 2018 |
0.986 |
0.032 |
0.350 |
0.422 |
3.445 |
0.442 |
3.238 |
| baseline |
winter 2019 |
0.971 |
0.154 |
0.374 |
0.470 |
2.312 |
NaN |
NaN |
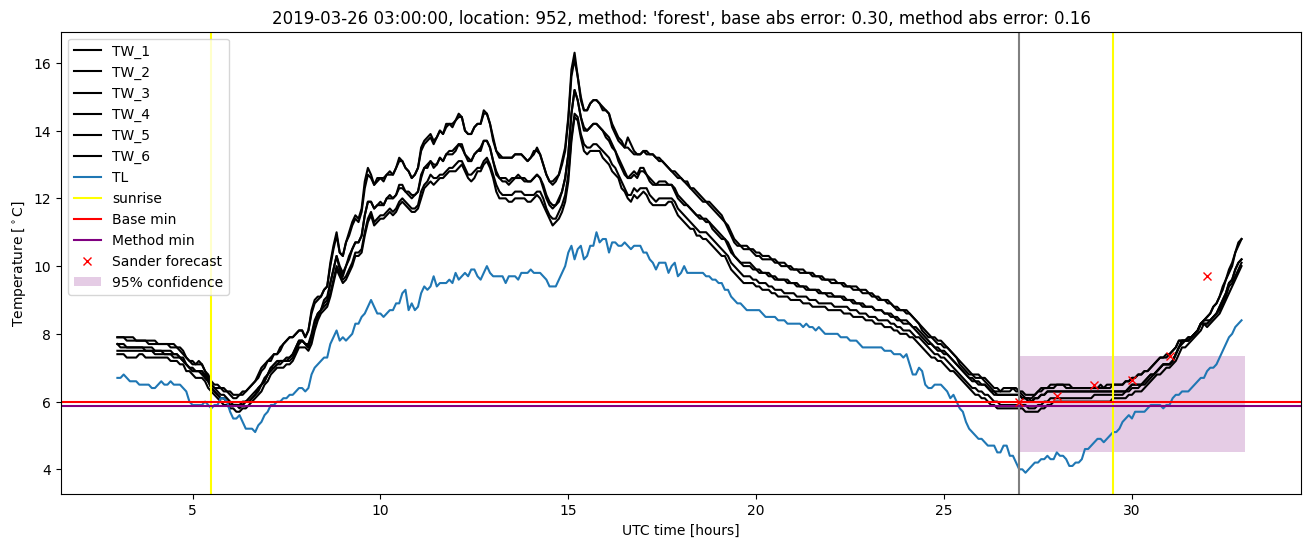
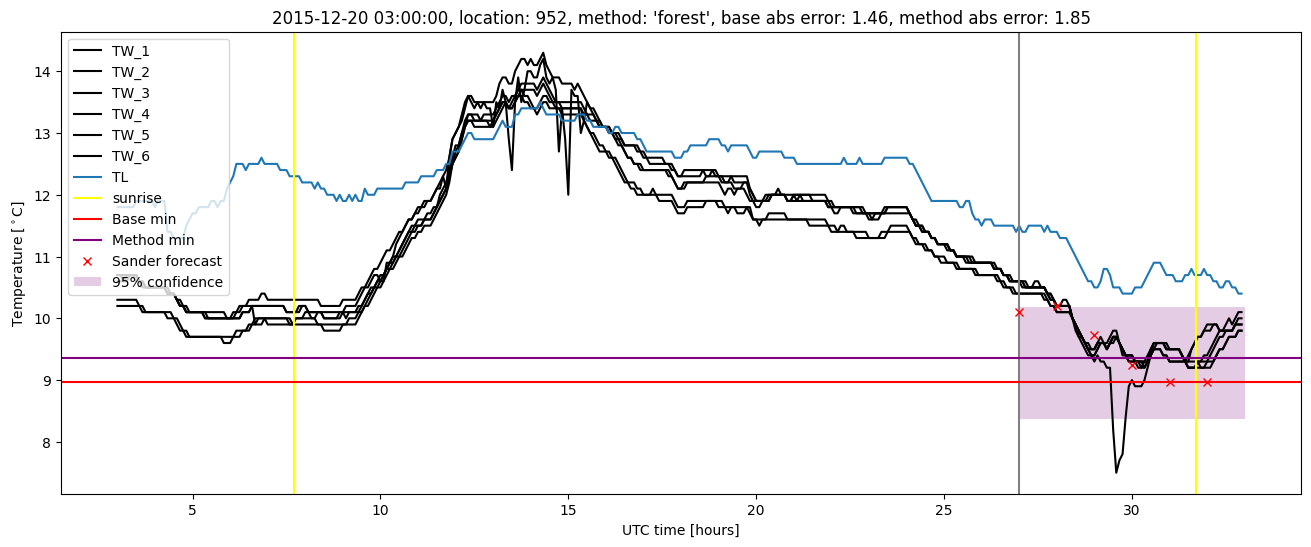
| forest |
winter 2019 |
0.978 |
0.154 |
0.264 |
0.395 |
1.551 |
0.414 |
1.827 |
| baseline |
all |
0.978 |
0.085 |
0.376 |
0.452 |
3.618 |
NaN |
NaN |
| forest |
all |
0.981 |
0.096 |
0.299 |
0.404 |
3.445 |
0.436 |
2.751 |
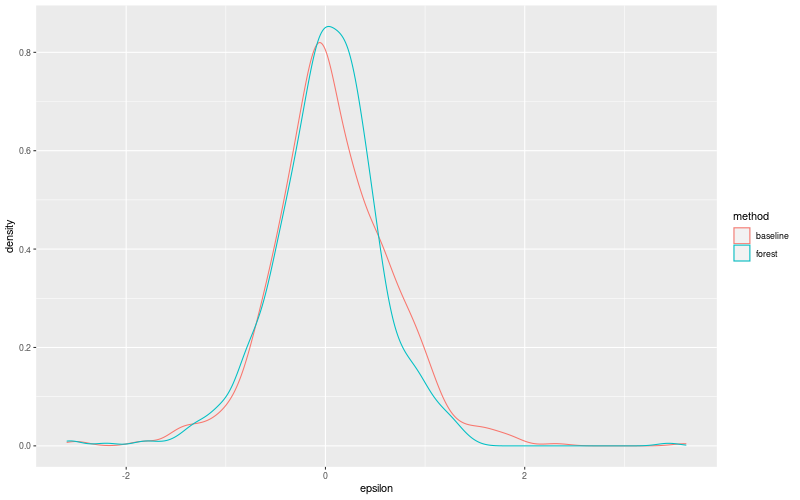
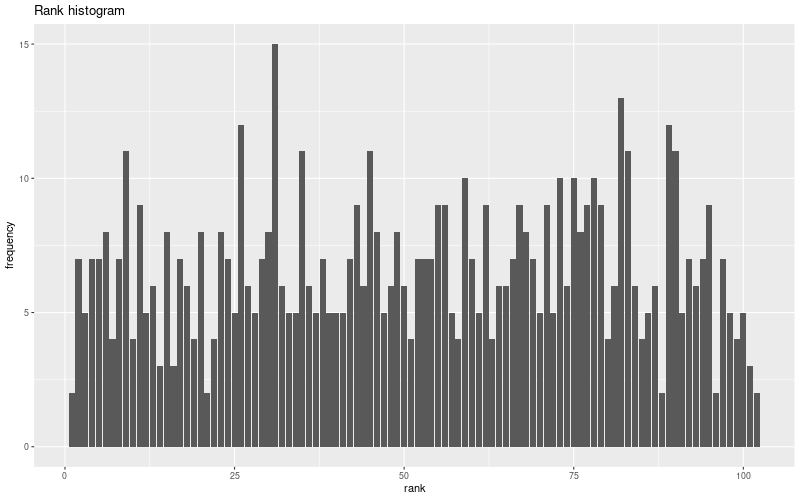
Random forest plots
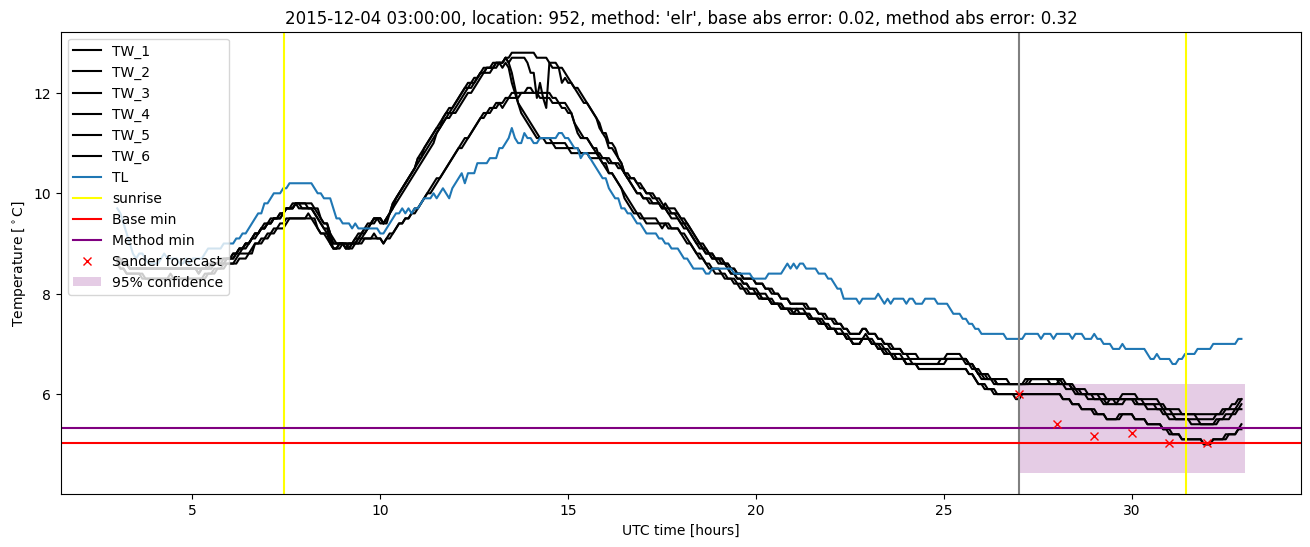
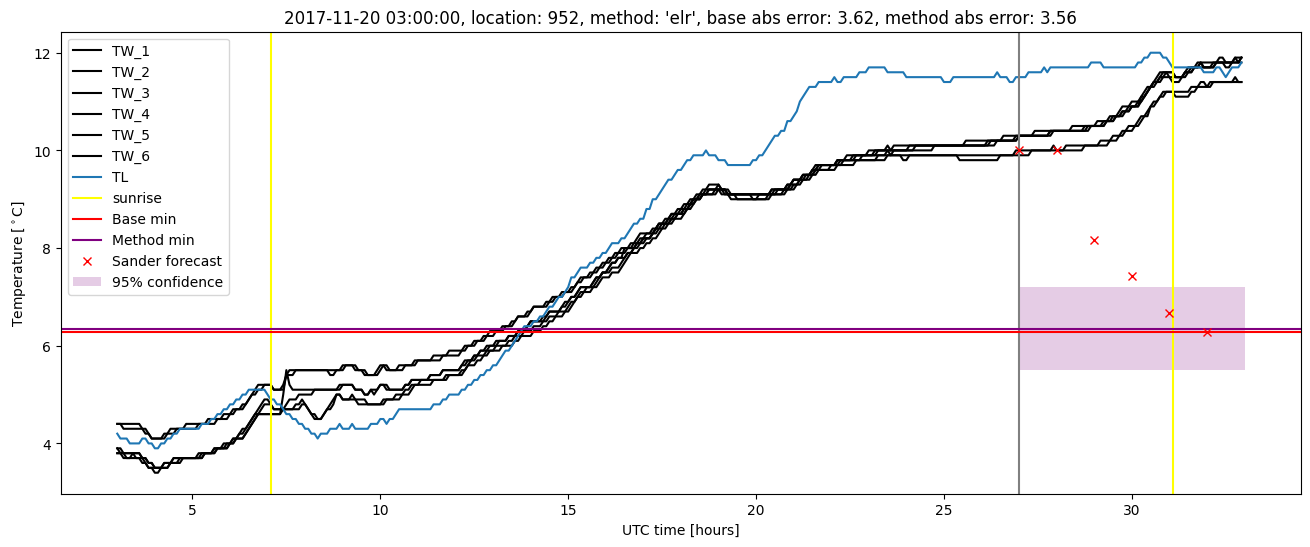
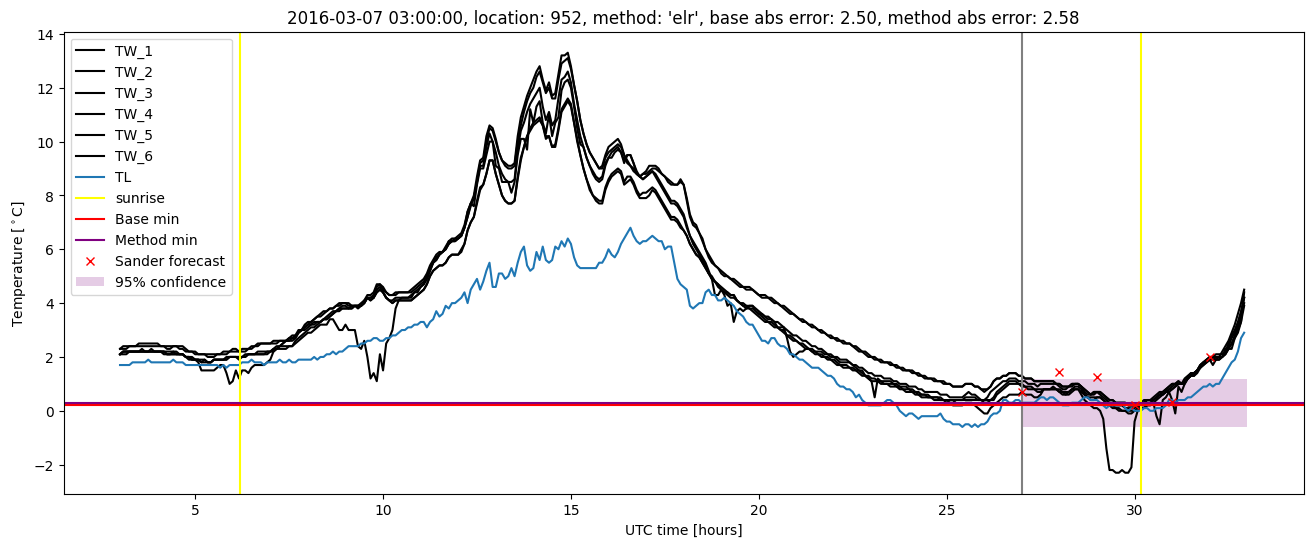
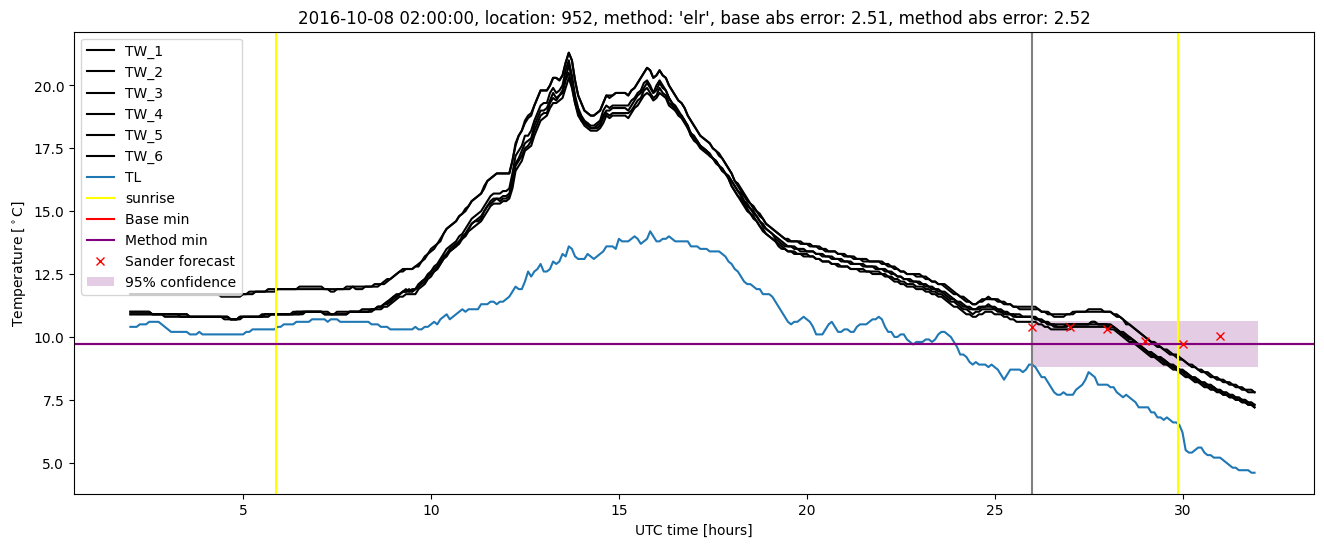
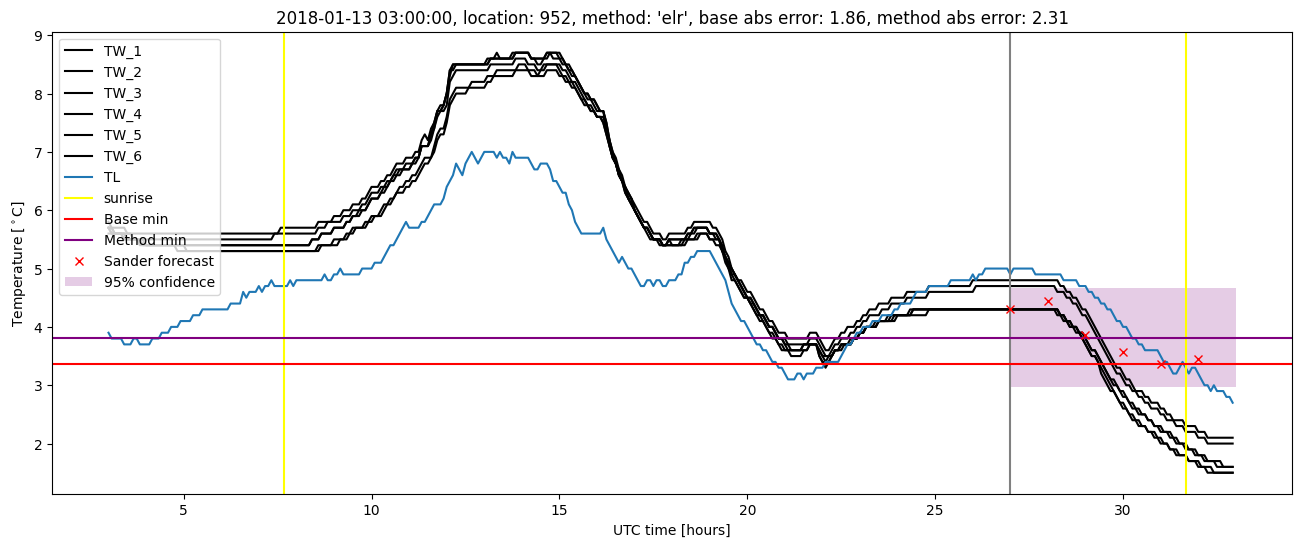
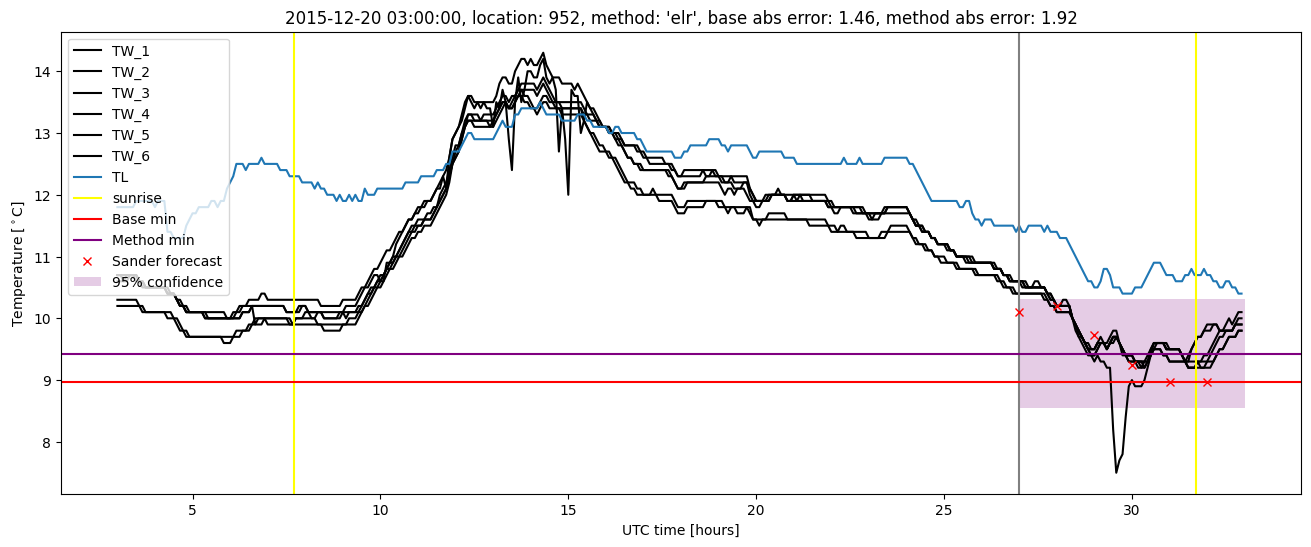
Extended logistic regression results
| names |
period |
power |
significance |
meanSquareError |
absError |
maxError |
CRPS |
IGN |
| baseline |
winter 2016 |
0.983 |
0.222 |
0.383 |
0.470 |
2.505 |
NaN |
NaN |
| elr |
winter 2016 |
0.978 |
0.167 |
0.360 |
0.452 |
2.578 |
0.499 |
3.626 |
| baseline |
winter 2017 |
0.967 |
0.031 |
0.345 |
0.412 |
2.509 |
NaN |
NaN |
| elr |
winter 2017 |
0.967 |
0.062 |
0.243 |
0.355 |
2.523 |
0.502 |
3.415 |
| baseline |
winter 2018 |
0.986 |
0.032 |
0.397 |
0.451 |
3.618 |
NaN |
NaN |
| elr |
winter 2018 |
0.993 |
0.065 |
0.350 |
0.413 |
3.556 |
0.502 |
4.217 |
| baseline |
winter 2019 |
0.971 |
0.154 |
0.374 |
0.470 |
2.312 |
NaN |
NaN |
| elr |
winter 2019 |
0.986 |
0.154 |
0.266 |
0.391 |
1.736 |
0.466 |
3.036 |
| baseline |
all |
0.978 |
0.085 |
0.376 |
0.452 |
3.618 |
NaN |
NaN |
| elr |
all |
0.981 |
0.096 |
0.310 |
0.406 |
3.556 |
0.493 |
3.602 |
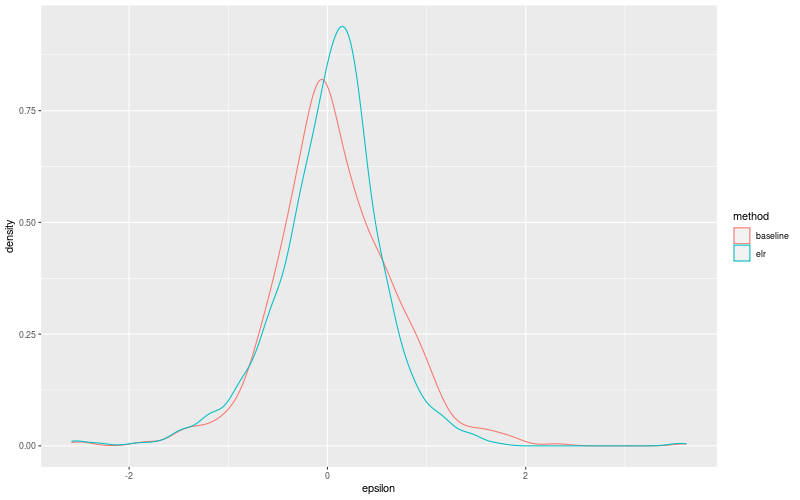
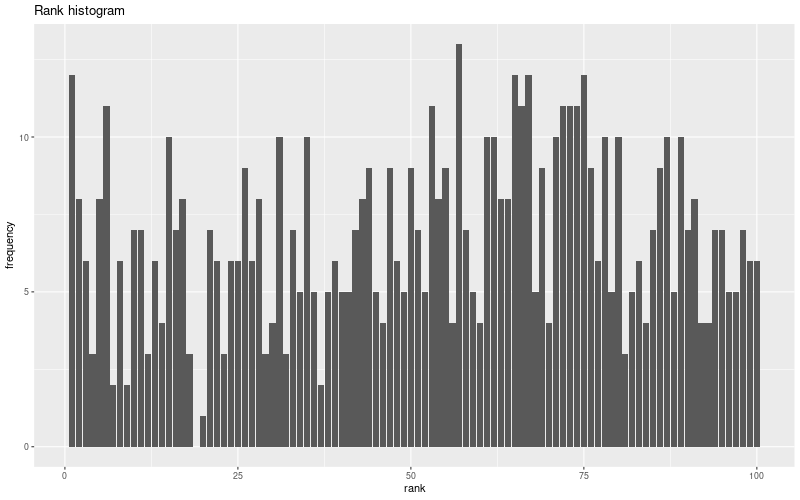
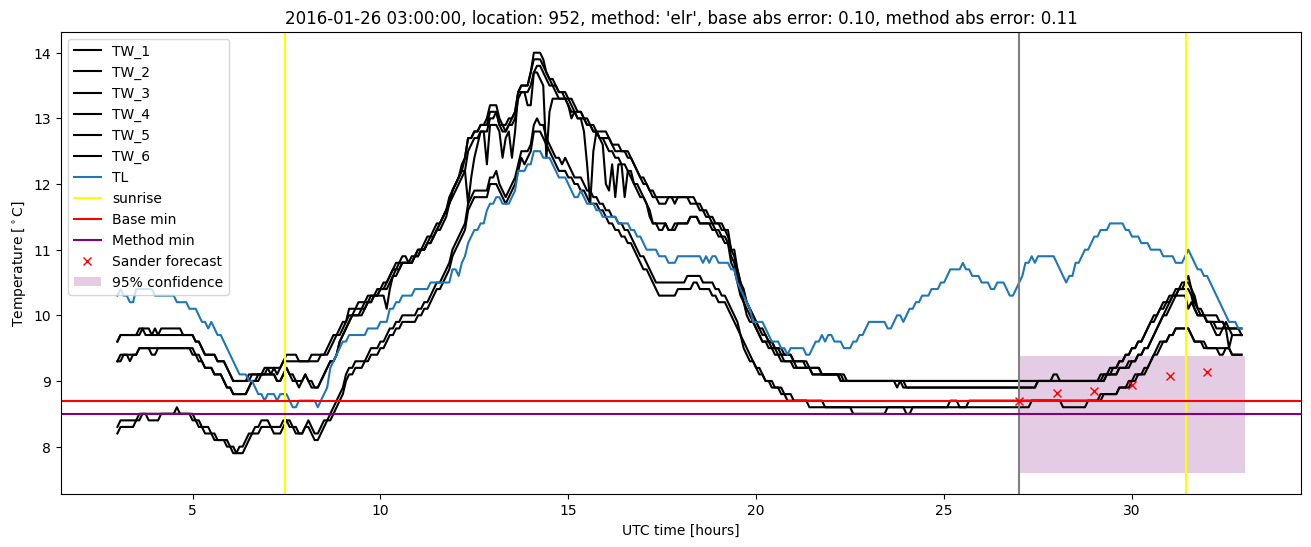
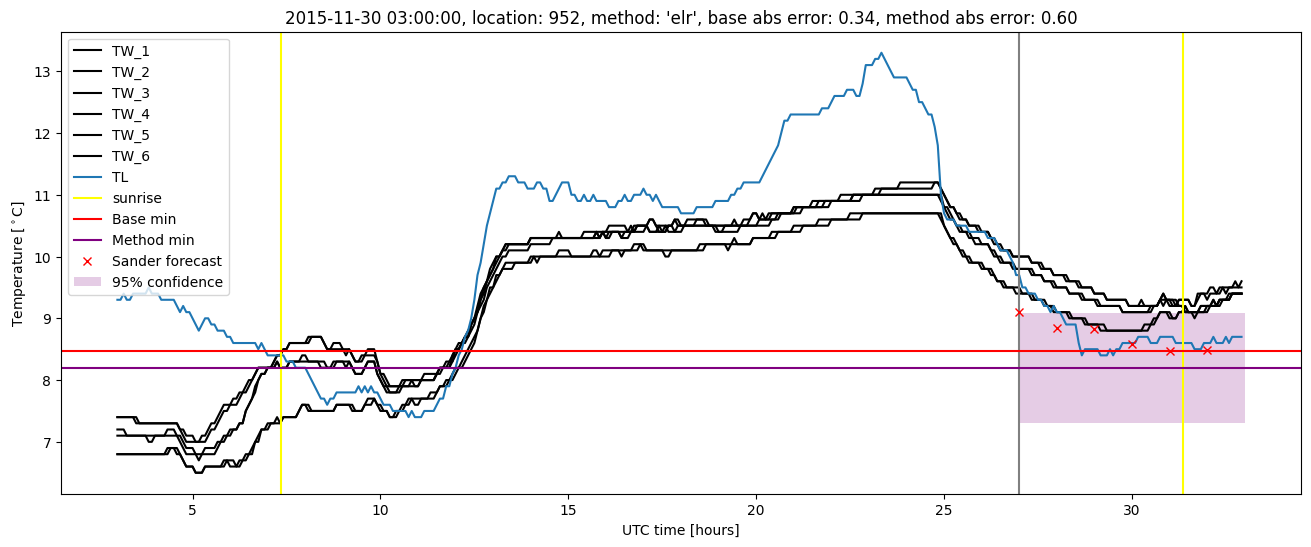
Extended logistic regression plots