GMS location: 951
Random forest results
| names |
period |
power |
significance |
meanSquareError |
absError |
maxError |
CRPS |
IGN |
| baseline |
winter 2016 |
0.979 |
0.053 |
0.323 |
0.422 |
1.768 |
NaN |
NaN |
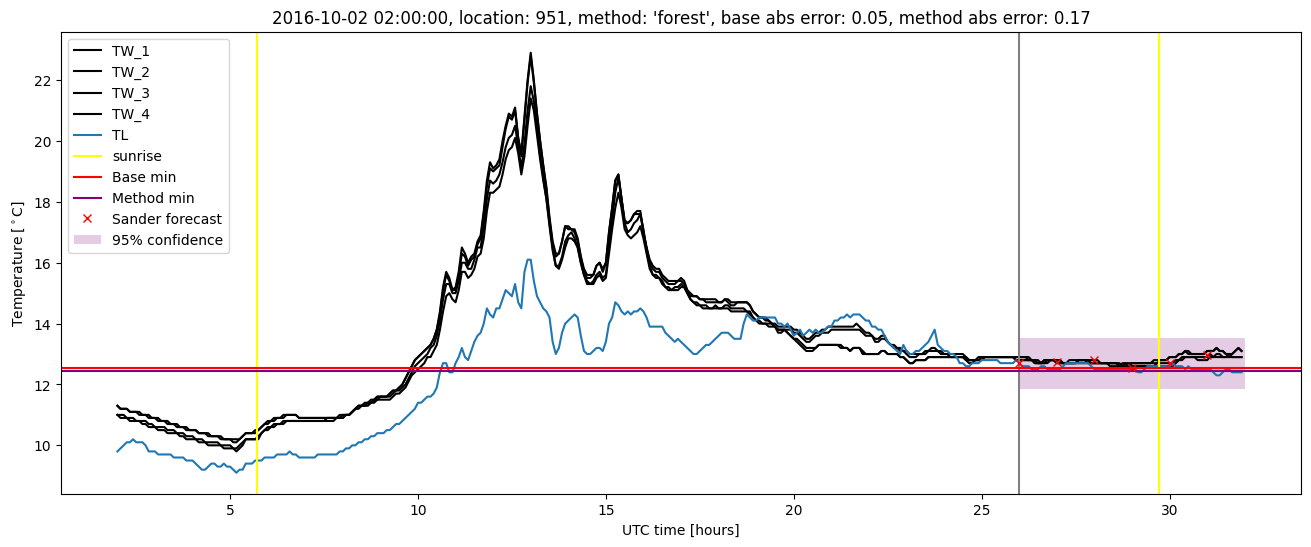
| forest |
winter 2016 |
0.989 |
0.210 |
0.241 |
0.379 |
1.533 |
0.425 |
2.998 |
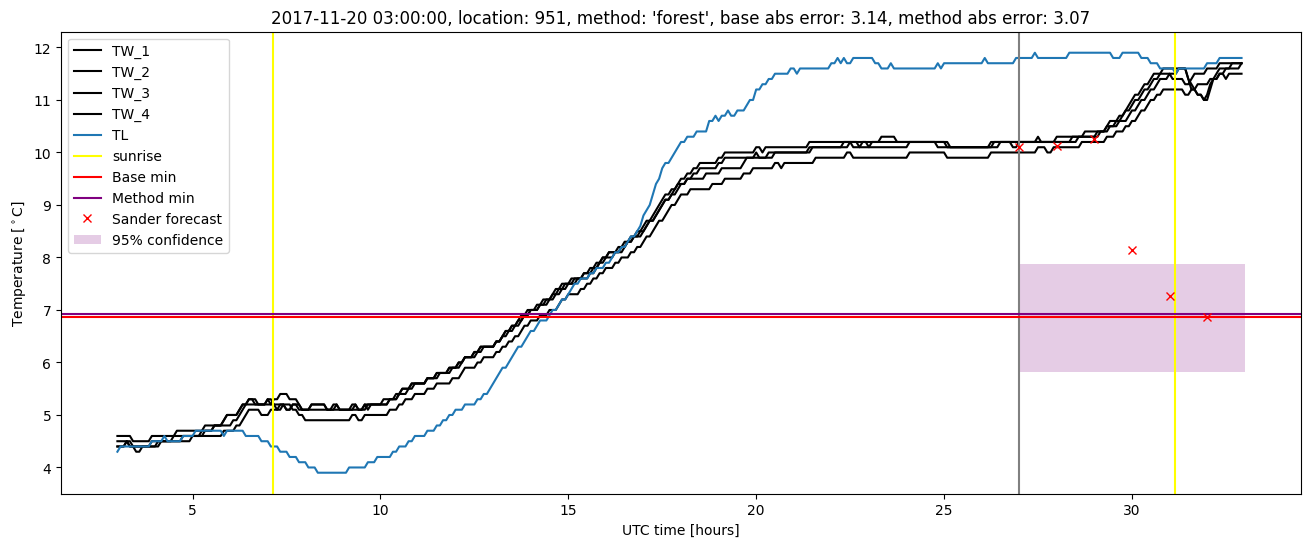
| baseline |
winter 2017 |
0.976 |
0.071 |
0.369 |
0.461 |
1.870 |
NaN |
NaN |
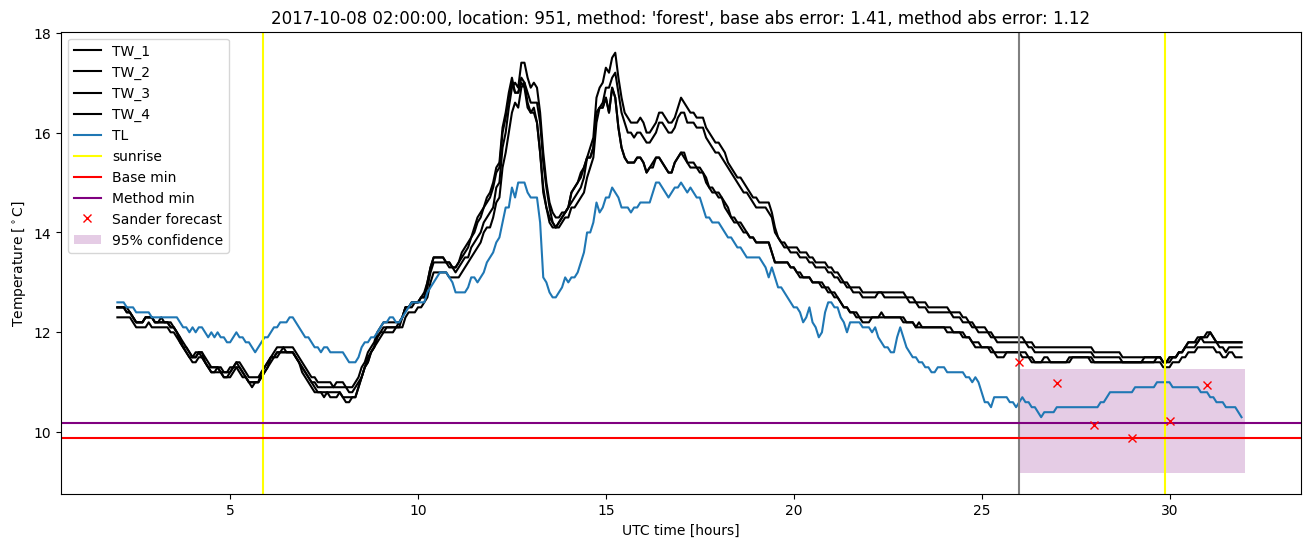
| forest |
winter 2017 |
0.976 |
0.107 |
0.248 |
0.378 |
1.412 |
0.439 |
4.277 |
| baseline |
winter 2018 |
0.974 |
0.179 |
0.461 |
0.493 |
3.142 |
NaN |
NaN |
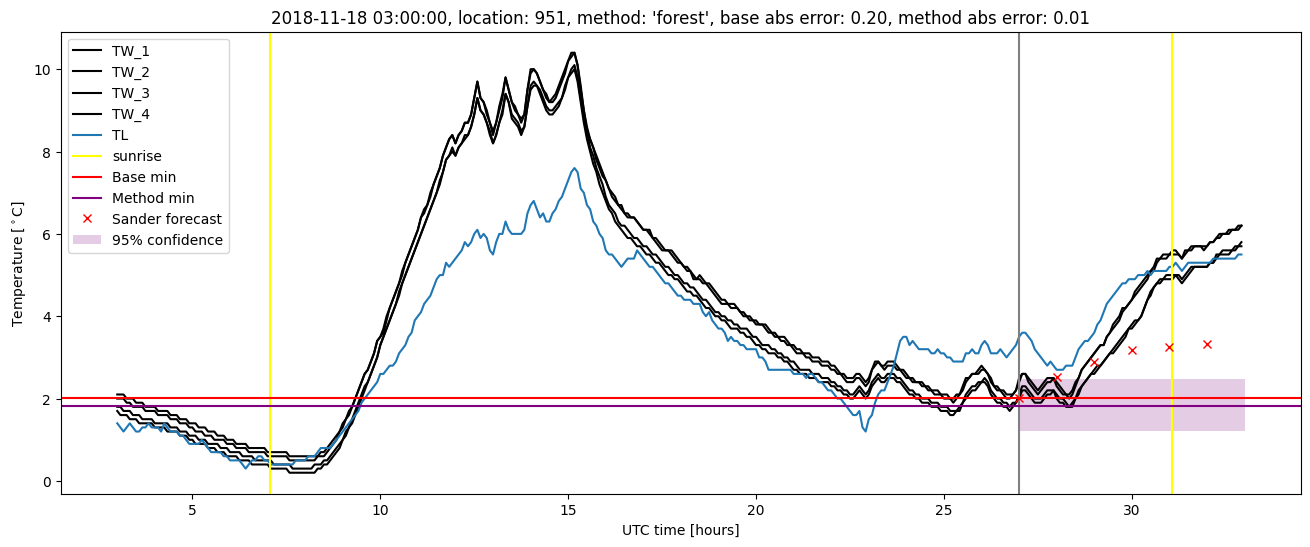
| forest |
winter 2018 |
0.968 |
0.179 |
0.363 |
0.428 |
3.069 |
0.433 |
3.187 |
| baseline |
winter 2019 |
0.981 |
0.000e+00 |
0.393 |
0.481 |
2.146 |
NaN |
NaN |
| forest |
winter 2019 |
0.974 |
0.077 |
0.266 |
0.391 |
1.808 |
0.426 |
2.676 |
| baseline |
all |
0.978 |
0.091 |
0.385 |
0.463 |
3.142 |
NaN |
NaN |
| forest |
all |
0.978 |
0.148 |
0.280 |
0.394 |
3.069 |
0.430 |
3.246 |
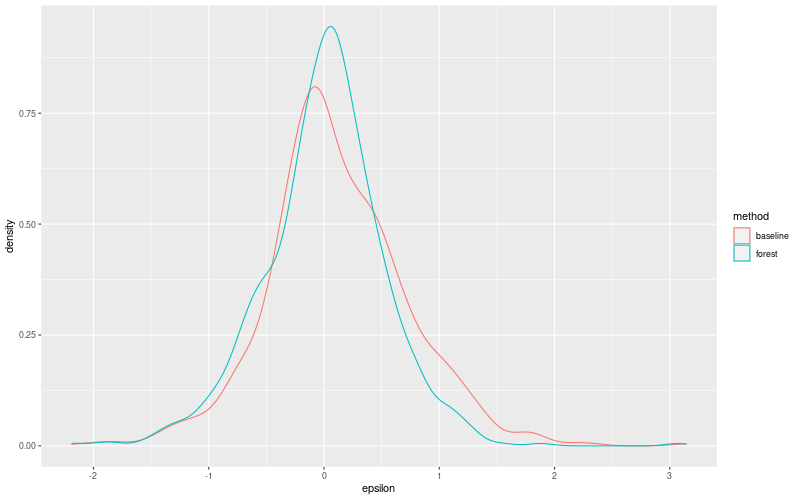
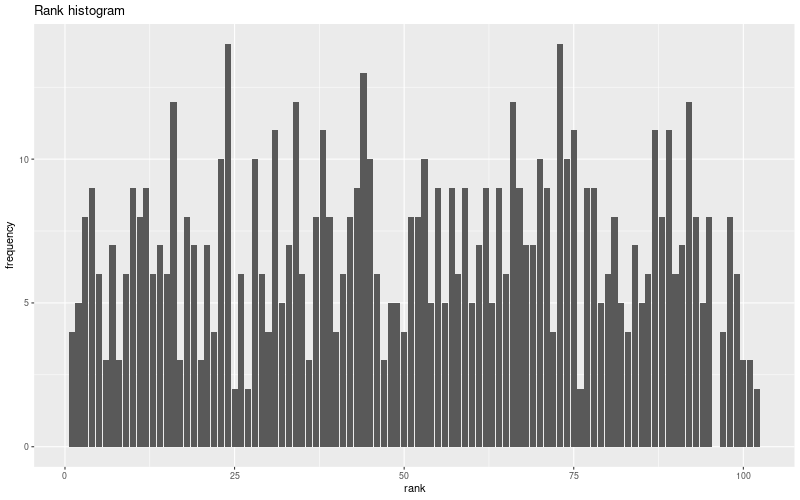
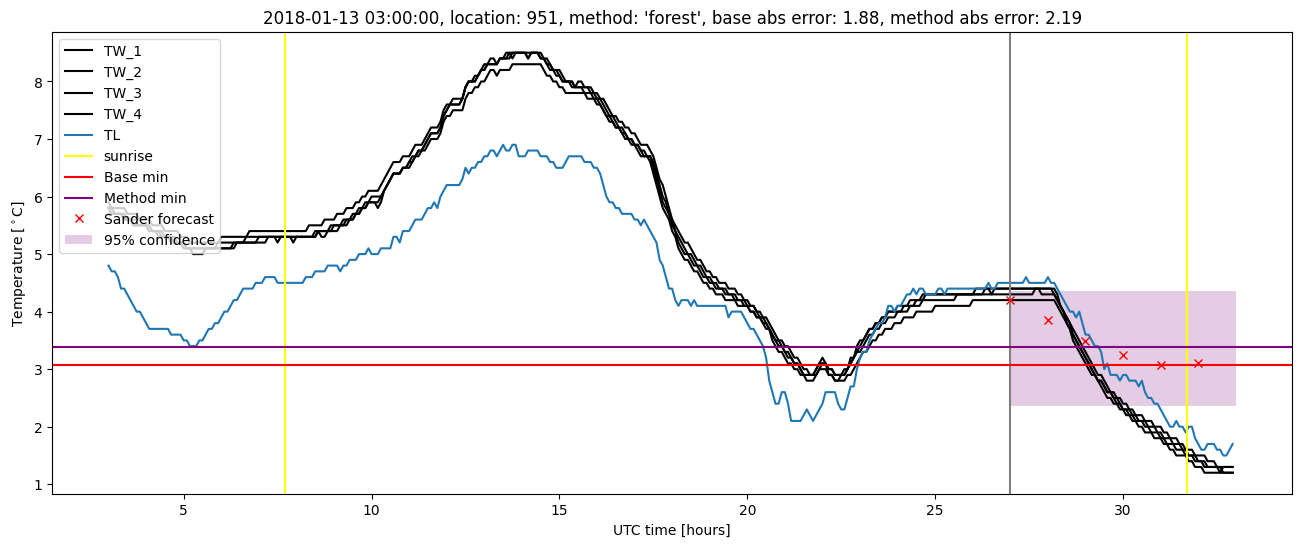
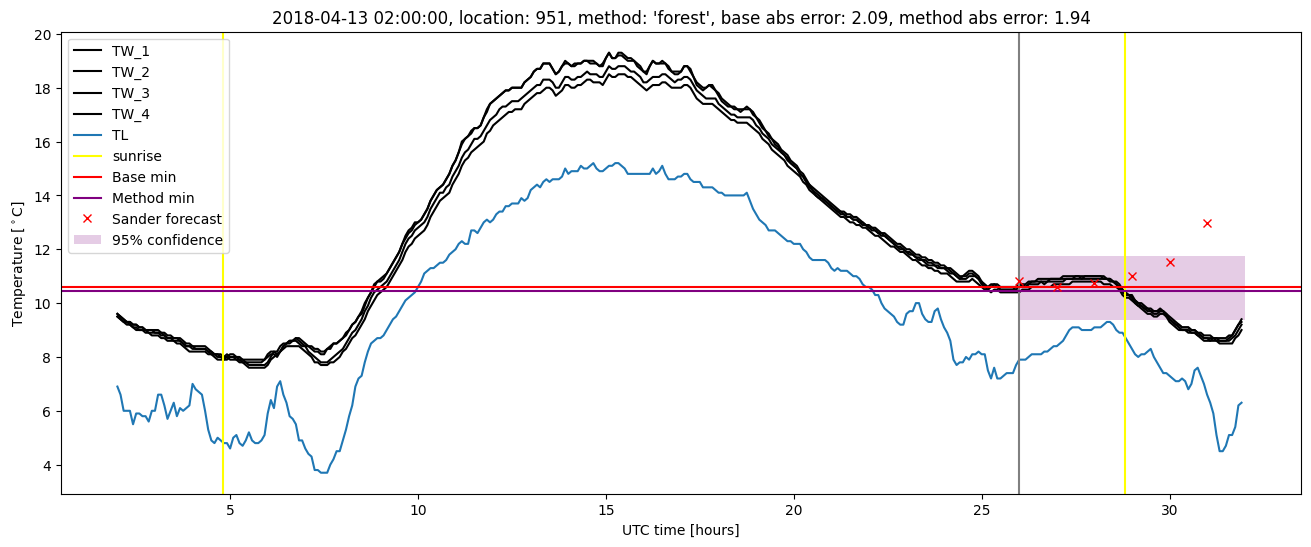
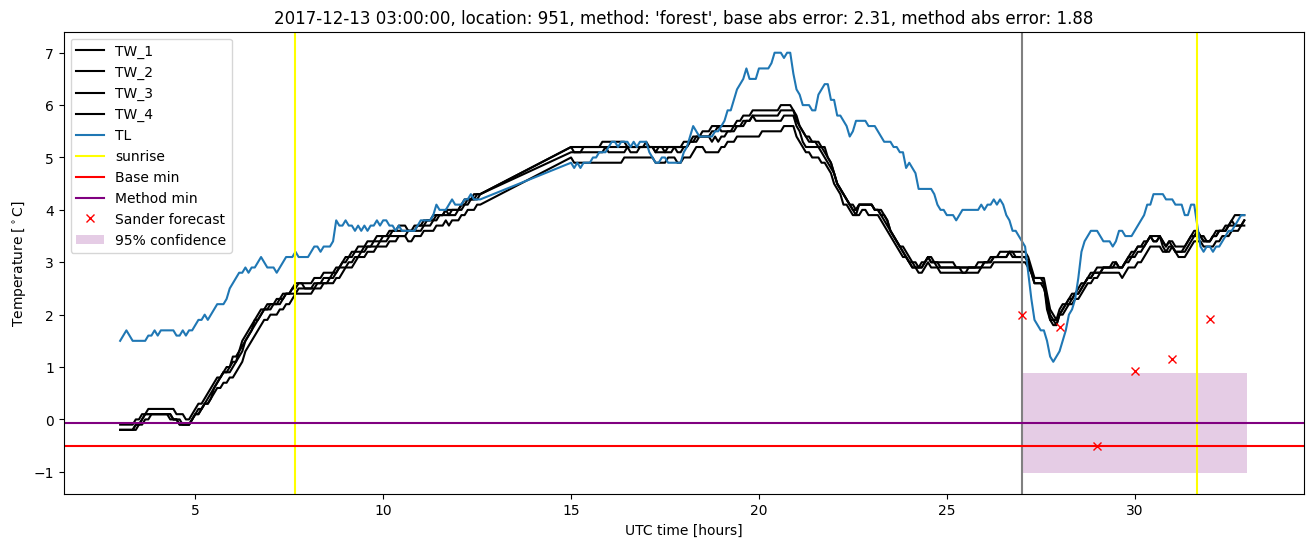
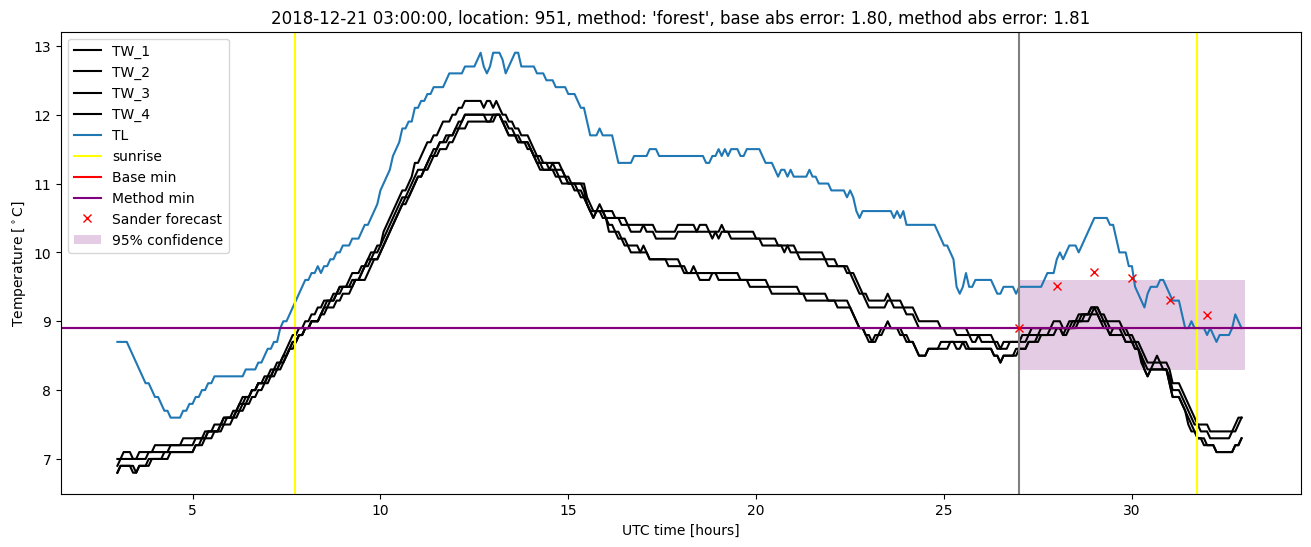
Random forest plots
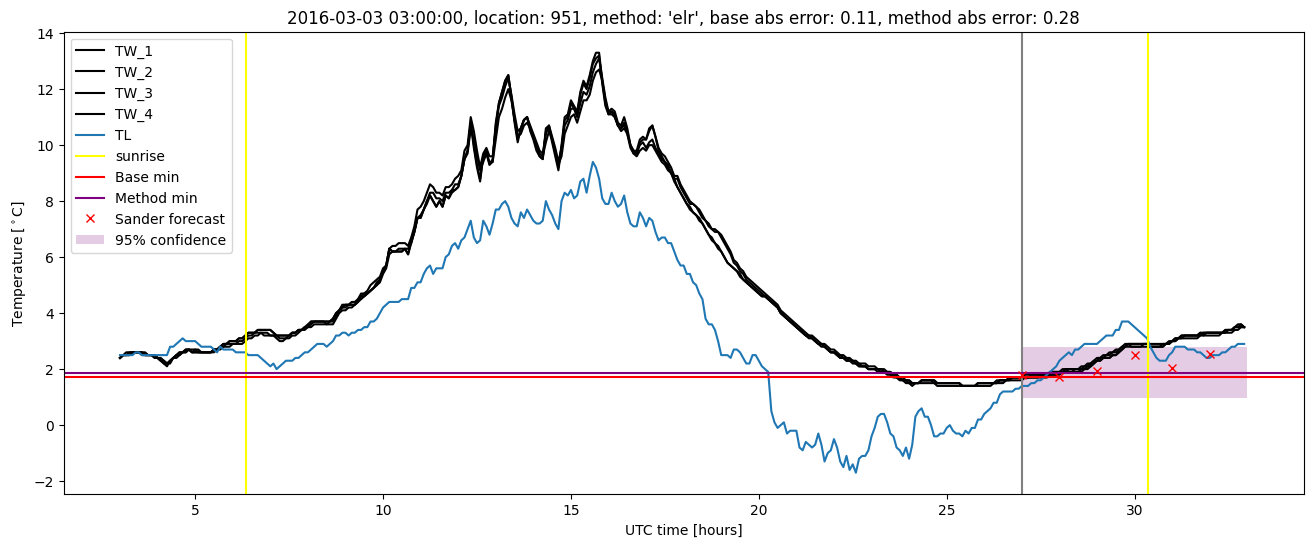
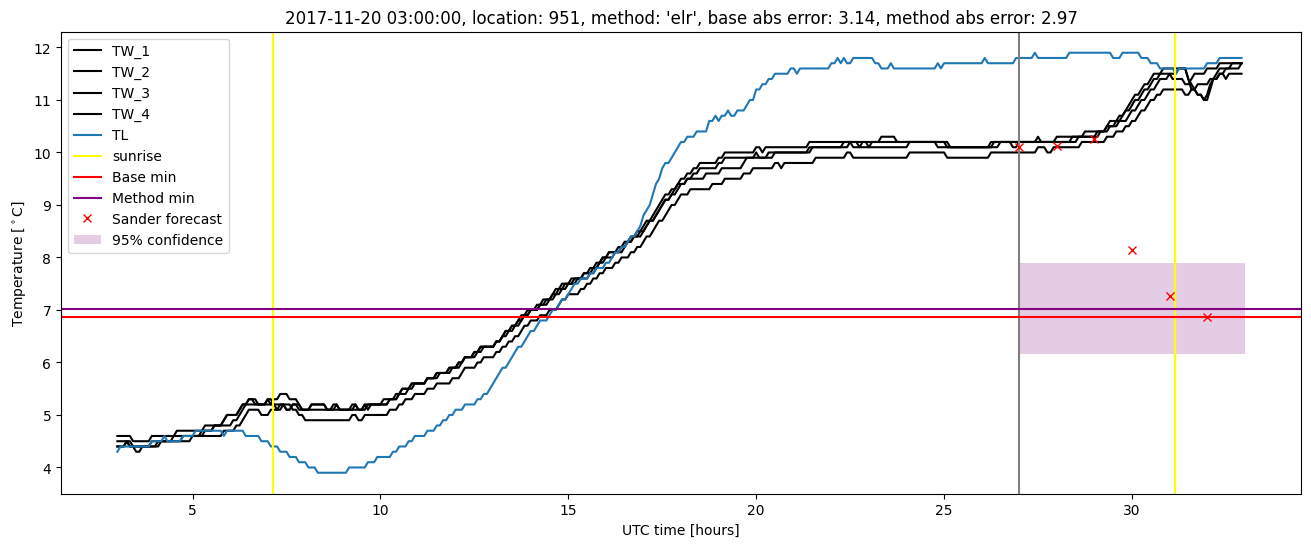
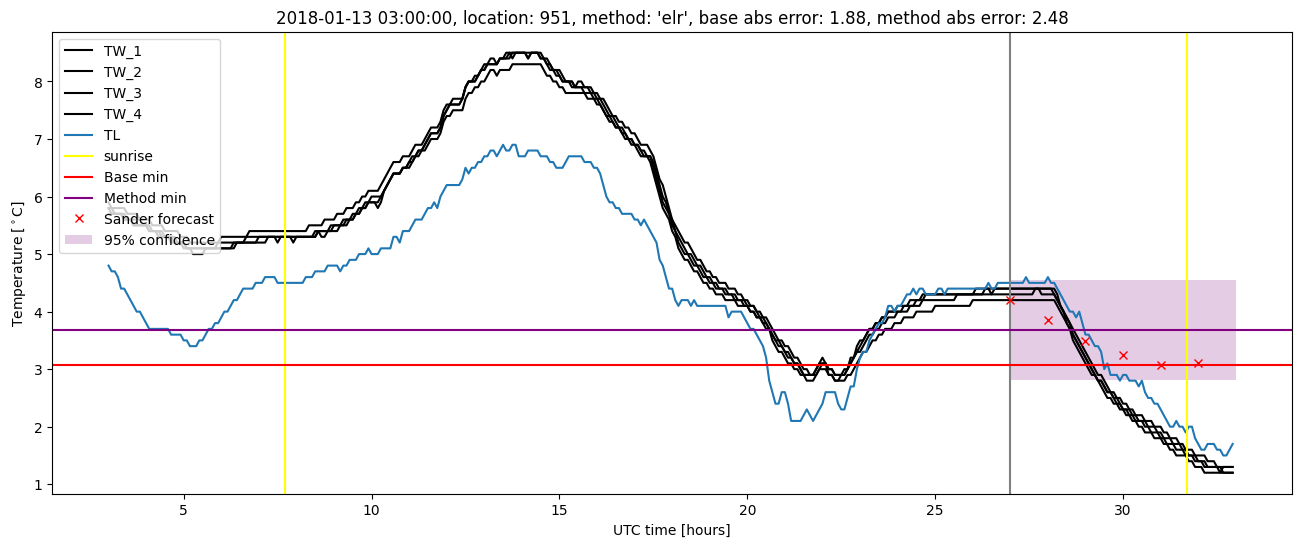
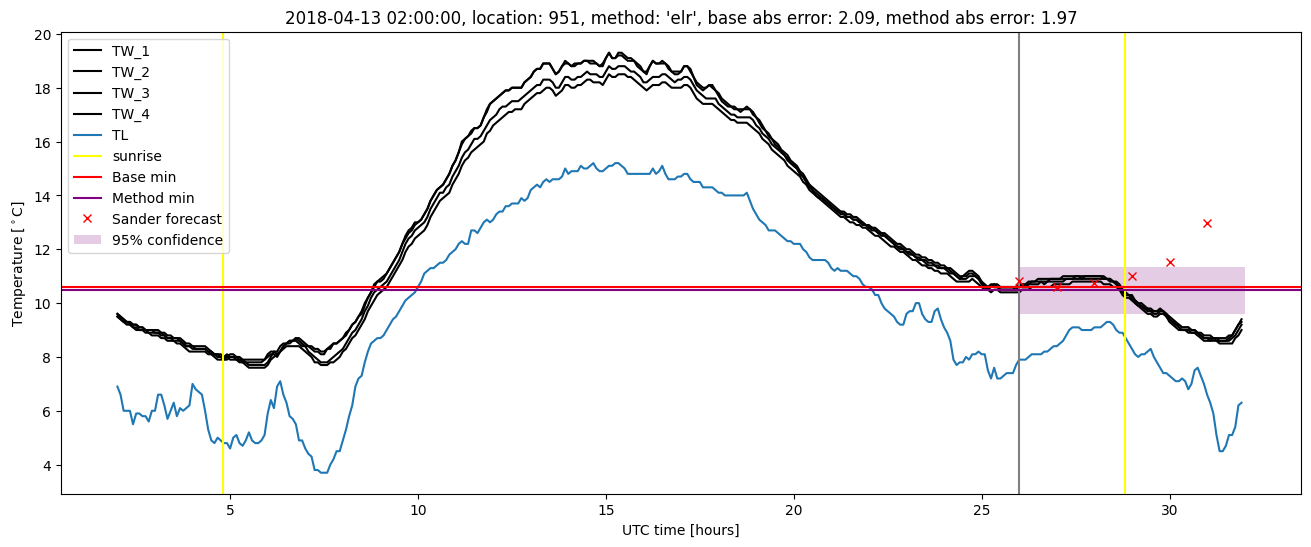
Extended logistic regression results
| names |
period |
power |
significance |
meanSquareError |
absError |
maxError |
CRPS |
IGN |
| baseline |
winter 2016 |
0.979 |
0.053 |
0.323 |
0.422 |
1.768 |
NaN |
NaN |
| elr |
winter 2016 |
0.995 |
0.158 |
0.261 |
0.404 |
1.886 |
0.491 |
3.356 |
| baseline |
winter 2017 |
0.976 |
0.071 |
0.369 |
0.461 |
1.870 |
NaN |
NaN |
| elr |
winter 2017 |
0.976 |
0.107 |
0.318 |
0.434 |
1.786 |
0.483 |
3.261 |
| baseline |
winter 2018 |
0.974 |
0.179 |
0.461 |
0.493 |
3.142 |
NaN |
NaN |
| elr |
winter 2018 |
0.981 |
0.143 |
0.382 |
0.455 |
2.973 |
0.489 |
3.743 |
| baseline |
winter 2019 |
0.981 |
0.000e+00 |
0.393 |
0.481 |
2.146 |
NaN |
NaN |
| elr |
winter 2019 |
0.974 |
0.077 |
0.322 |
0.445 |
1.775 |
0.479 |
3.423 |
| baseline |
all |
0.978 |
0.091 |
0.385 |
0.463 |
3.142 |
NaN |
NaN |
| elr |
all |
0.982 |
0.125 |
0.318 |
0.433 |
2.973 |
0.485 |
3.451 |
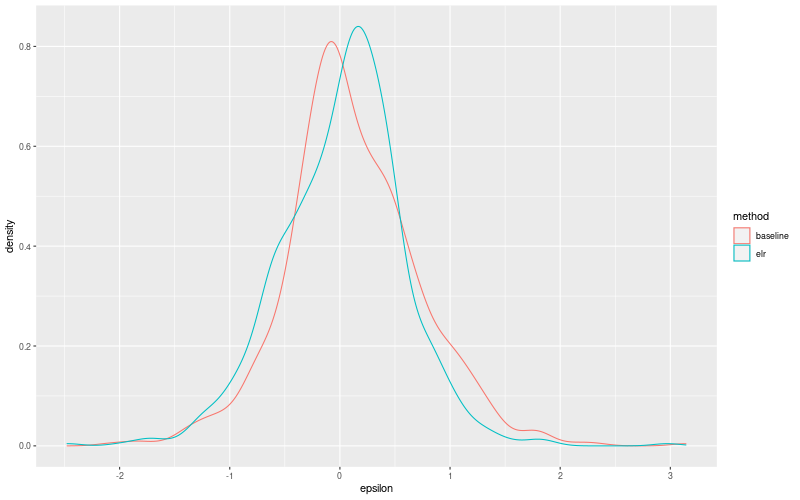
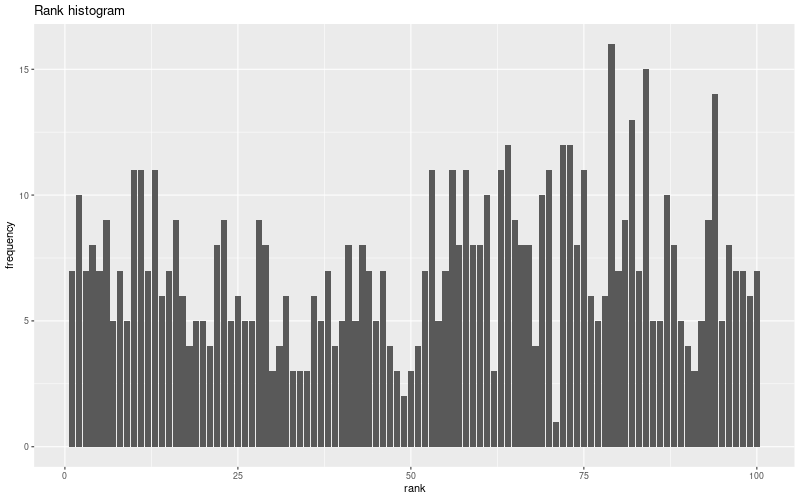
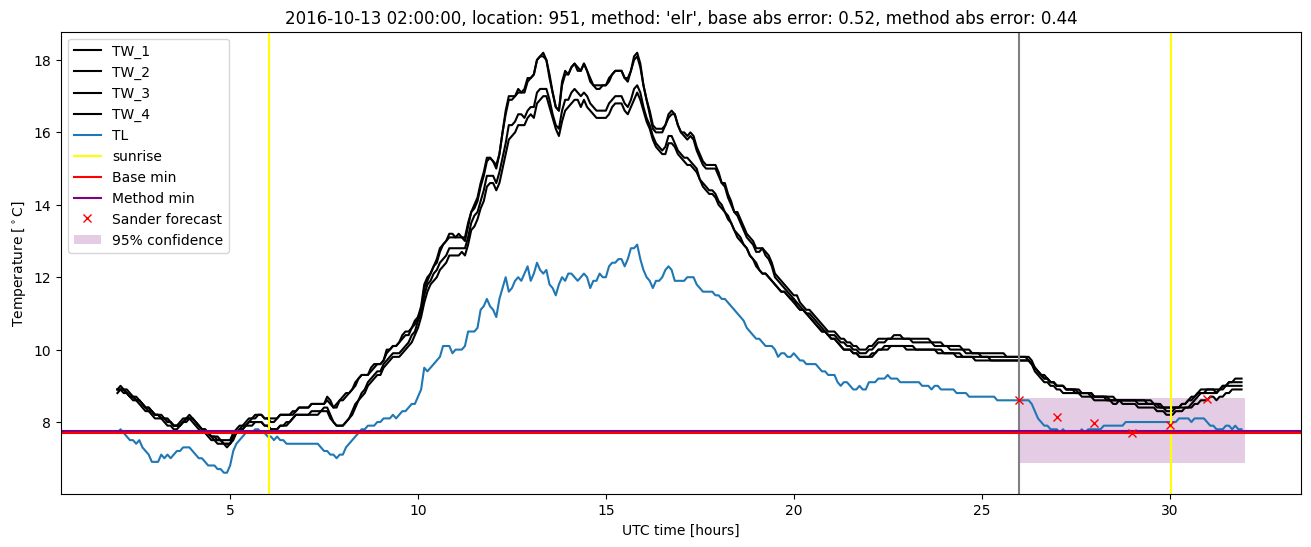
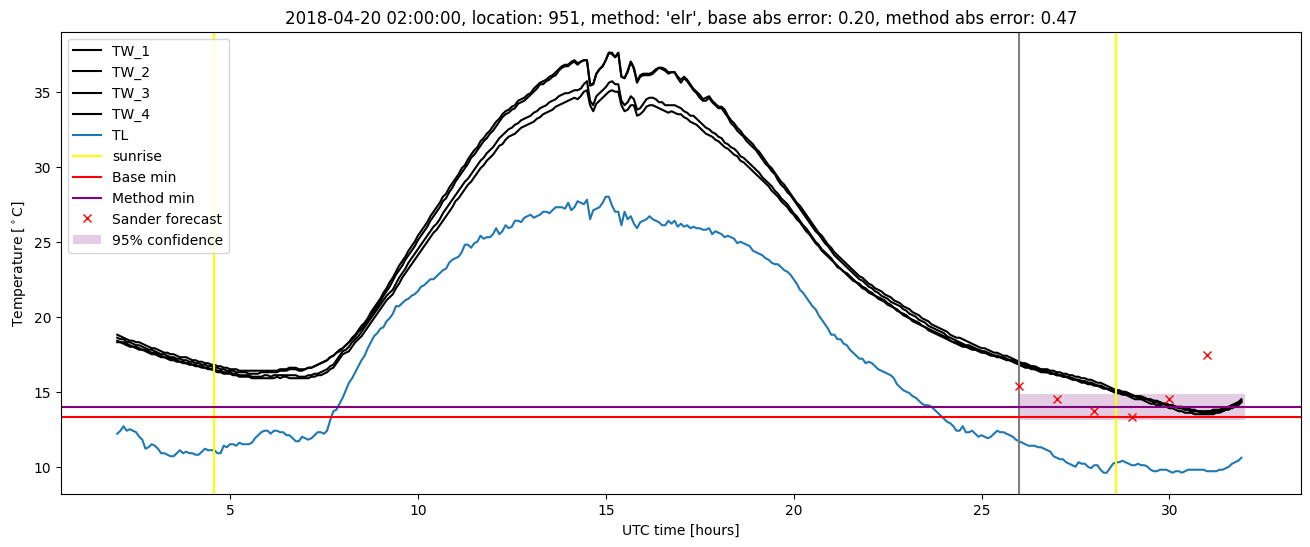
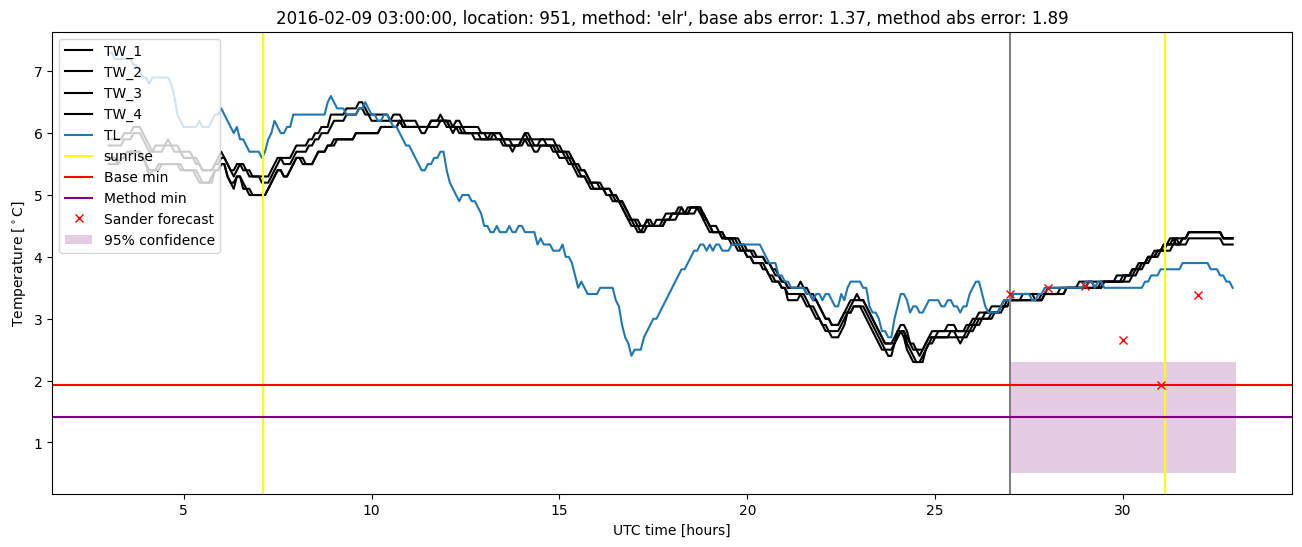
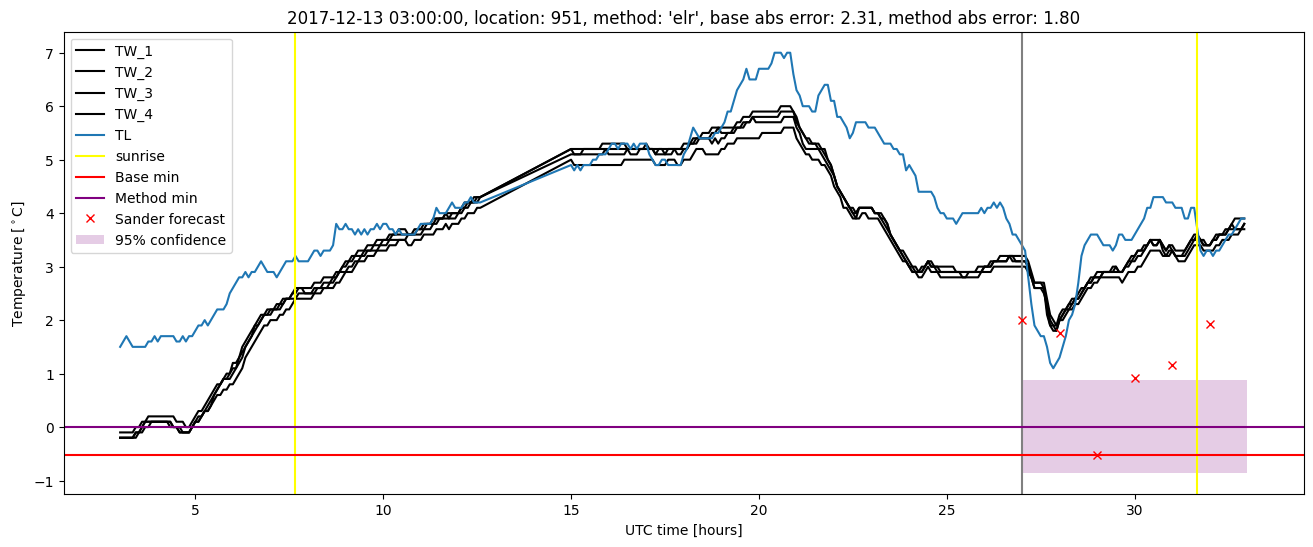
Extended logistic regression plots