GMS location: 924
Random forest results
| names |
period |
power |
significance |
meanSquareError |
absError |
maxError |
CRPS |
IGN |
| baseline |
winter 2016 |
0.982 |
0.000e+00 |
0.373 |
0.454 |
2.098 |
NaN |
NaN |
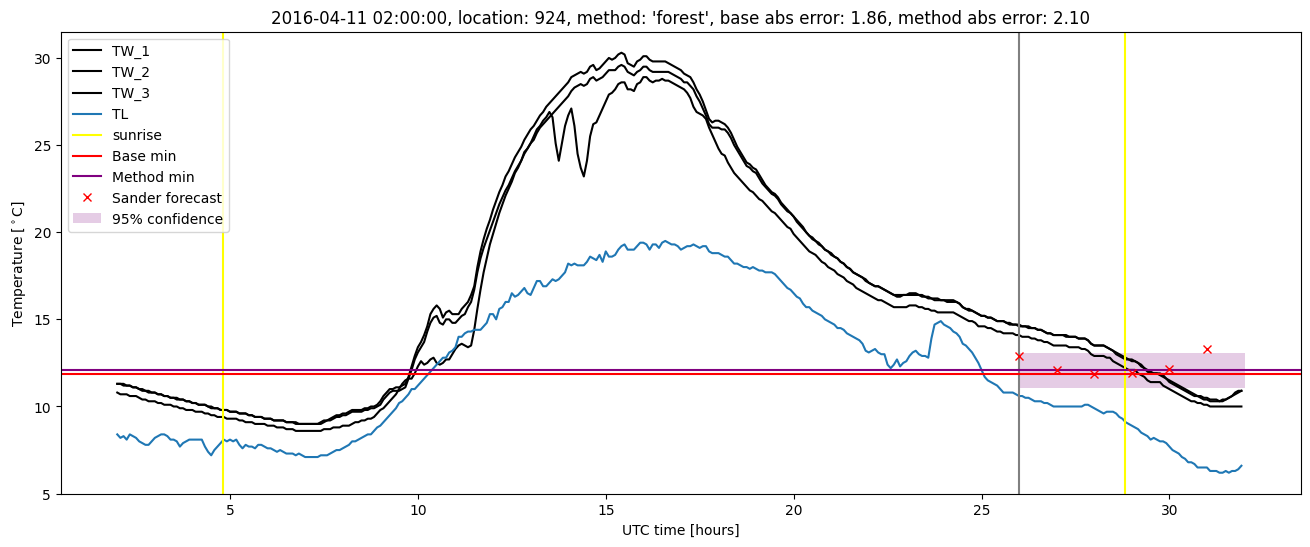
| forest |
winter 2016 |
0.994 |
0.000e+00 |
0.277 |
0.381 |
2.104 |
0.467 |
6.474 |
| baseline |
winter 2017 |
0.990 |
0.044 |
0.390 |
0.432 |
2.300 |
NaN |
NaN |
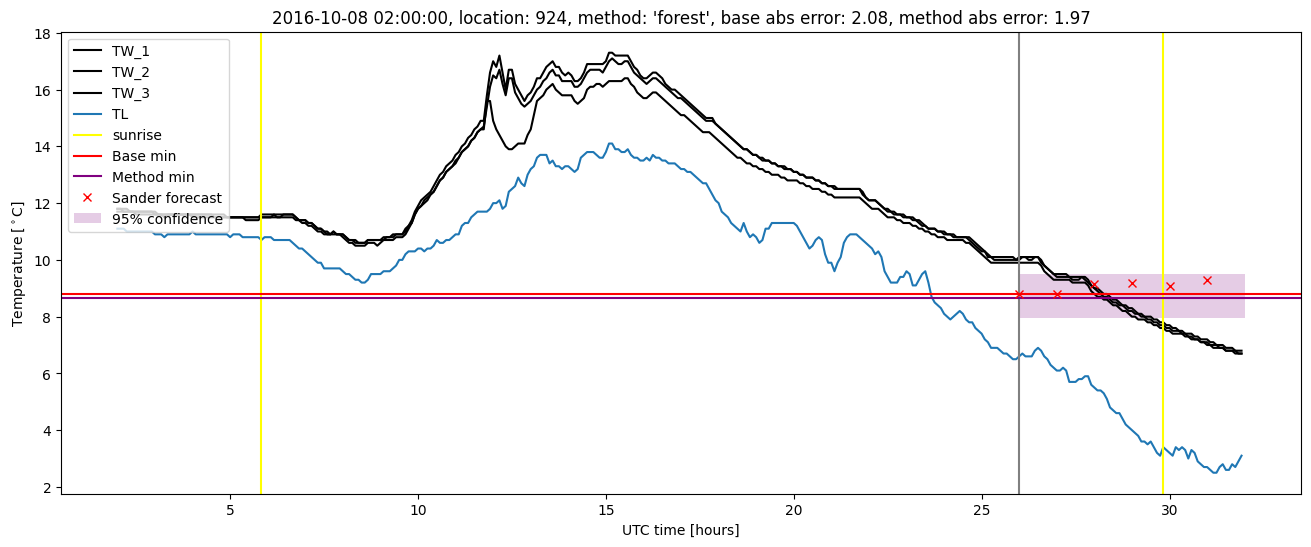
| forest |
winter 2017 |
0.990 |
0.067 |
0.265 |
0.357 |
1.974 |
0.446 |
4.818 |
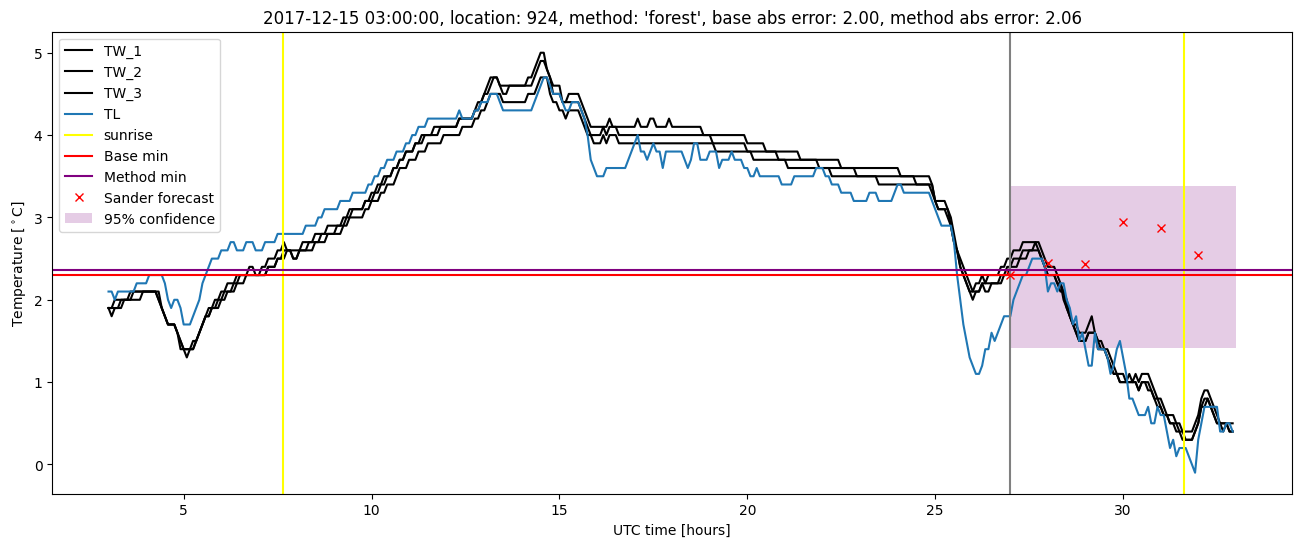
| baseline |
winter 2018 |
0.979 |
0.086 |
0.303 |
0.416 |
2.000 |
NaN |
NaN |
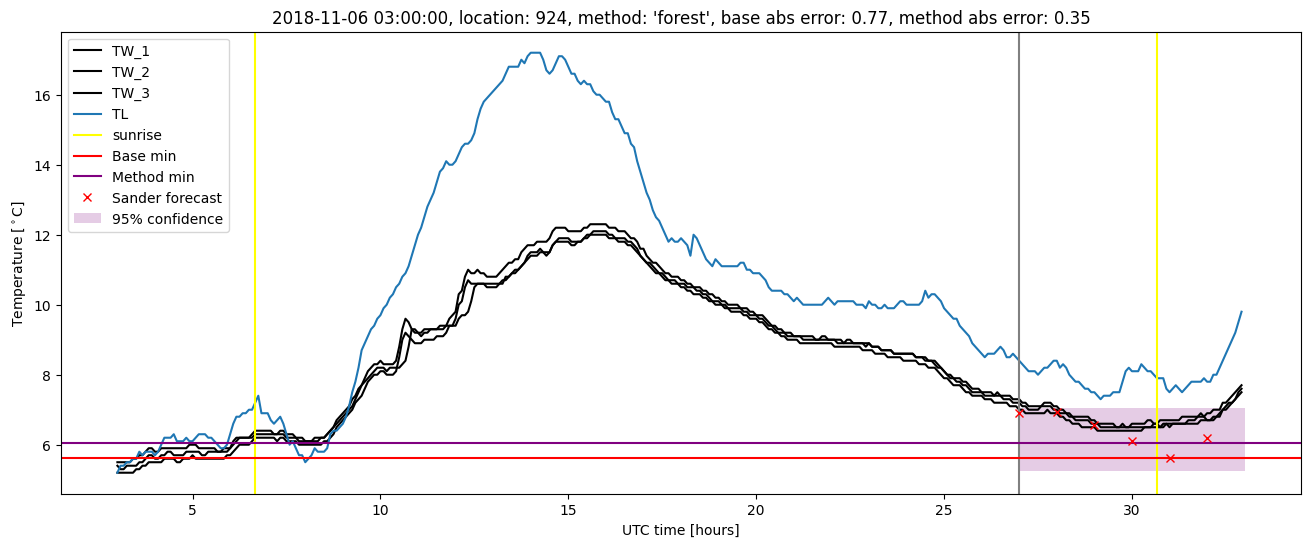
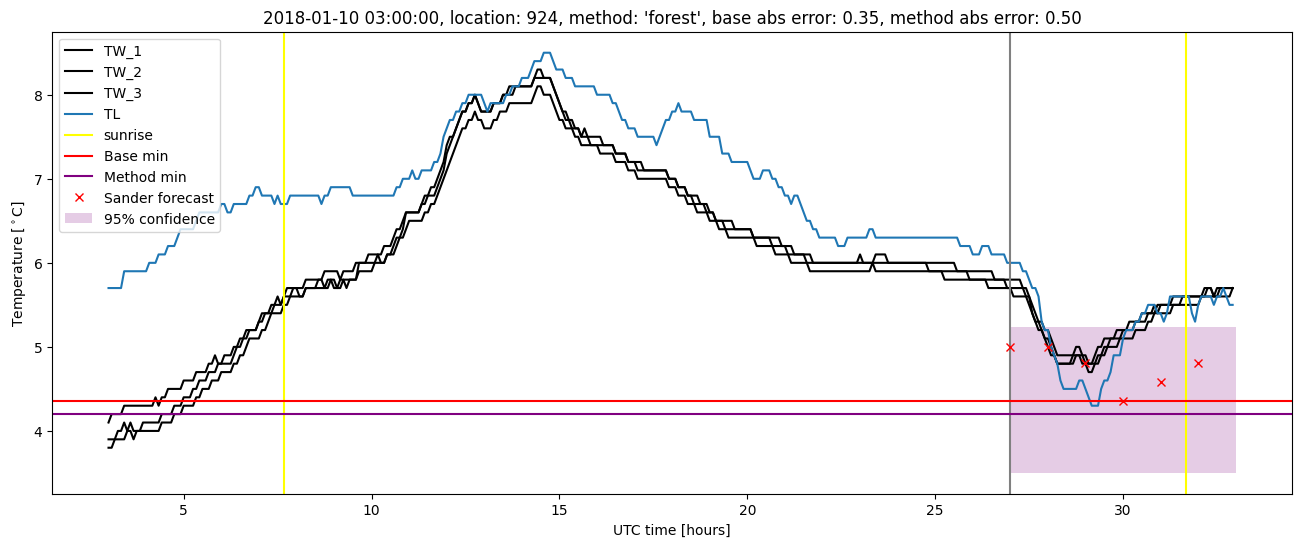
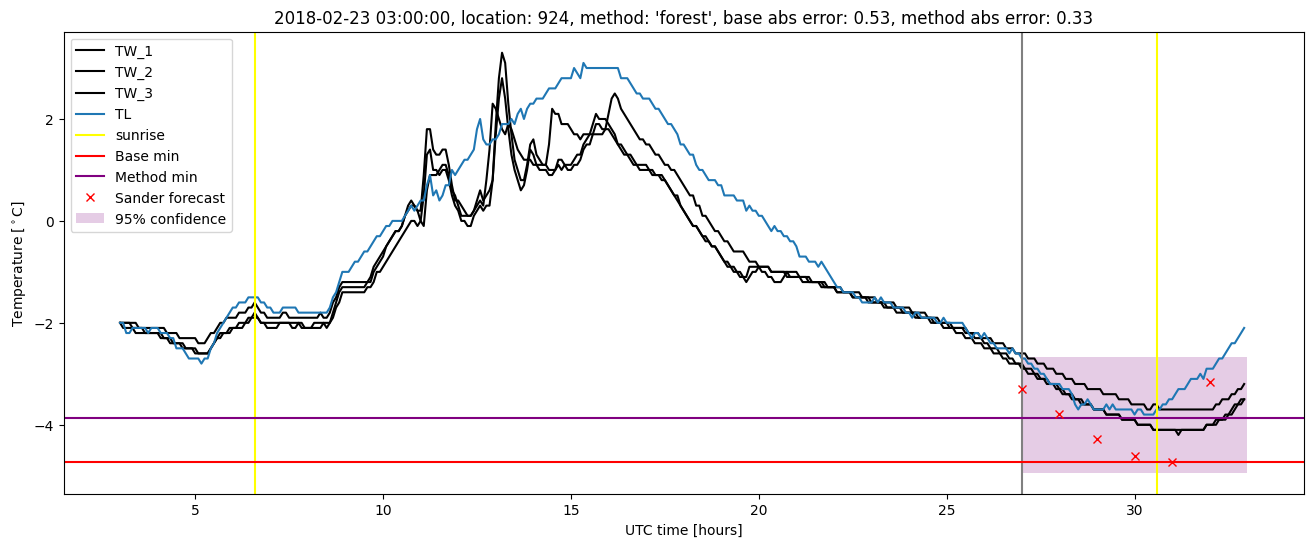
| forest |
winter 2018 |
0.986 |
0.086 |
0.229 |
0.353 |
2.057 |
0.461 |
3.616 |
| baseline |
winter 2019 |
0.986 |
0.048 |
0.276 |
0.386 |
2.183 |
NaN |
NaN |
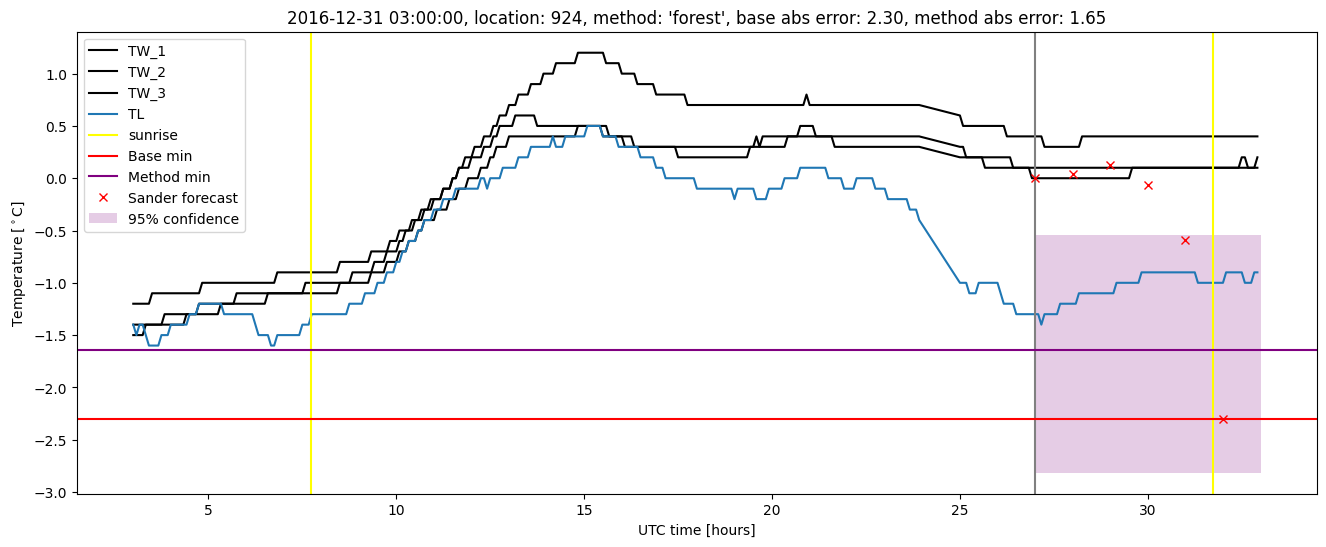
| forest |
winter 2019 |
0.986 |
0.095 |
0.164 |
0.299 |
1.600 |
0.443 |
3.728 |
| baseline |
all |
0.984 |
0.047 |
0.336 |
0.423 |
2.300 |
NaN |
NaN |
| forest |
all |
0.989 |
0.063 |
0.235 |
0.349 |
2.104 |
0.455 |
4.708 |
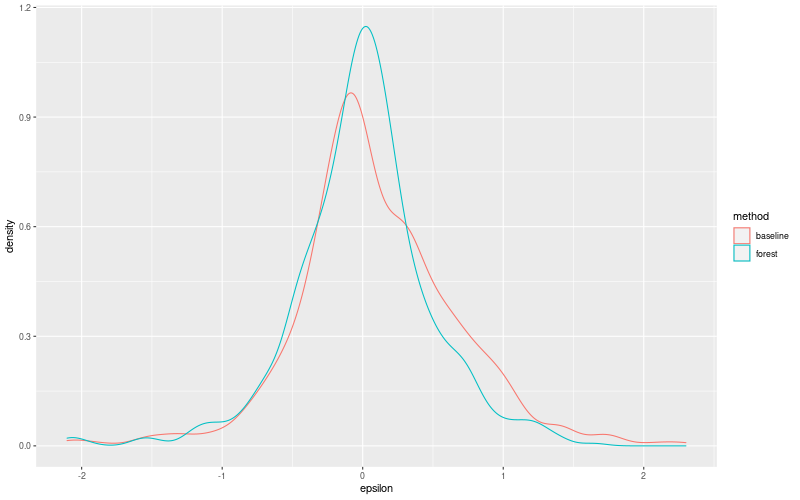
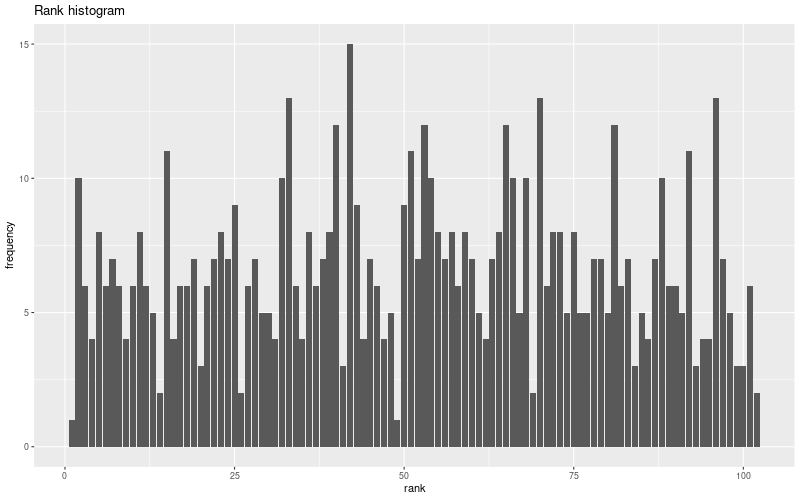
Random forest plots

Extended logistic regression results
| names |
period |
power |
significance |
meanSquareError |
absError |
maxError |
CRPS |
IGN |
| baseline |
winter 2016 |
0.982 |
0.000e+00 |
0.373 |
0.454 |
2.098 |
NaN |
NaN |
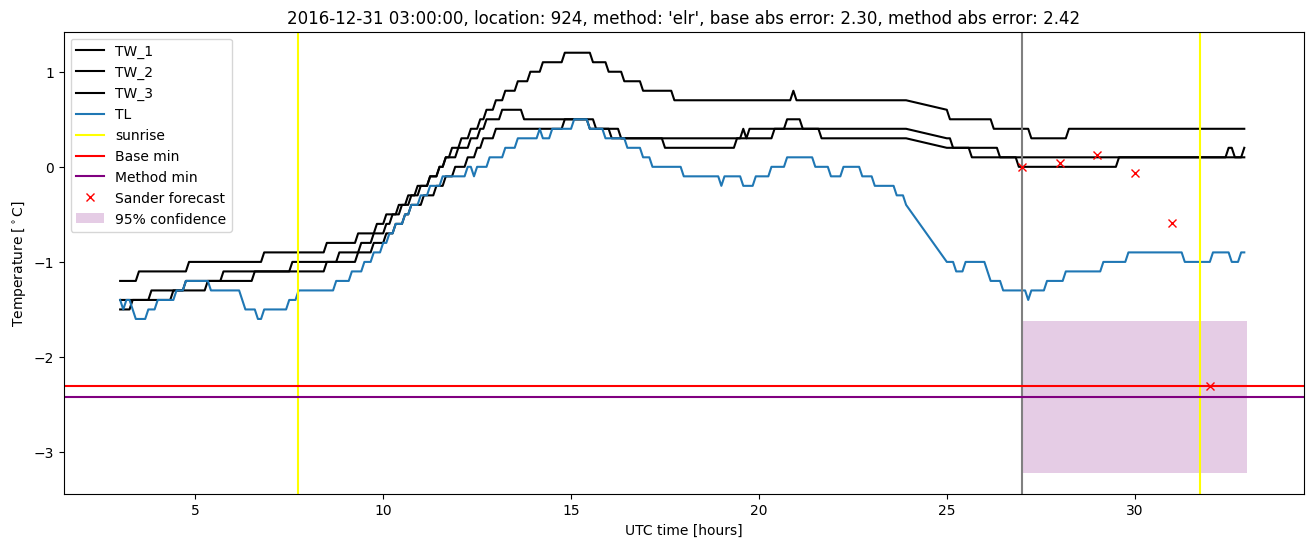
| elr |
winter 2016 |
1.000 |
0.000e+00 |
0.319 |
0.438 |
2.072 |
0.546 |
6.562 |
| baseline |
winter 2017 |
0.990 |
0.044 |
0.390 |
0.432 |
2.300 |
NaN |
NaN |
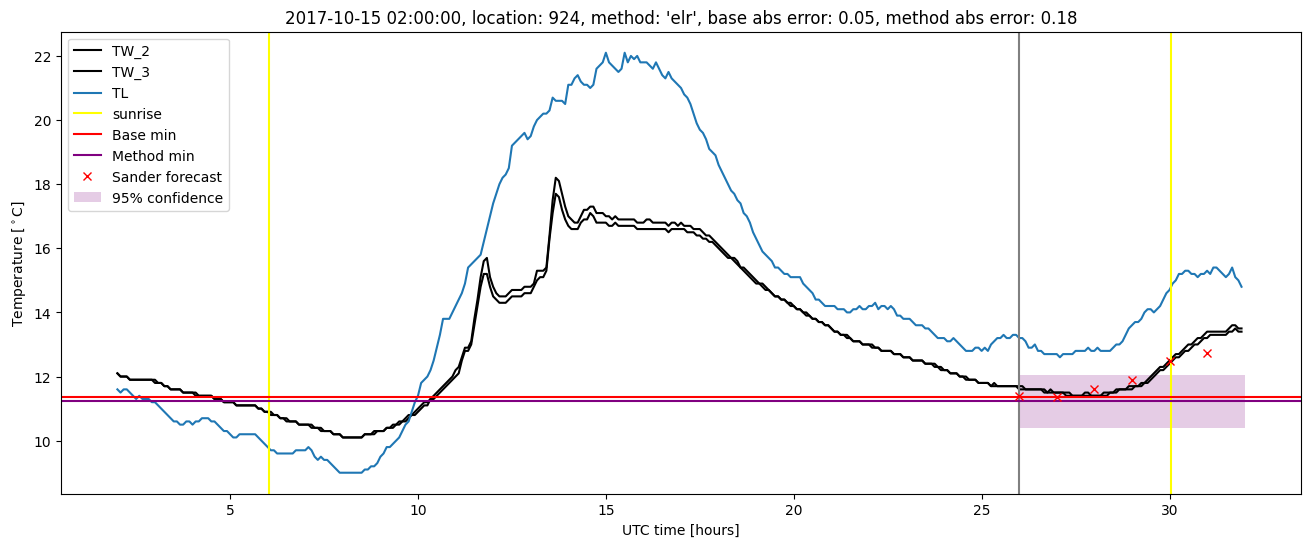
| elr |
winter 2017 |
0.990 |
0.067 |
0.303 |
0.373 |
2.417 |
0.493 |
5.031 |
| baseline |
winter 2018 |
0.979 |
0.086 |
0.303 |
0.416 |
2.000 |
NaN |
NaN |
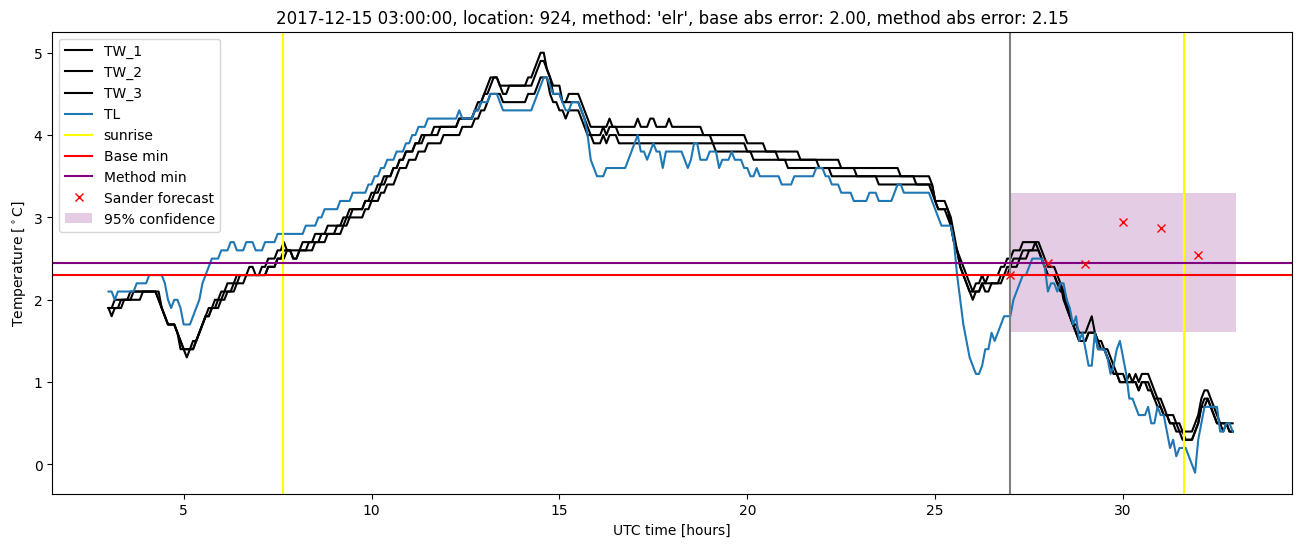
| elr |
winter 2018 |
0.986 |
0.086 |
0.290 |
0.420 |
2.151 |
0.552 |
5.175 |
| baseline |
winter 2019 |
0.986 |
0.048 |
0.276 |
0.386 |
2.183 |
NaN |
NaN |
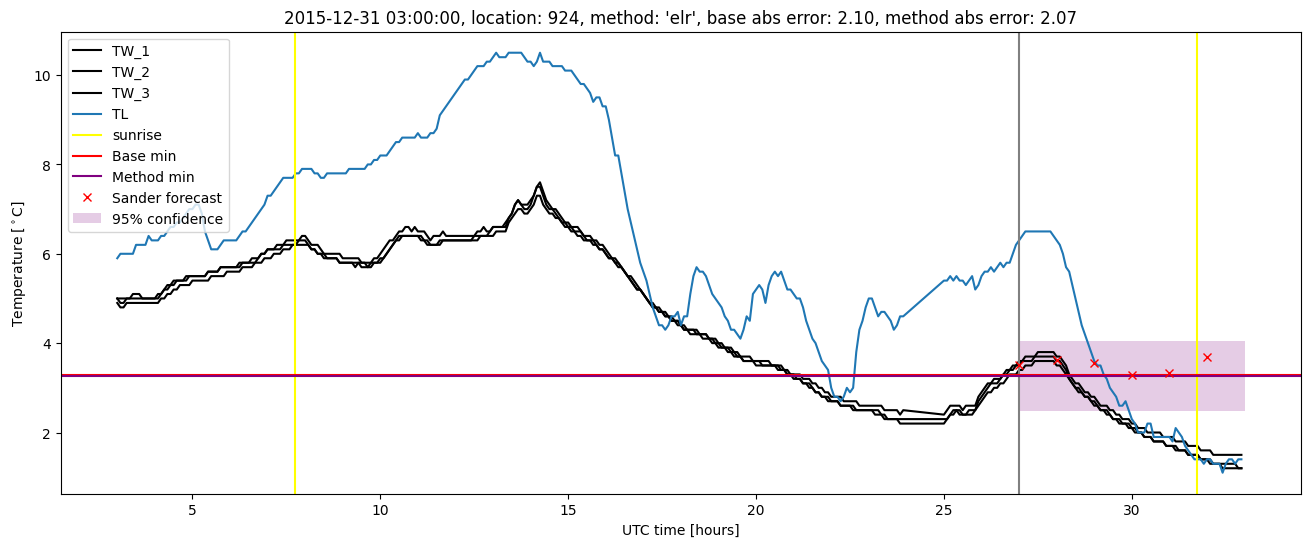
| elr |
winter 2019 |
0.986 |
0.095 |
0.224 |
0.370 |
1.629 |
0.501 |
3.639 |
| baseline |
all |
0.984 |
0.047 |
0.336 |
0.423 |
2.300 |
NaN |
NaN |
| elr |
all |
0.991 |
0.063 |
0.285 |
0.403 |
2.417 |
0.525 |
5.163 |
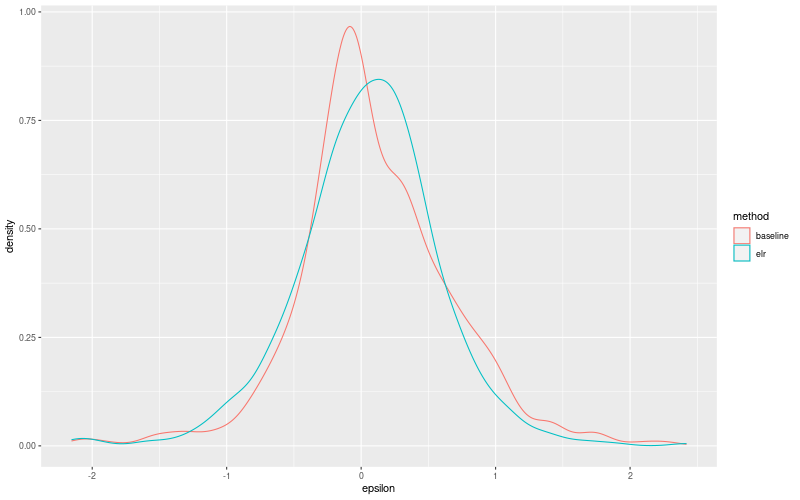
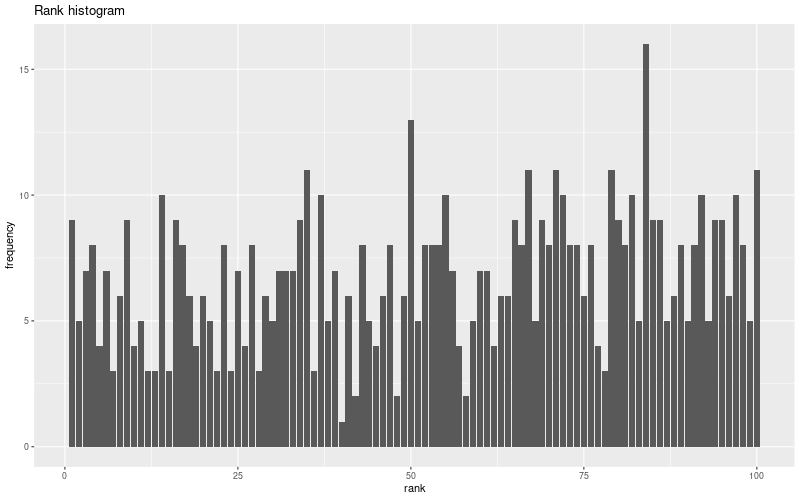
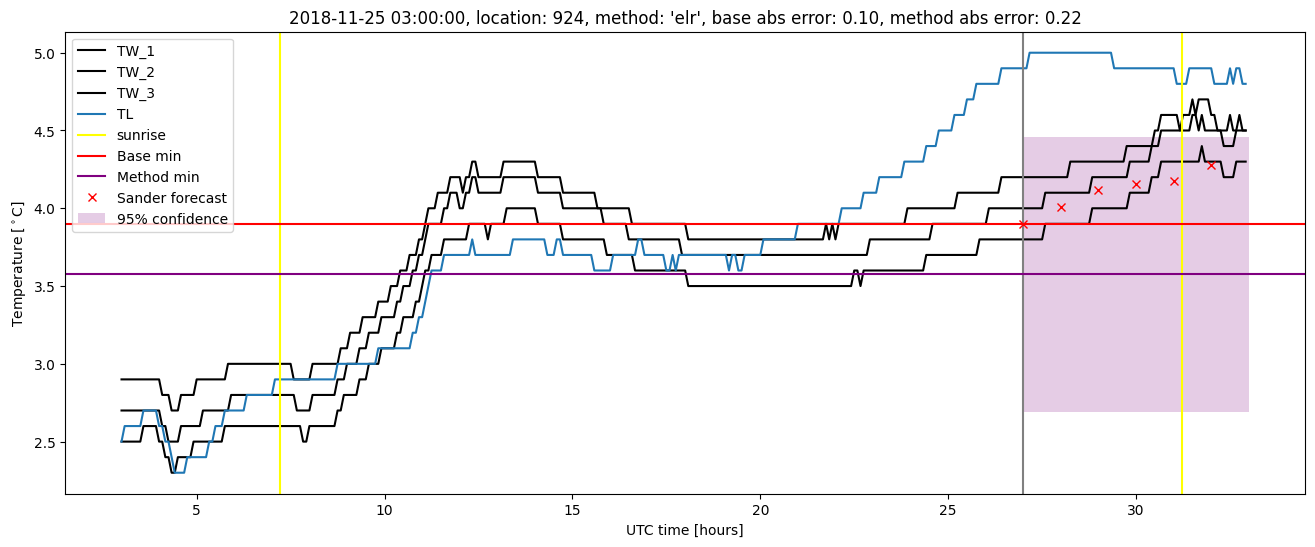
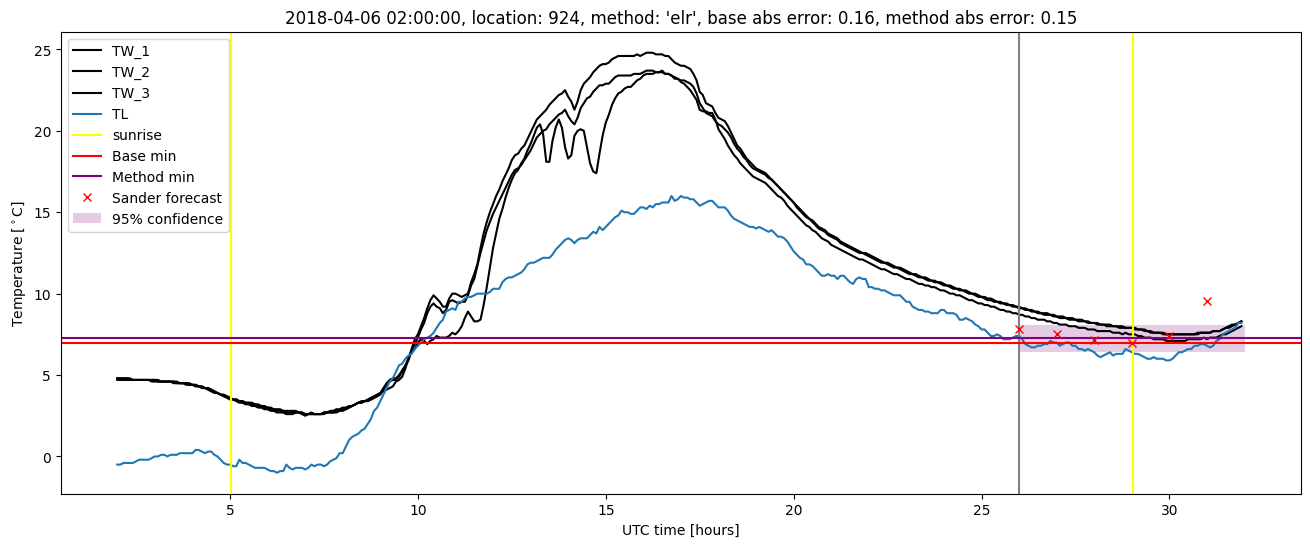
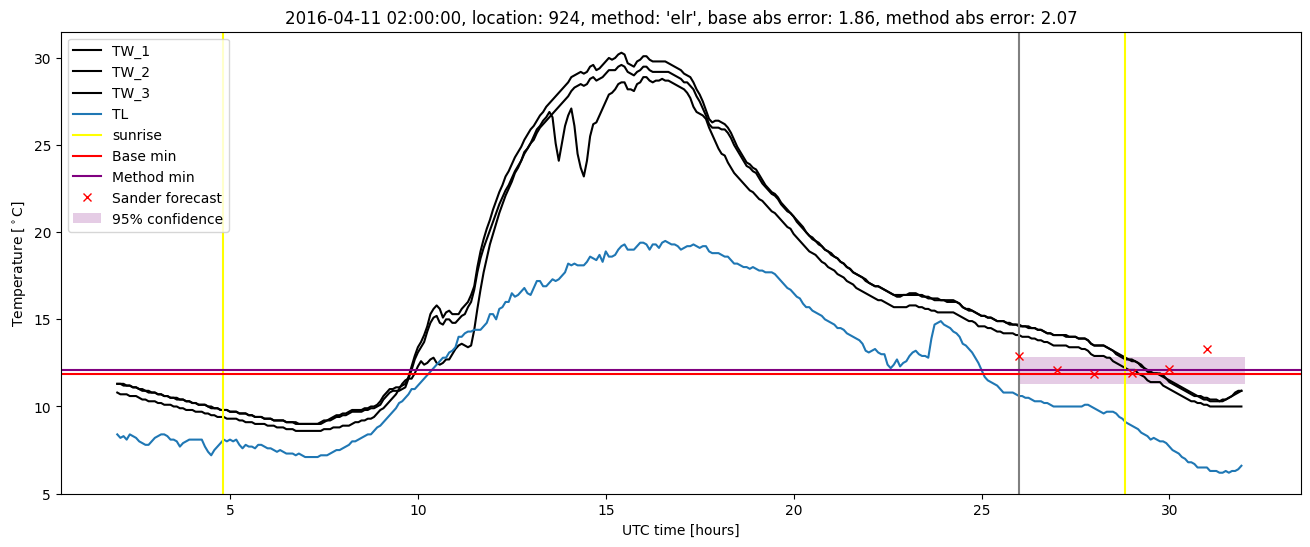
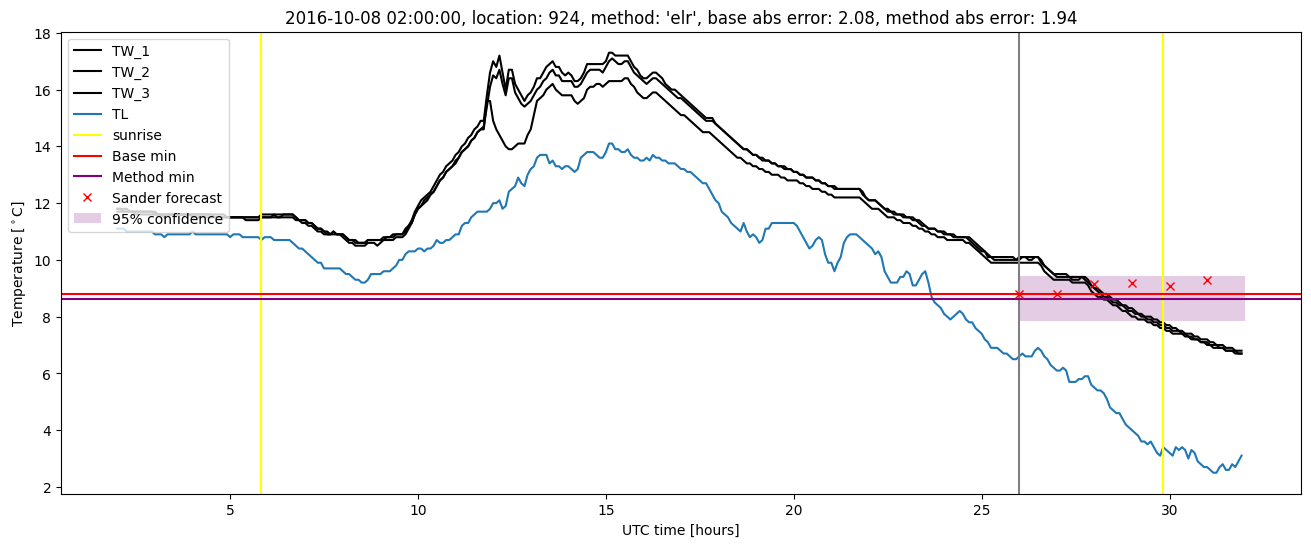
Extended logistic regression plots