GMS location: 923
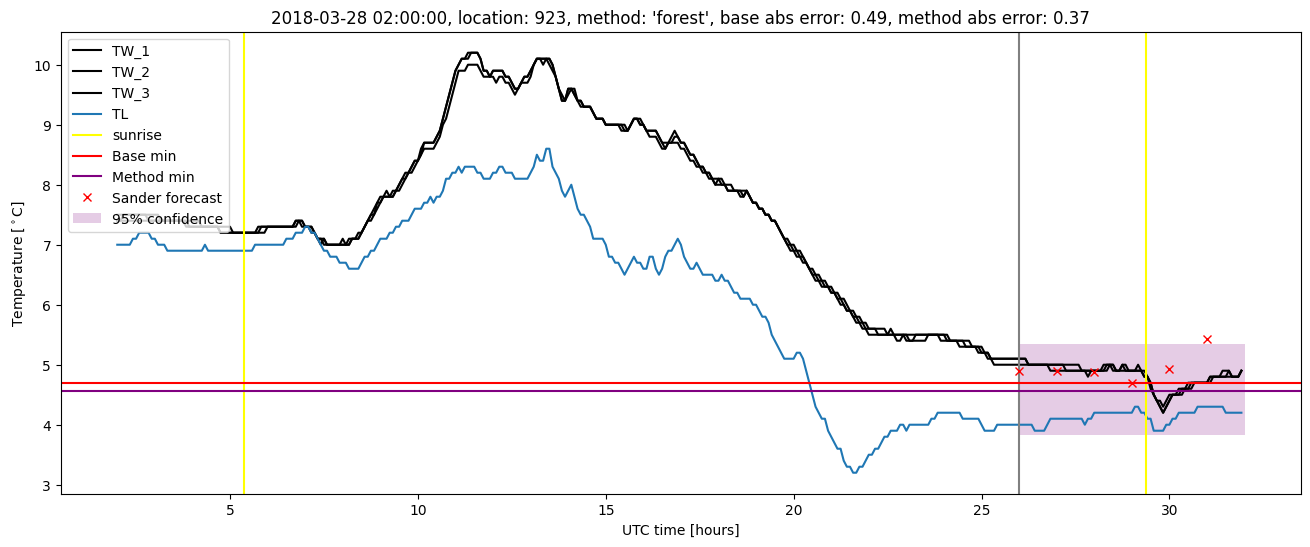
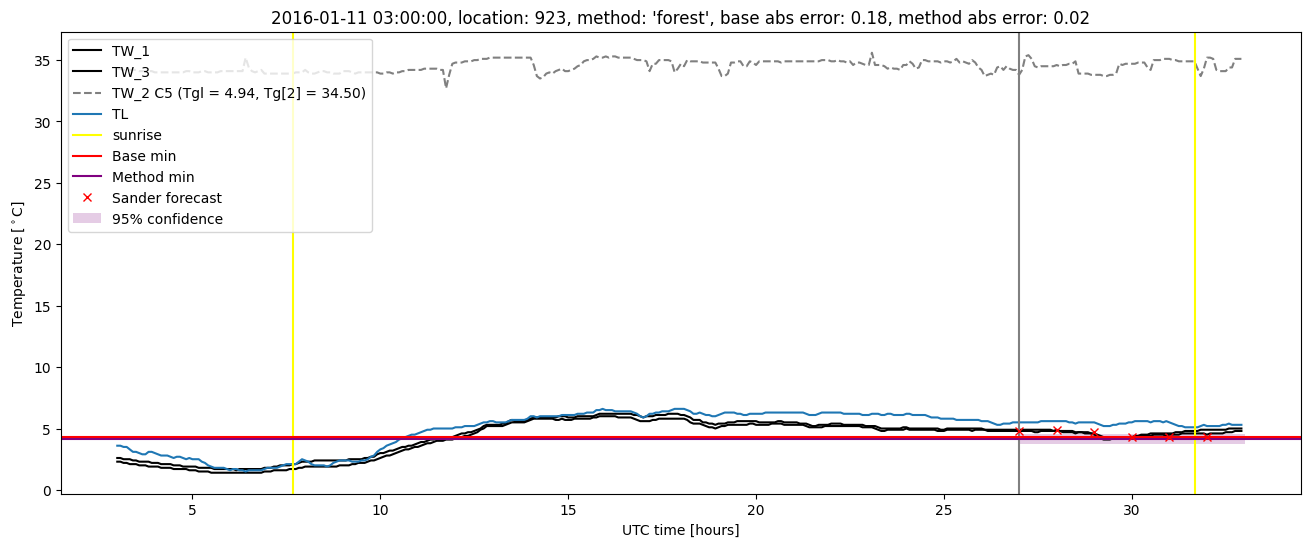
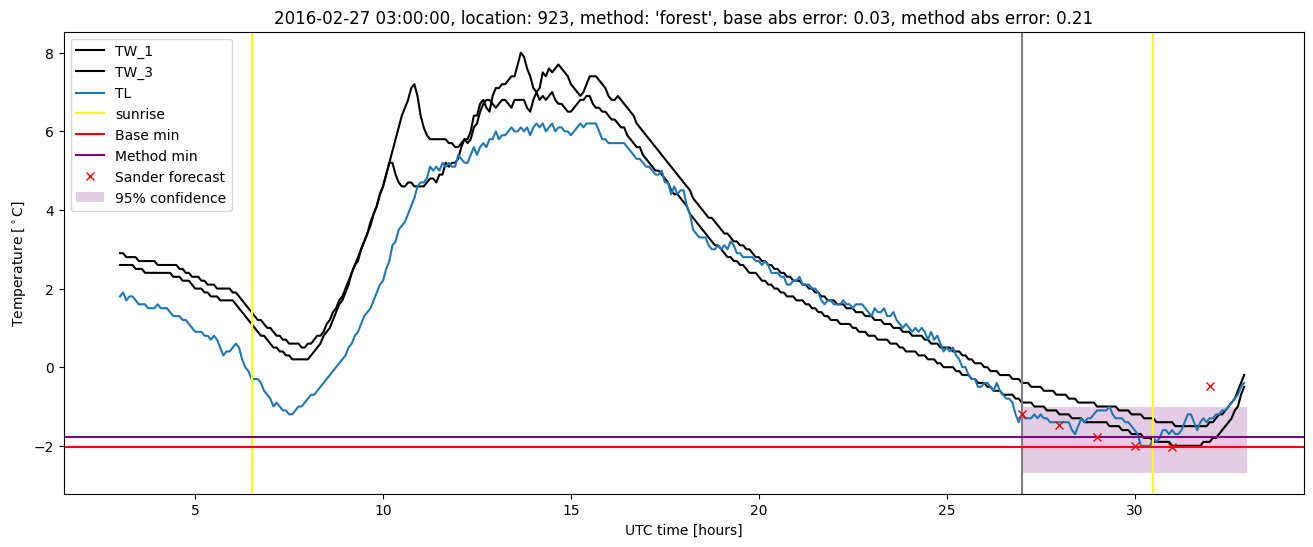
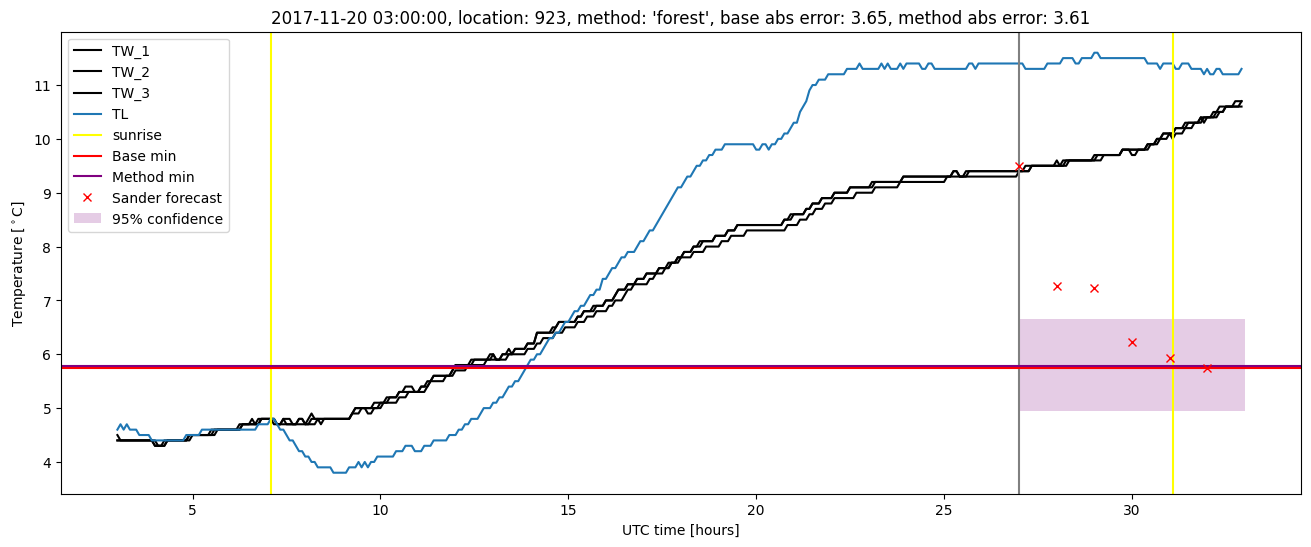
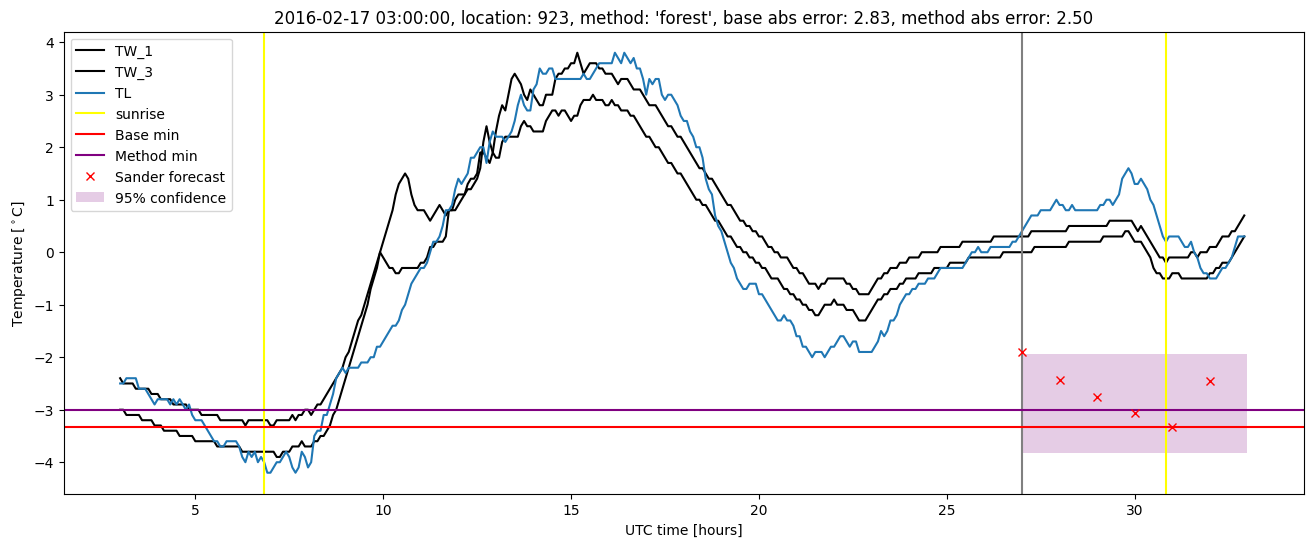
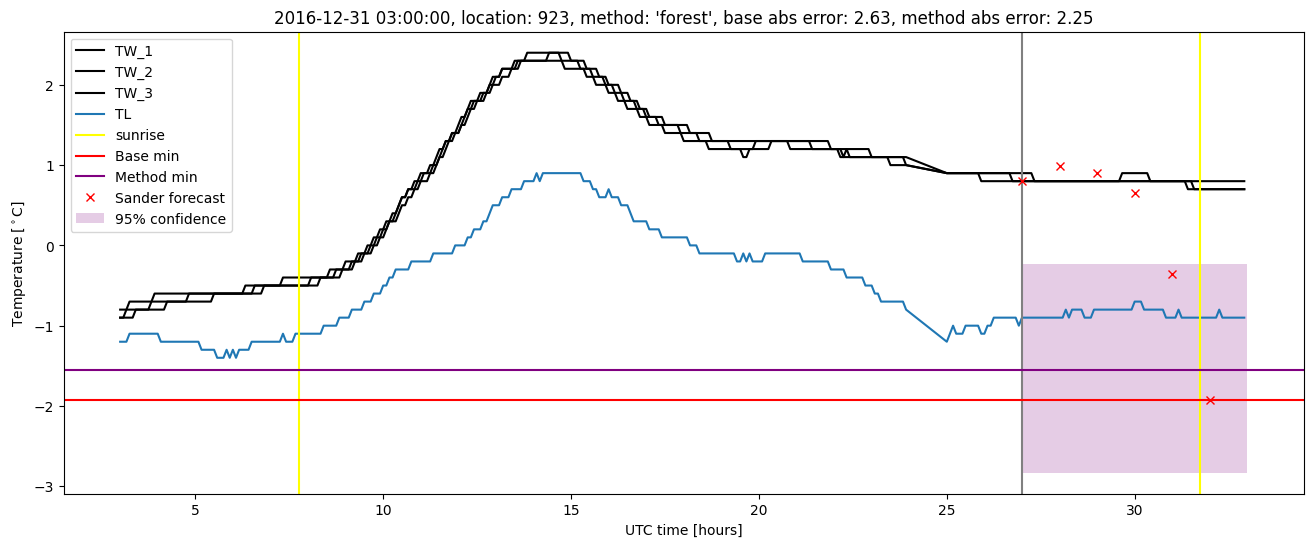
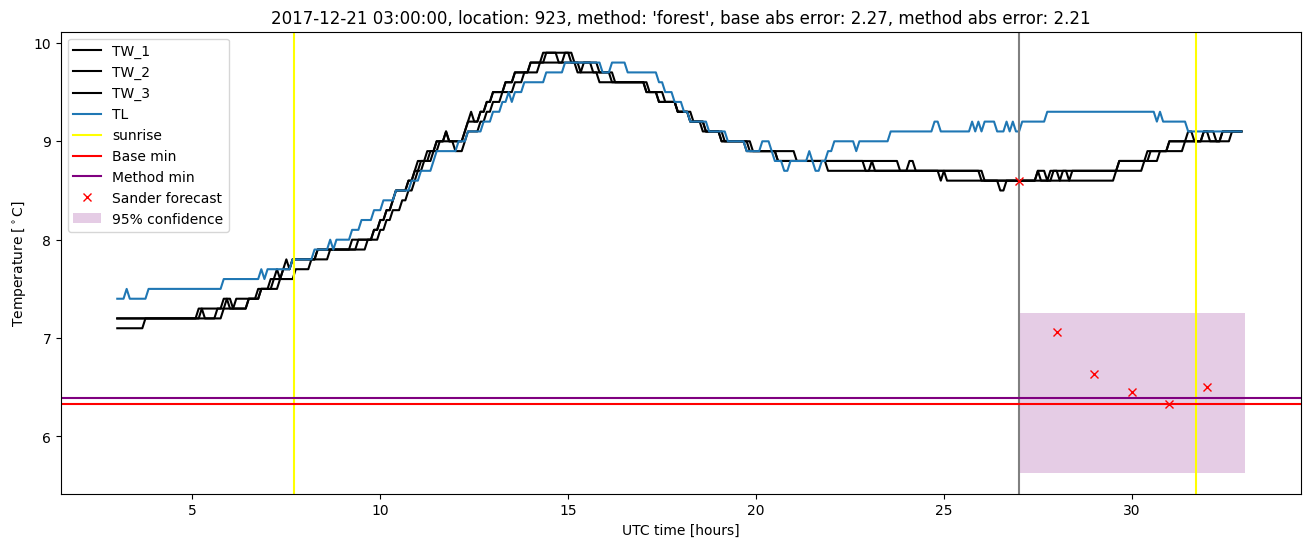
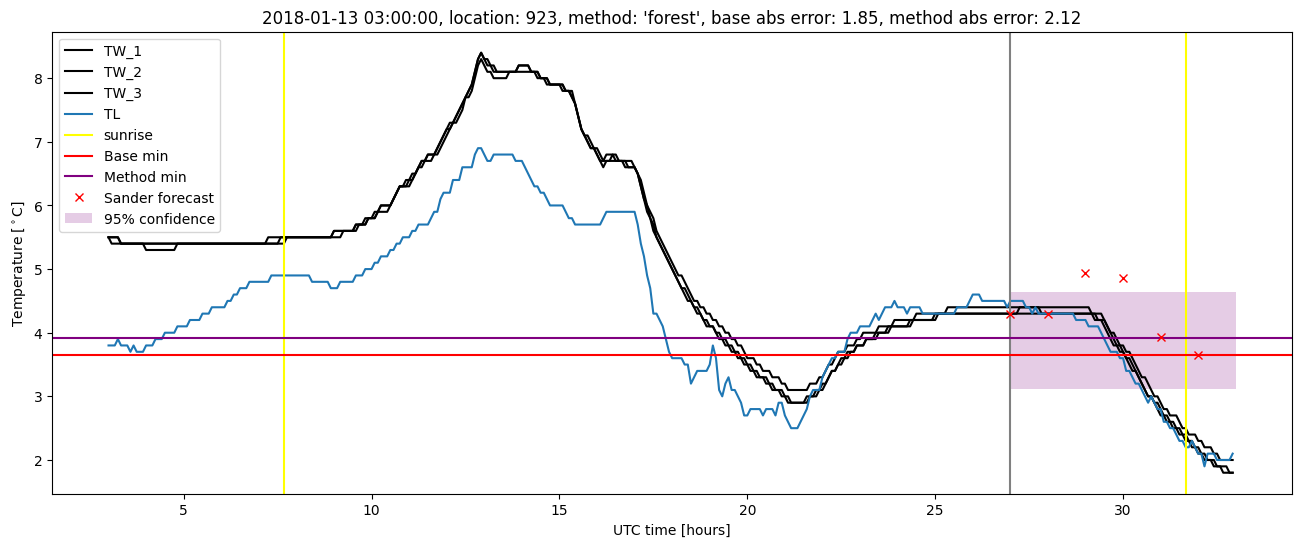
Random forest results
| names |
period |
power |
significance |
meanSquareError |
absError |
maxError |
CRPS |
IGN |
| baseline |
winter 2016 |
0.994 |
0.000e+00 |
0.388 |
0.447 |
2.833 |
NaN |
NaN |
| forest |
winter 2016 |
1.000 |
0.056 |
0.315 |
0.398 |
2.498 |
0.444 |
3.684 |
| baseline |
winter 2017 |
0.974 |
0.108 |
0.360 |
0.428 |
2.626 |
NaN |
NaN |
| forest |
winter 2017 |
0.983 |
0.135 |
0.251 |
0.340 |
2.248 |
0.433 |
2.776 |
| baseline |
winter 2018 |
0.987 |
0.129 |
0.474 |
0.483 |
3.654 |
NaN |
NaN |
| forest |
winter 2018 |
0.993 |
0.129 |
0.413 |
0.433 |
3.615 |
0.433 |
3.524 |
| baseline |
winter 2019 |
0.993 |
0.000e+00 |
0.304 |
0.406 |
2.263 |
NaN |
NaN |
| forest |
winter 2019 |
0.993 |
0.167 |
0.177 |
0.309 |
1.538 |
0.413 |
1.983 |
| baseline |
all |
0.988 |
0.082 |
0.385 |
0.443 |
3.654 |
NaN |
NaN |
| forest |
all |
0.993 |
0.122 |
0.294 |
0.373 |
3.615 |
0.431 |
3.035 |
Random forest plots
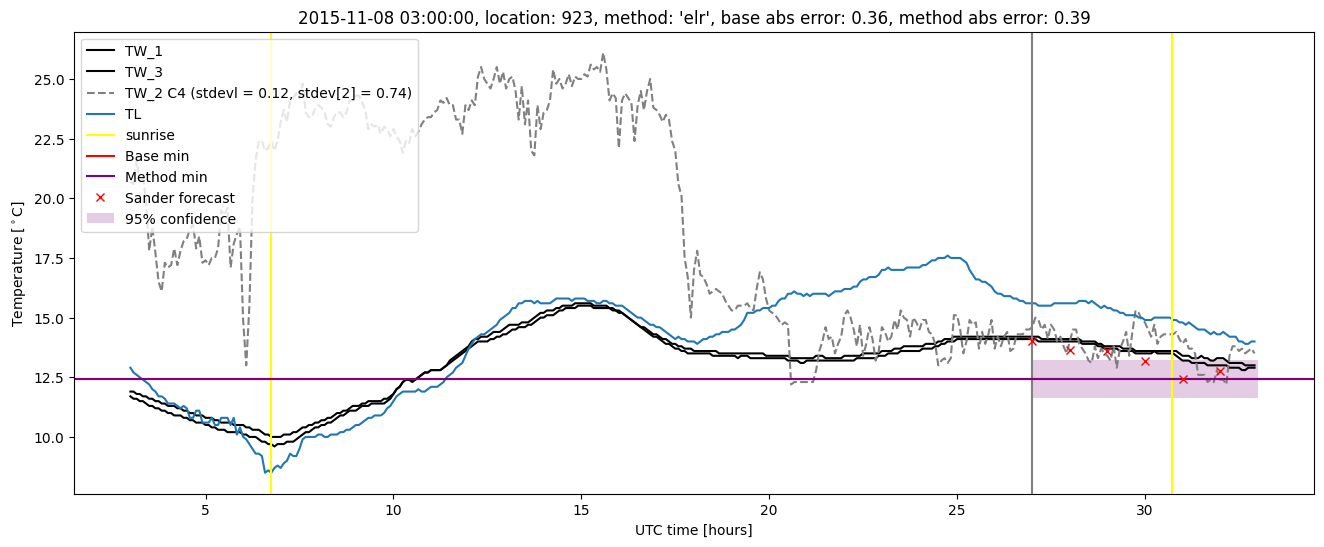
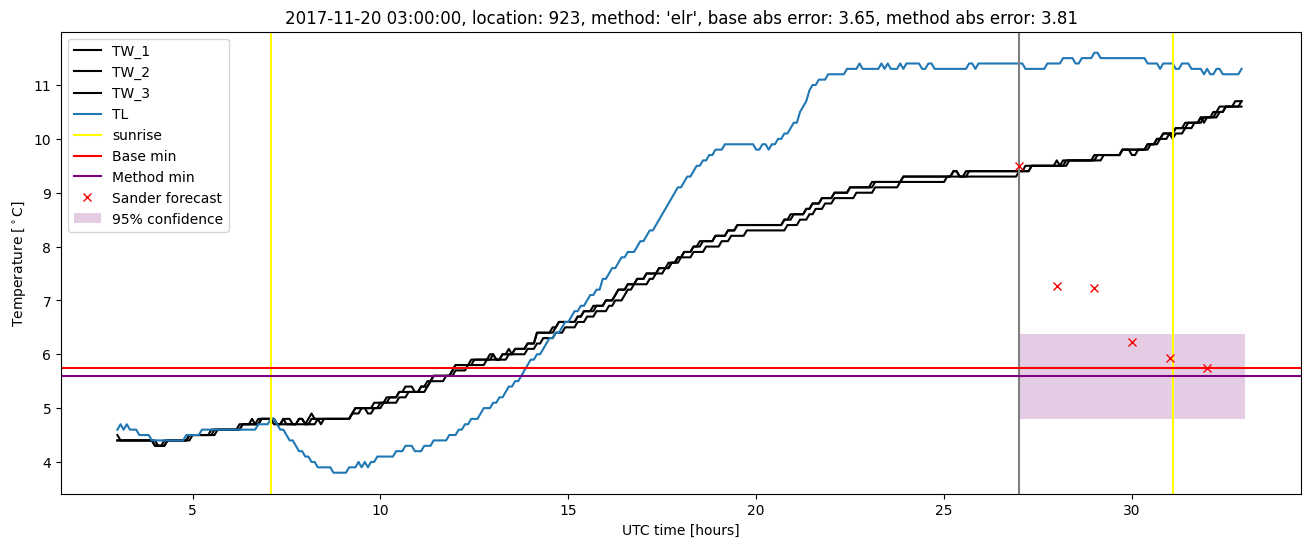
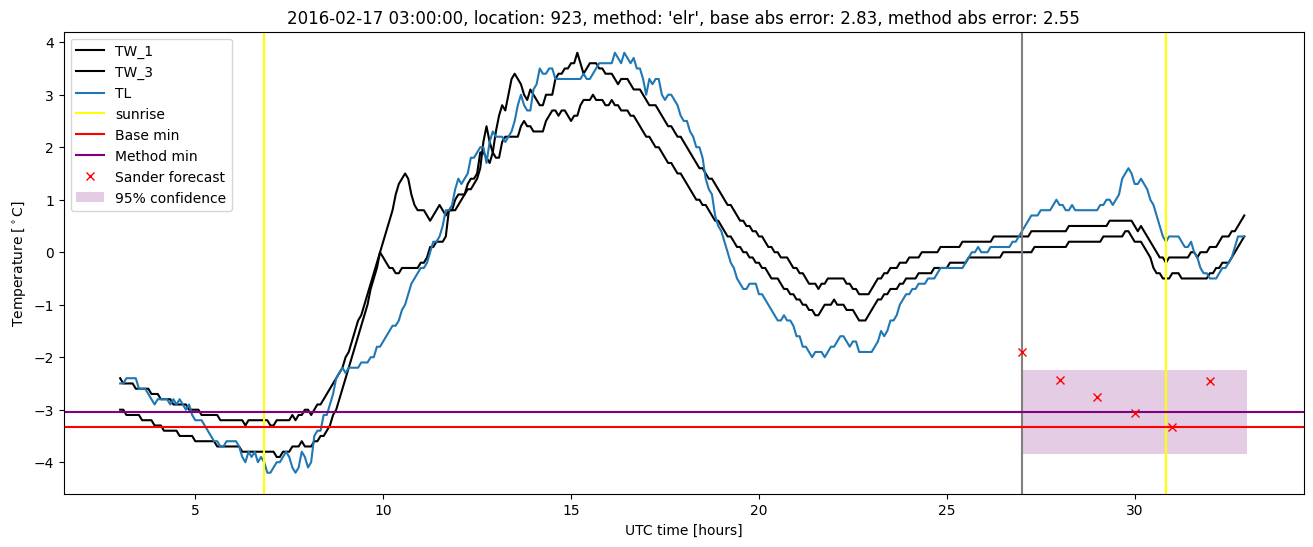
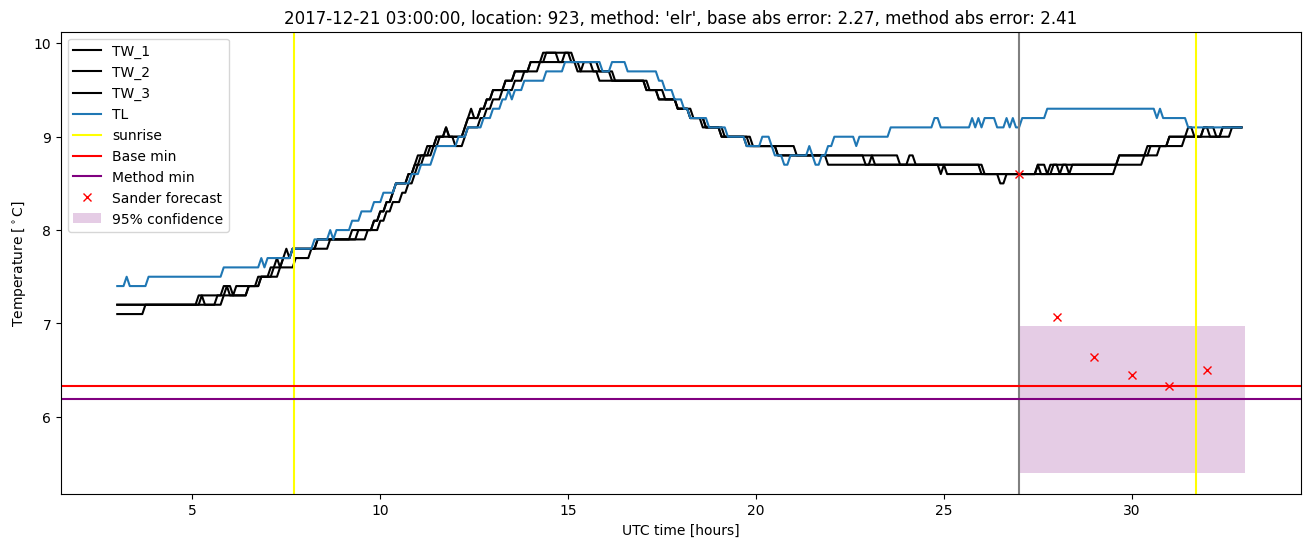
Extended logistic regression results
| names |
period |
power |
significance |
meanSquareError |
absError |
maxError |
CRPS |
IGN |
| baseline |
winter 2016 |
0.994 |
0.000e+00 |
0.388 |
0.447 |
2.833 |
NaN |
NaN |
| elr |
winter 2016 |
1.000 |
0.056 |
0.333 |
0.431 |
2.551 |
0.523 |
5.609 |
| baseline |
winter 2017 |
0.974 |
0.108 |
0.360 |
0.428 |
2.626 |
NaN |
NaN |
| elr |
winter 2017 |
0.983 |
0.108 |
0.311 |
0.402 |
2.395 |
0.501 |
4.938 |
| baseline |
winter 2018 |
0.987 |
0.129 |
0.474 |
0.483 |
3.654 |
NaN |
NaN |
| elr |
winter 2018 |
0.987 |
0.129 |
0.441 |
0.453 |
3.807 |
0.497 |
5.324 |
| baseline |
winter 2019 |
0.993 |
0.000e+00 |
0.304 |
0.406 |
2.263 |
NaN |
NaN |
| elr |
winter 2019 |
0.993 |
0.167 |
0.210 |
0.361 |
1.552 |
0.493 |
3.833 |
| baseline |
all |
0.988 |
0.082 |
0.385 |
0.443 |
3.654 |
NaN |
NaN |
| elr |
all |
0.991 |
0.112 |
0.327 |
0.414 |
3.807 |
0.504 |
4.963 |
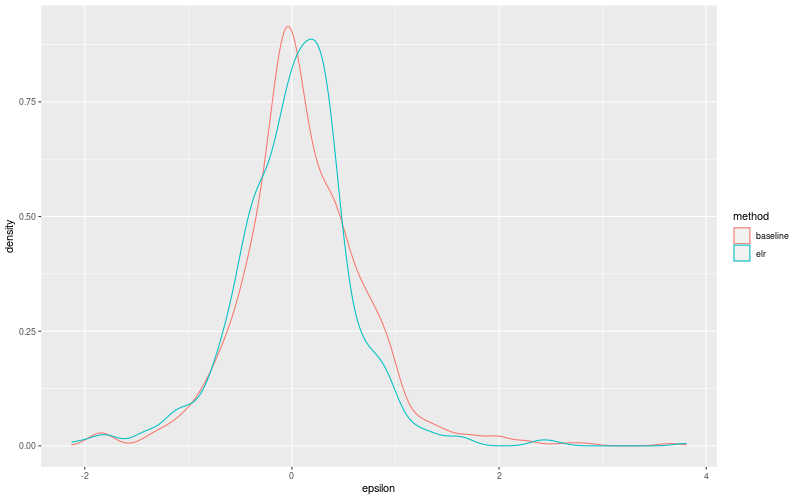
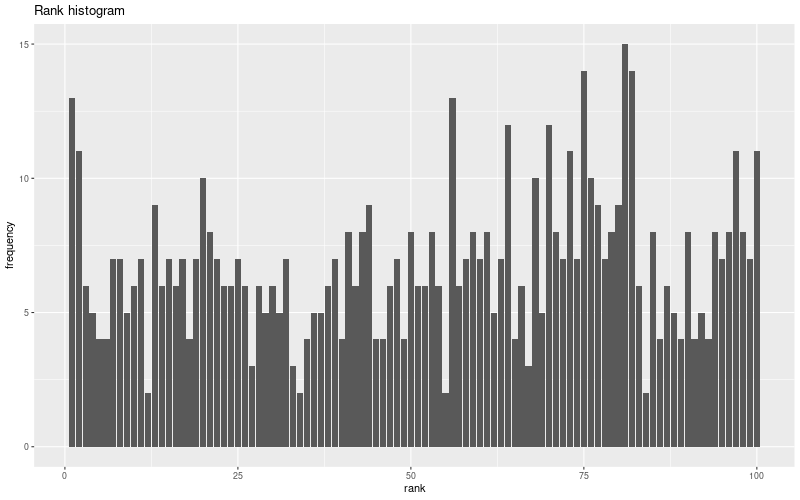
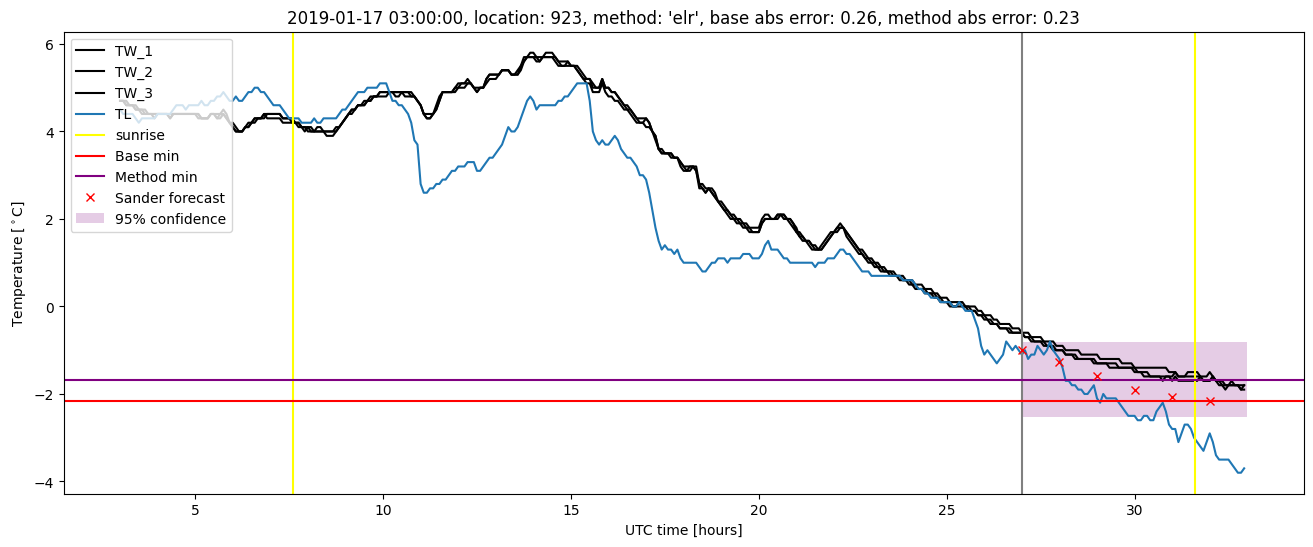
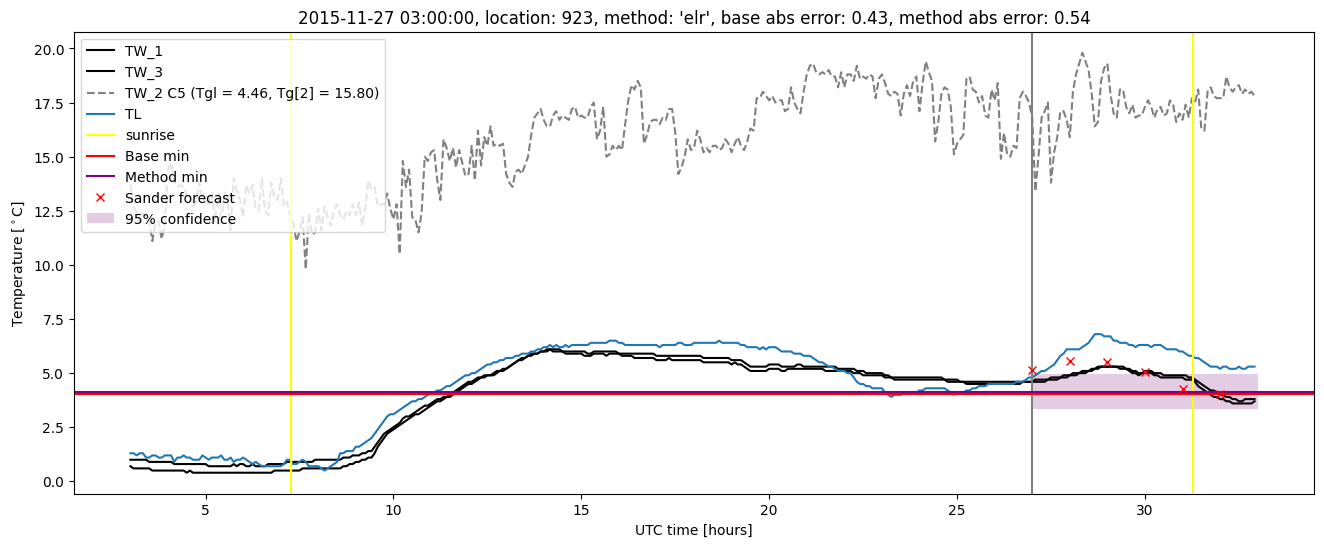
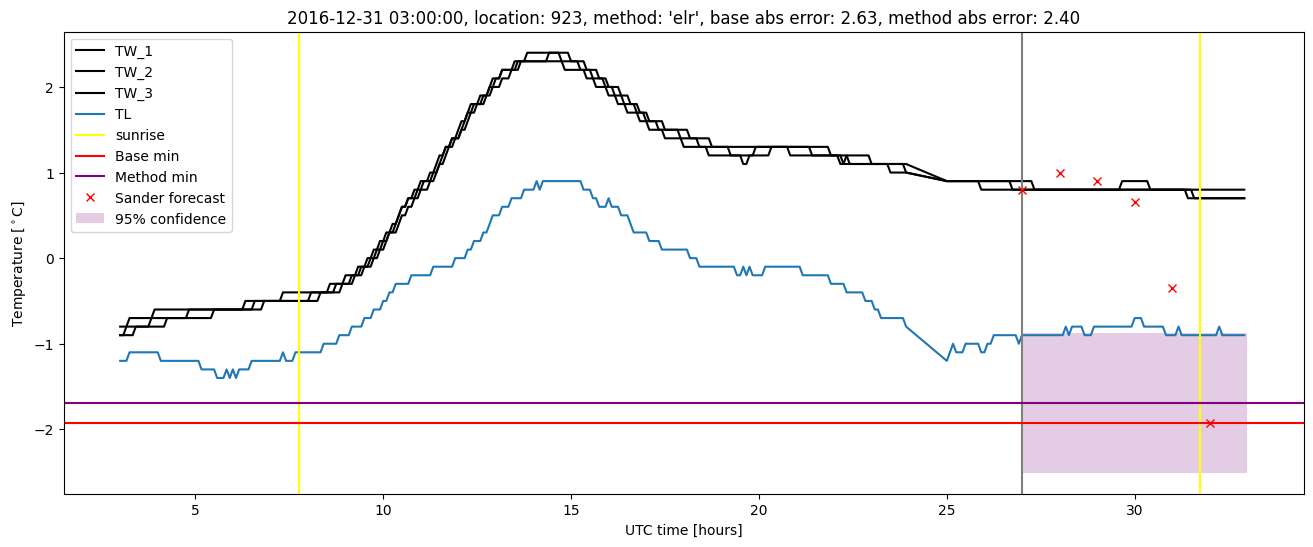
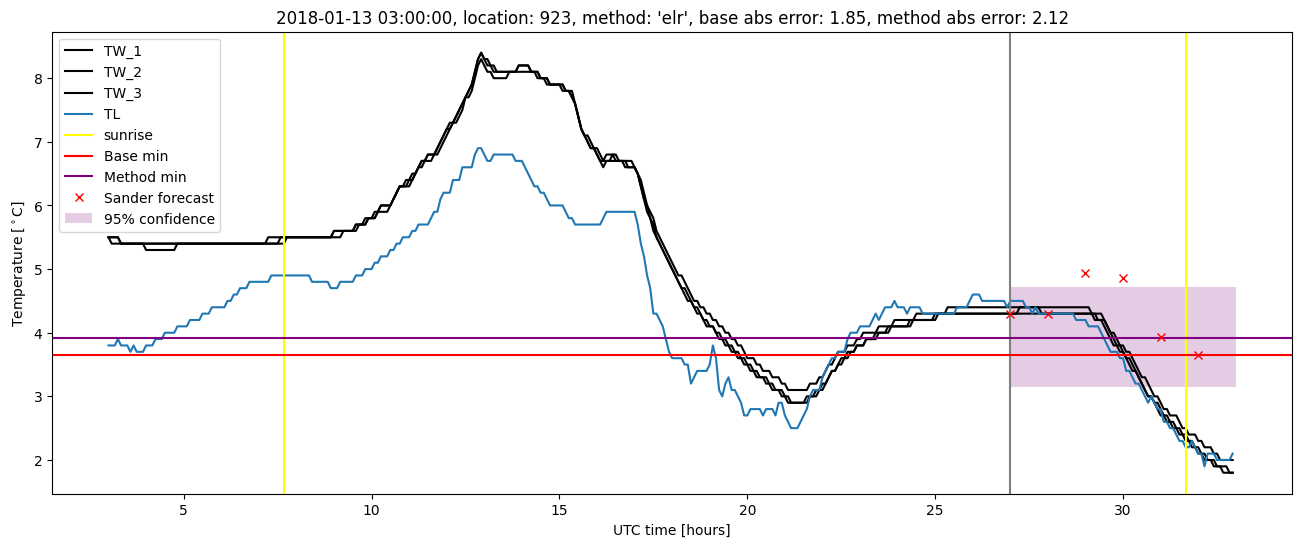
Extended logistic regression plots