GMS location: 922
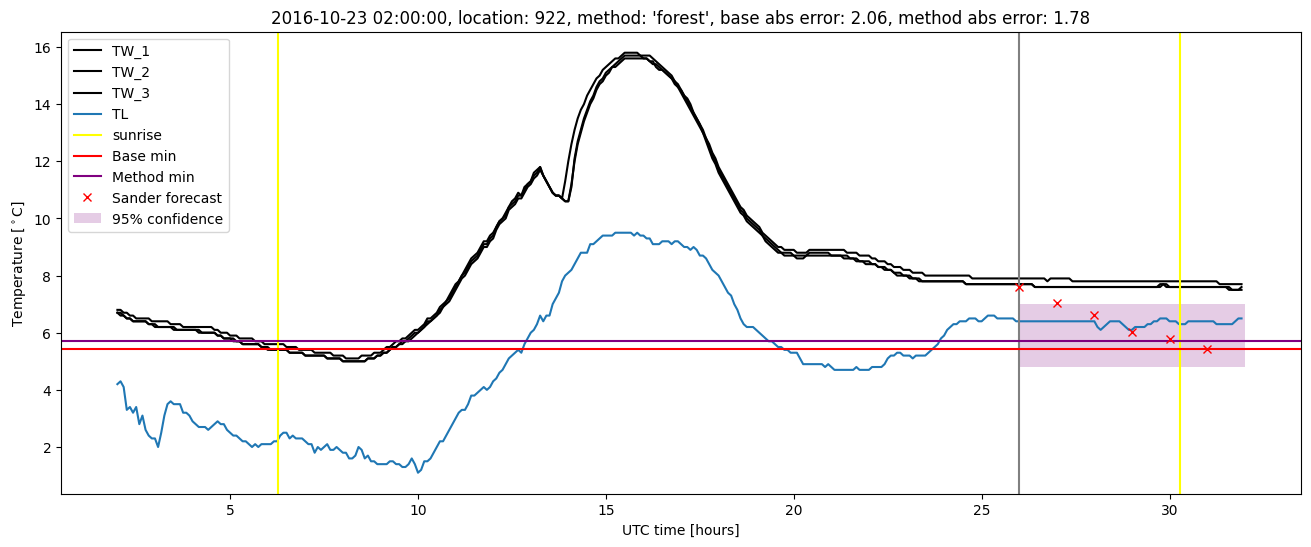
Random forest results
| names |
period |
power |
significance |
meanSquareError |
absError |
maxError |
CRPS |
IGN |
| baseline |
winter 2016 |
0.994 |
0.000e+00 |
0.387 |
0.463 |
1.865 |
NaN |
NaN |
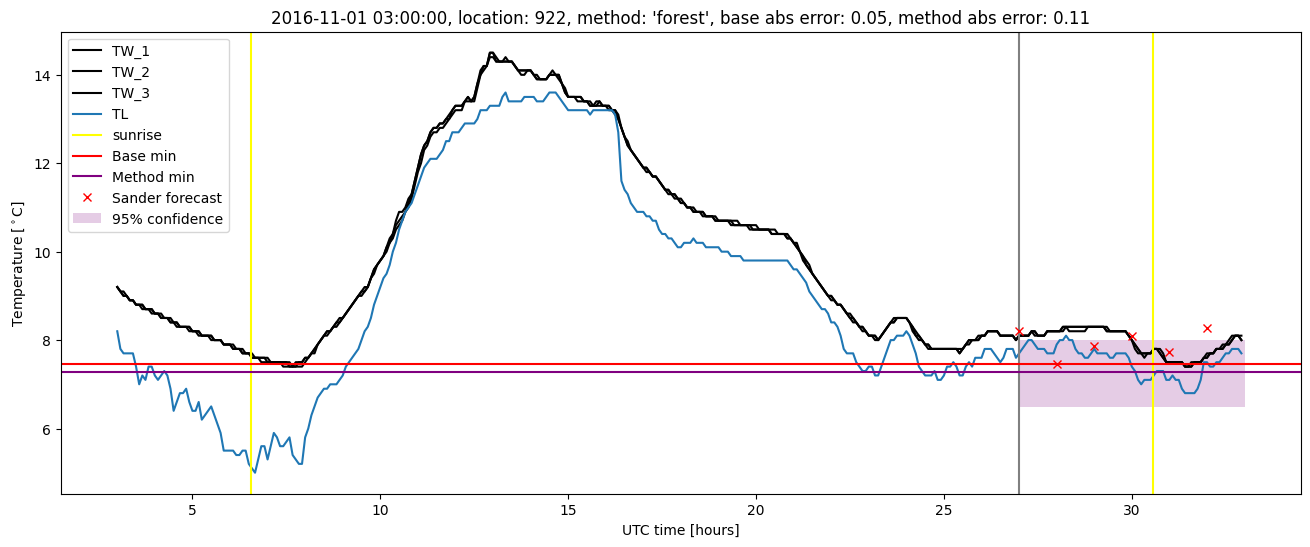
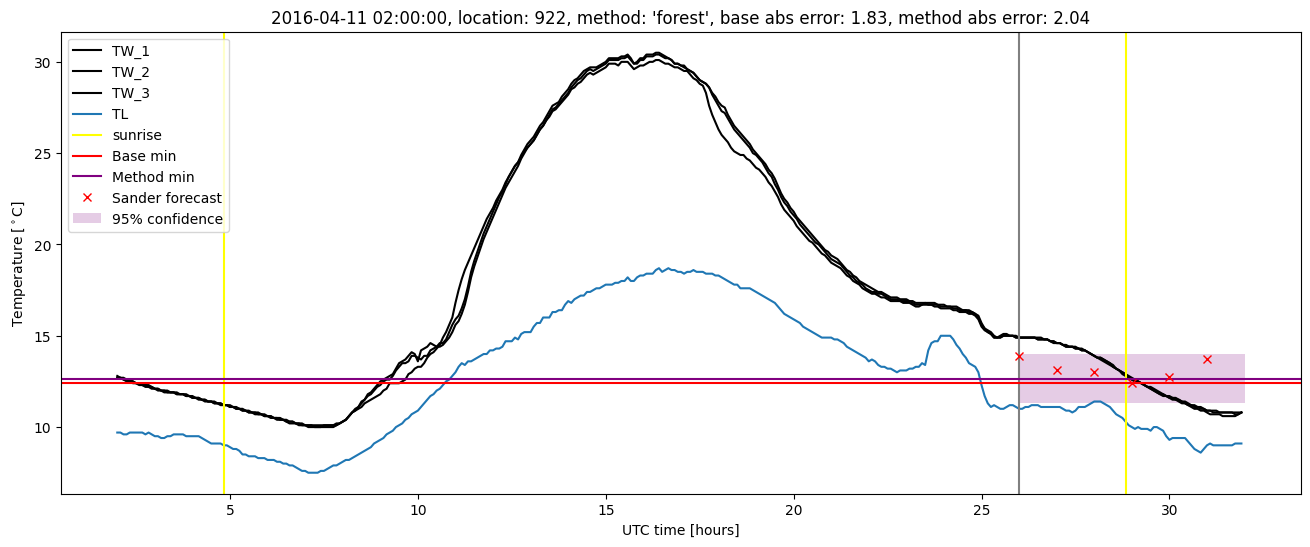
| forest |
winter 2016 |
0.989 |
0.071 |
0.299 |
0.398 |
2.041 |
0.491 |
5.379 |
| baseline |
winter 2017 |
0.967 |
0.032 |
0.469 |
0.492 |
2.624 |
NaN |
NaN |
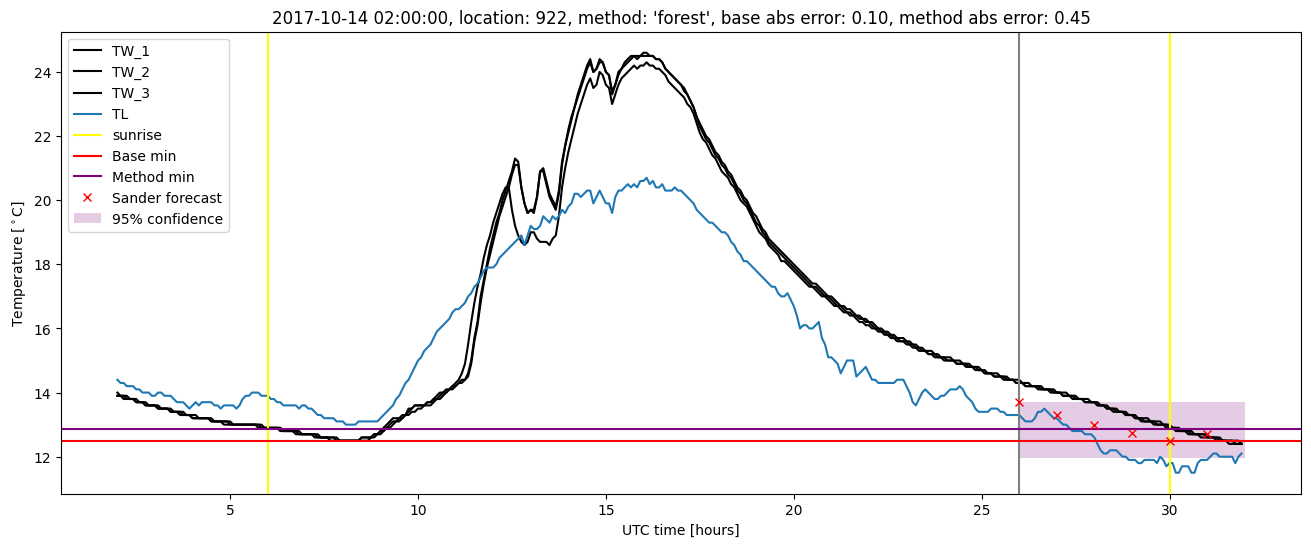
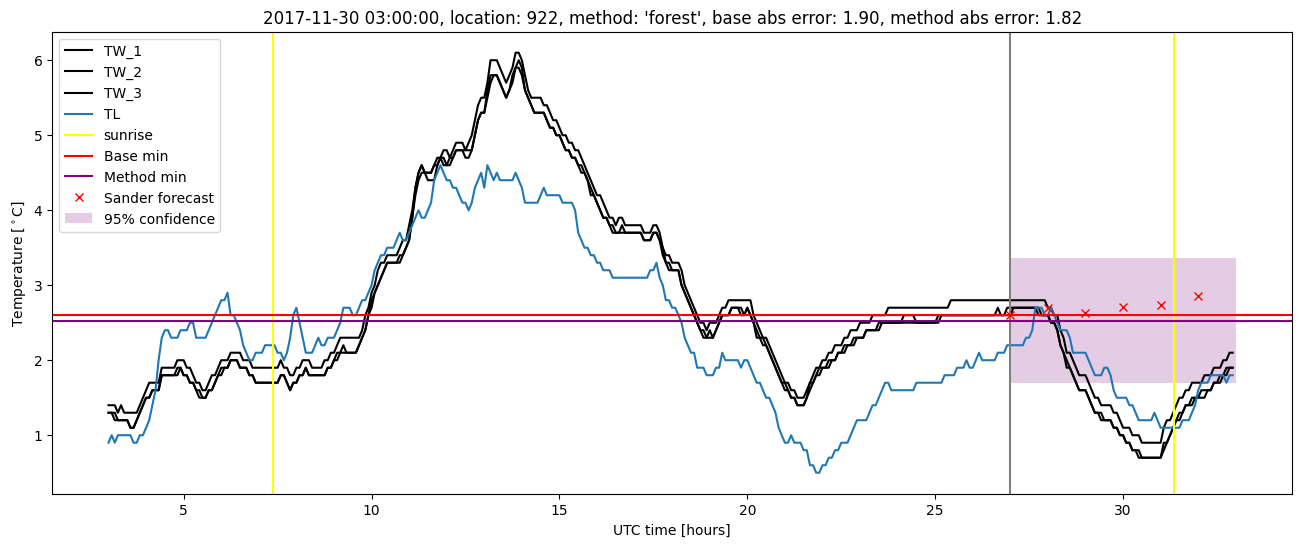
| forest |
winter 2017 |
0.967 |
0.032 |
0.337 |
0.422 |
1.780 |
0.468 |
3.860 |
| baseline |
winter 2018 |
0.973 |
0.103 |
0.329 |
0.423 |
2.228 |
NaN |
NaN |
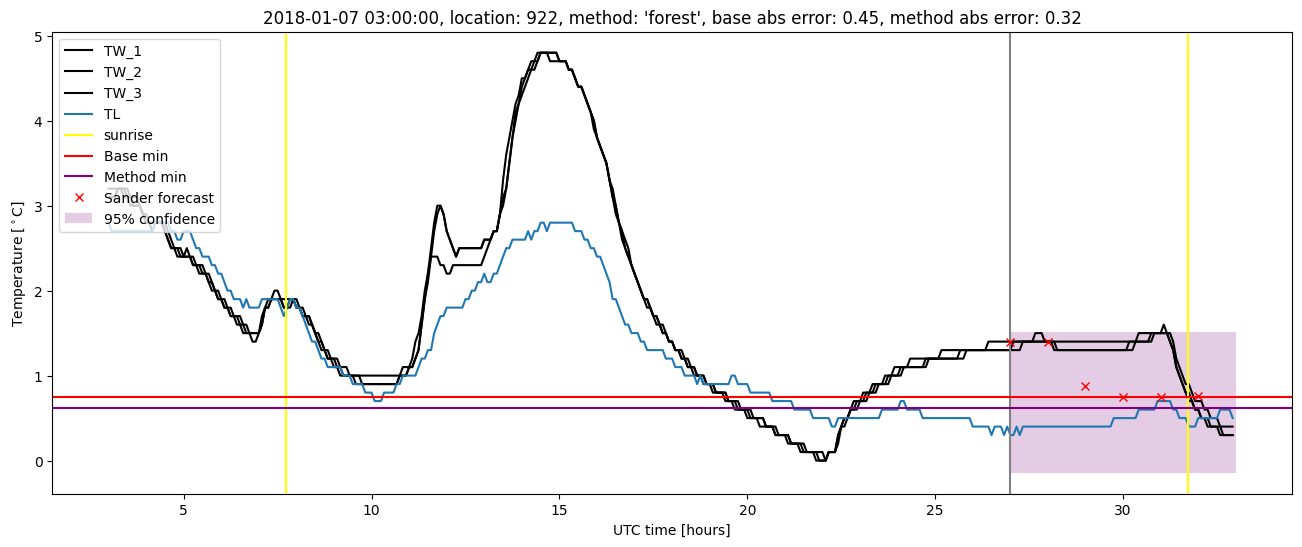
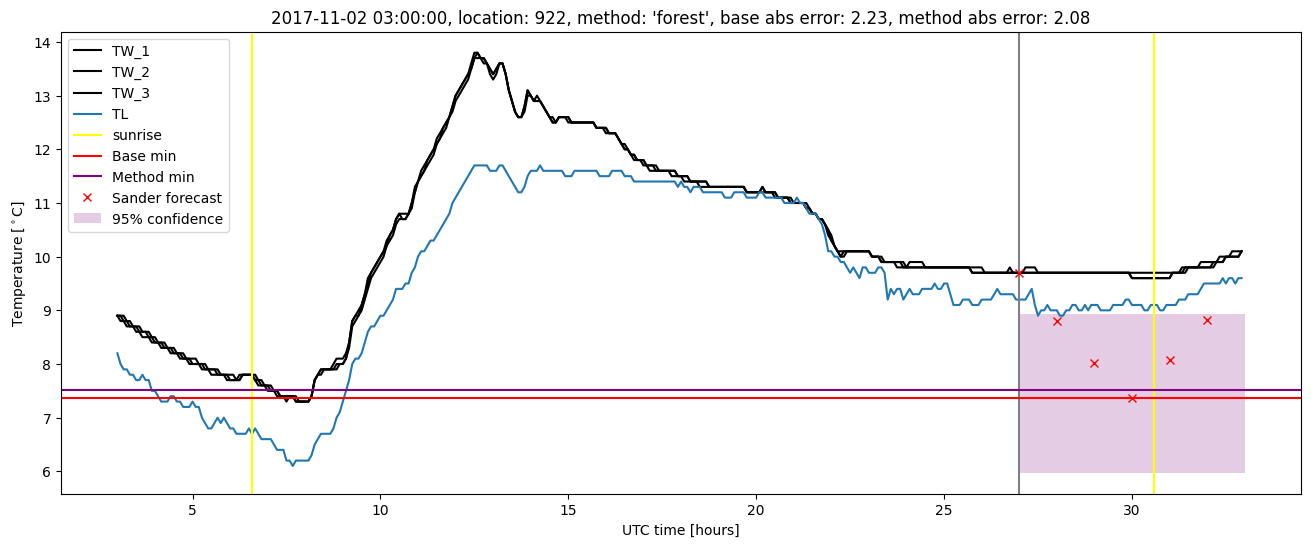
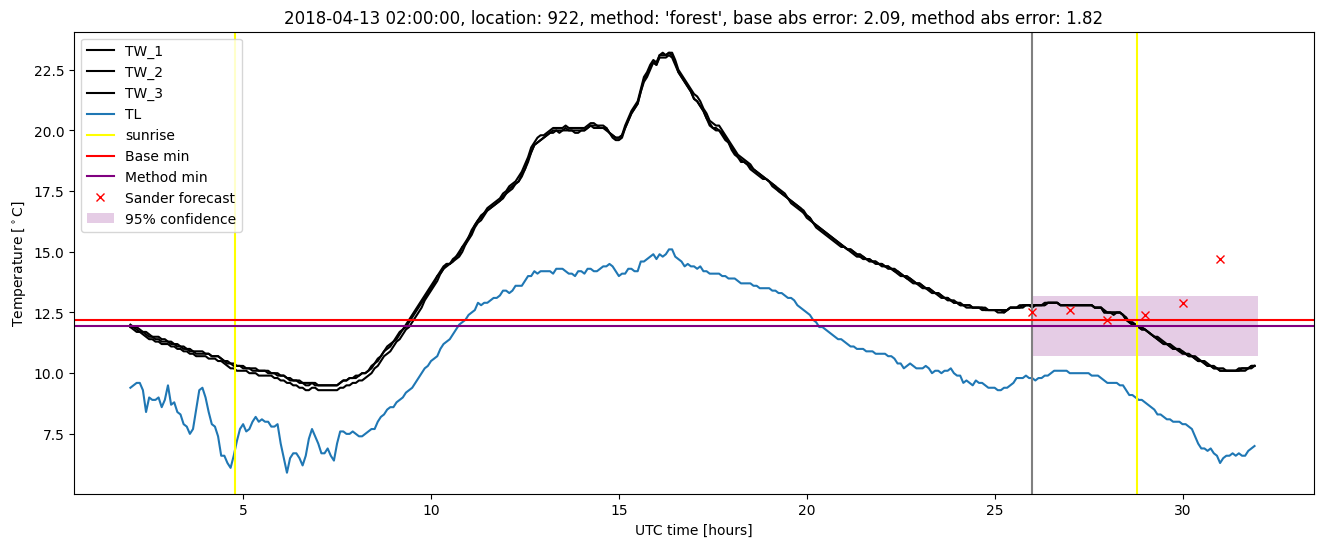
| forest |
winter 2018 |
0.980 |
0.103 |
0.272 |
0.376 |
2.080 |
0.476 |
3.322 |
| baseline |
winter 2019 |
0.986 |
0.000e+00 |
0.315 |
0.395 |
2.415 |
NaN |
NaN |
| forest |
winter 2019 |
0.993 |
0.000e+00 |
0.218 |
0.349 |
1.453 |
0.463 |
2.912 |
| baseline |
all |
0.981 |
0.046 |
0.373 |
0.443 |
2.624 |
NaN |
NaN |
| forest |
all |
0.983 |
0.058 |
0.282 |
0.386 |
2.080 |
0.475 |
3.921 |
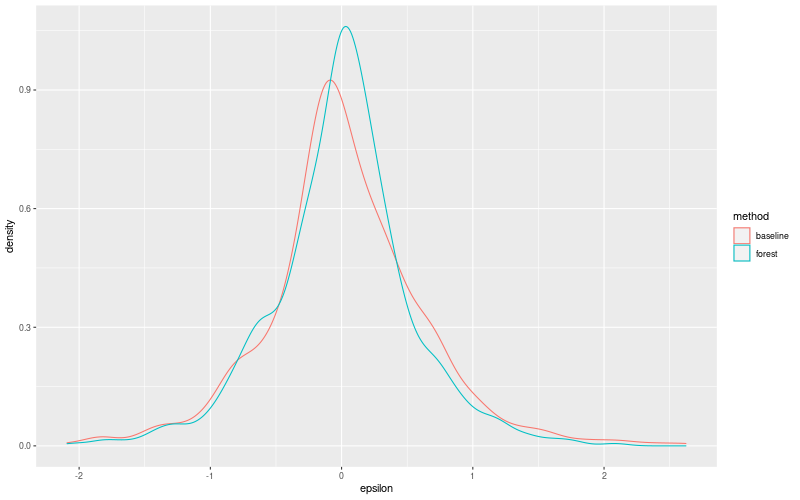
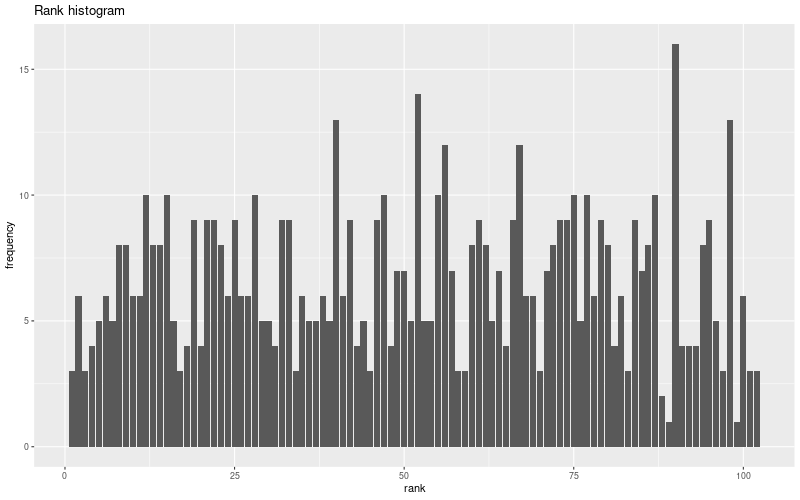
Random forest plots
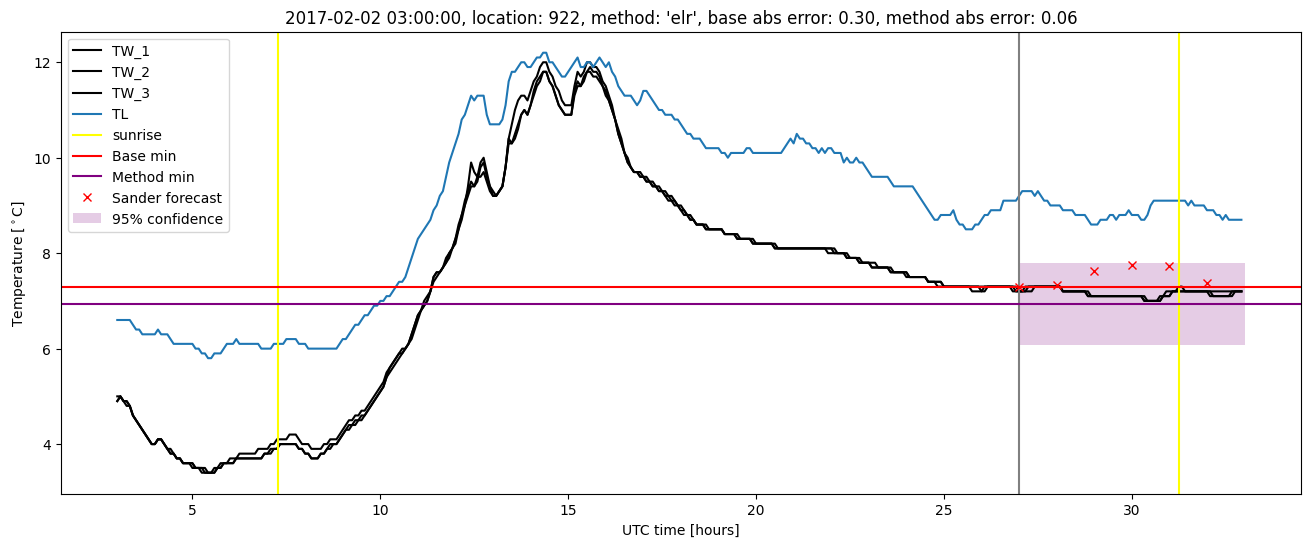
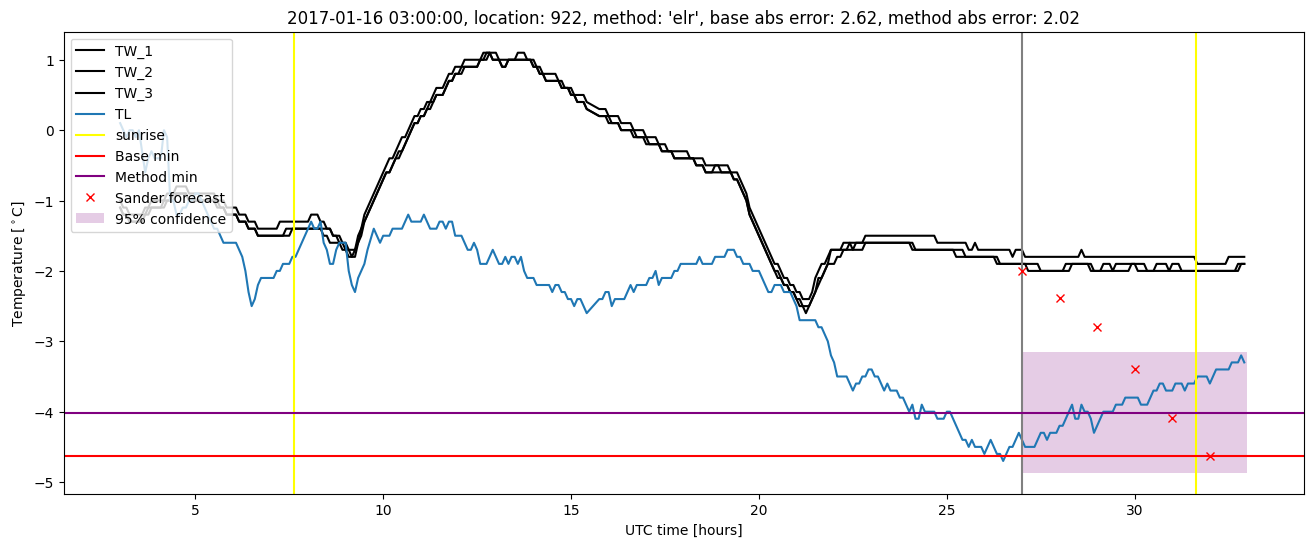
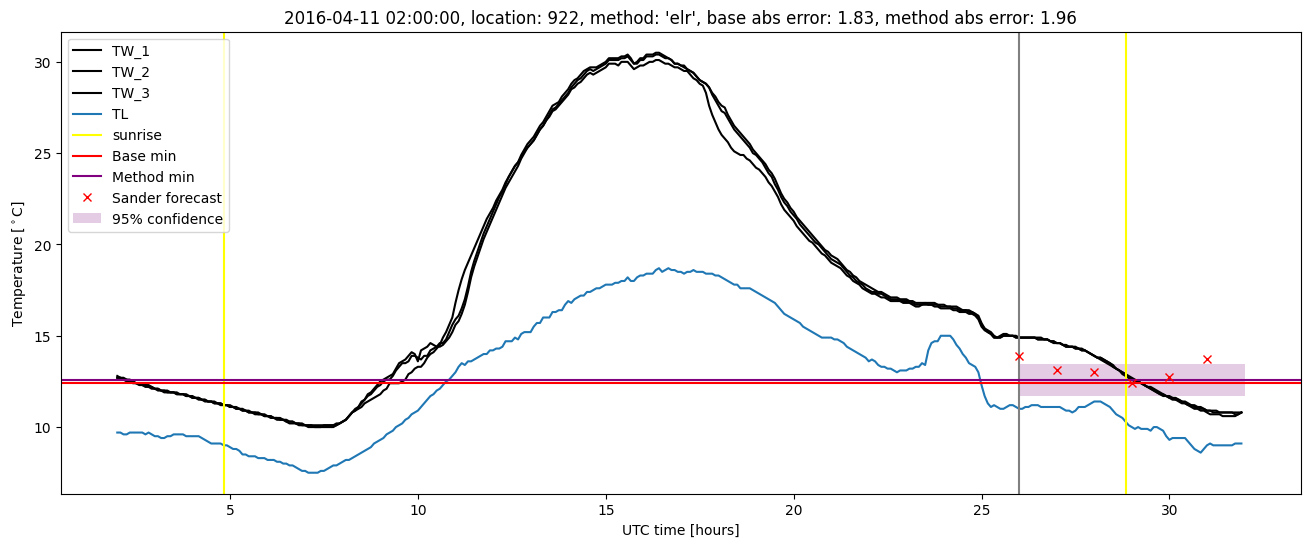
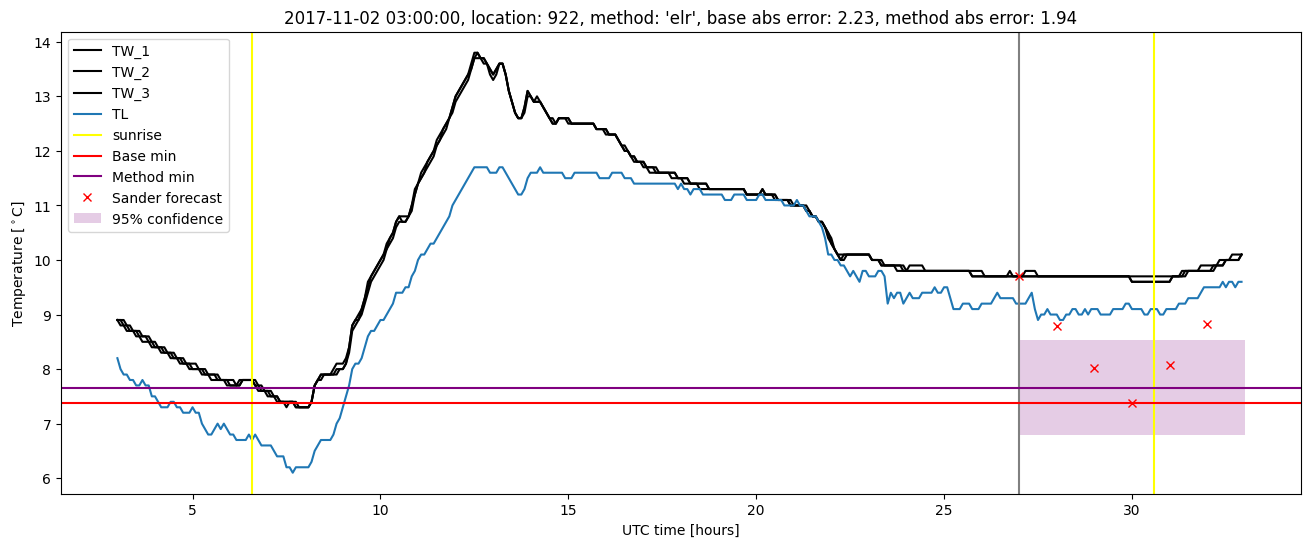
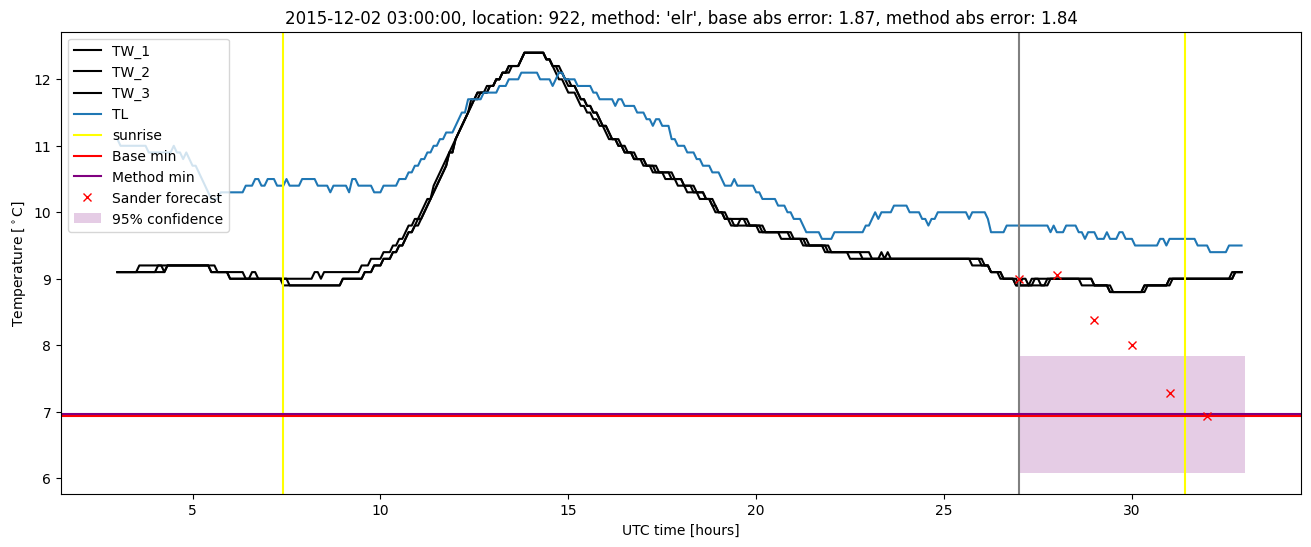
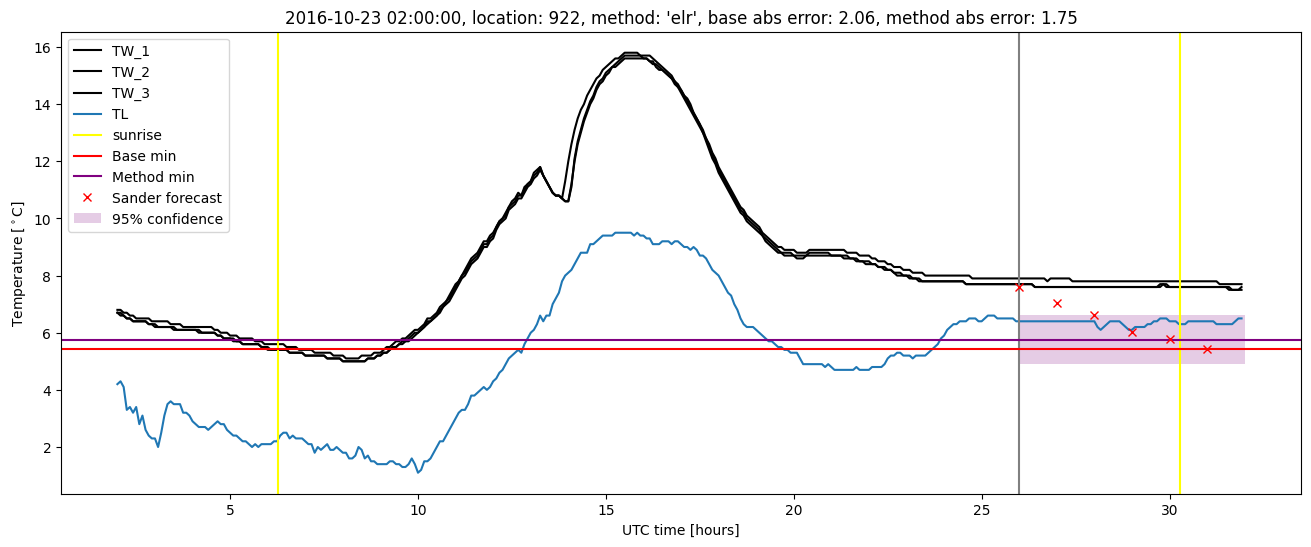
Extended logistic regression results
| names |
period |
power |
significance |
meanSquareError |
absError |
maxError |
CRPS |
IGN |
| baseline |
winter 2016 |
0.994 |
0.000e+00 |
0.387 |
0.463 |
1.865 |
NaN |
NaN |
| elr |
winter 2016 |
0.989 |
0.143 |
0.322 |
0.428 |
1.964 |
0.563 |
4.564 |
| baseline |
winter 2017 |
0.967 |
0.032 |
0.469 |
0.492 |
2.624 |
NaN |
NaN |
| elr |
winter 2017 |
0.950 |
0.032 |
0.347 |
0.432 |
2.019 |
0.528 |
4.559 |
| baseline |
winter 2018 |
0.973 |
0.103 |
0.329 |
0.423 |
2.228 |
NaN |
NaN |
| elr |
winter 2018 |
0.973 |
0.103 |
0.295 |
0.402 |
1.943 |
0.539 |
4.460 |
| baseline |
winter 2019 |
0.986 |
0.000e+00 |
0.315 |
0.395 |
2.415 |
NaN |
NaN |
| elr |
winter 2019 |
0.993 |
0.000e+00 |
0.243 |
0.379 |
1.365 |
0.512 |
3.945 |
| baseline |
all |
0.981 |
0.046 |
0.373 |
0.443 |
2.624 |
NaN |
NaN |
| elr |
all |
0.978 |
0.070 |
0.302 |
0.410 |
2.019 |
0.537 |
4.392 |
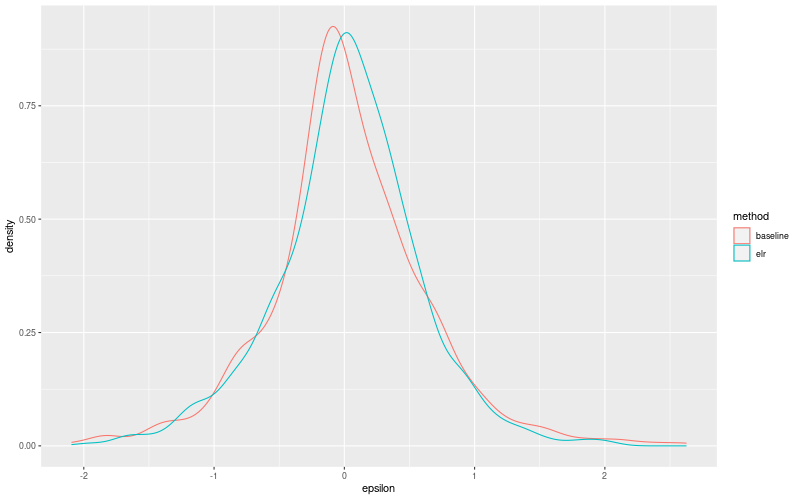
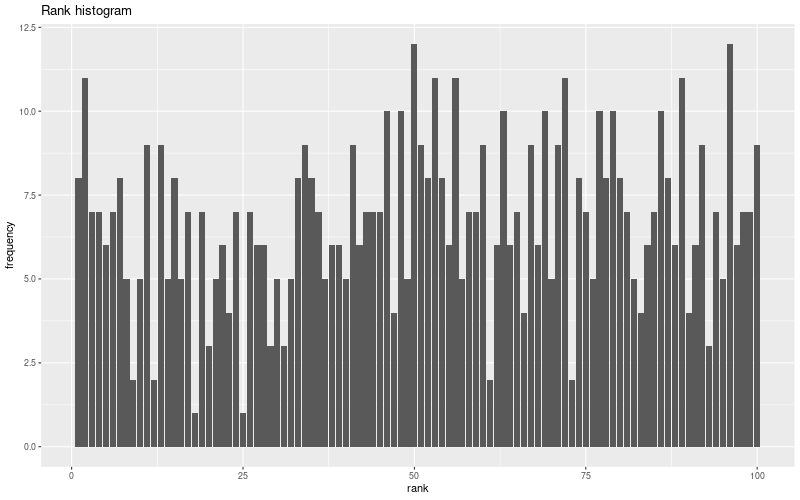
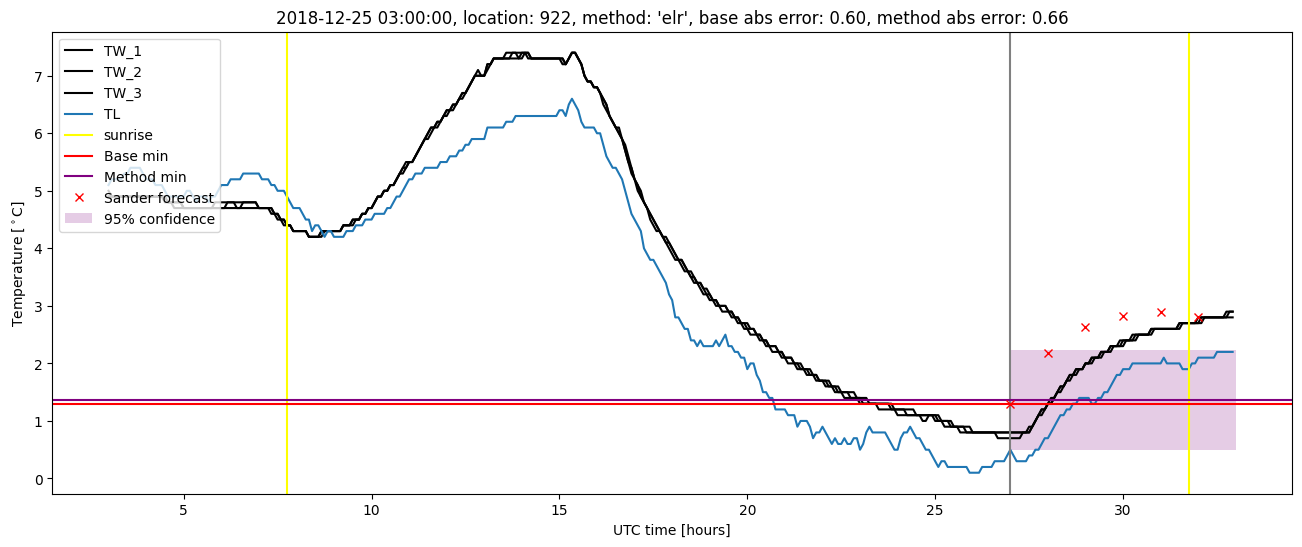
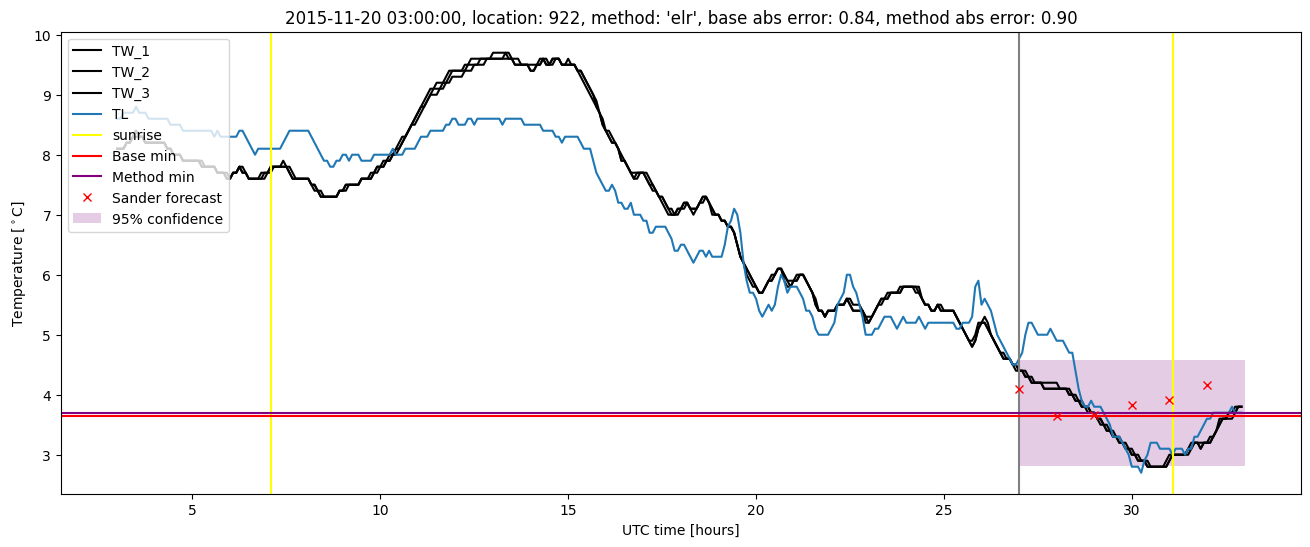
Extended logistic regression plots