GMS location: 921
Random forest results
| names |
period |
power |
significance |
meanSquareError |
absError |
maxError |
CRPS |
IGN |
| baseline |
winter 2016 |
0.989 |
0.045 |
0.356 |
0.444 |
2.314 |
NaN |
NaN |
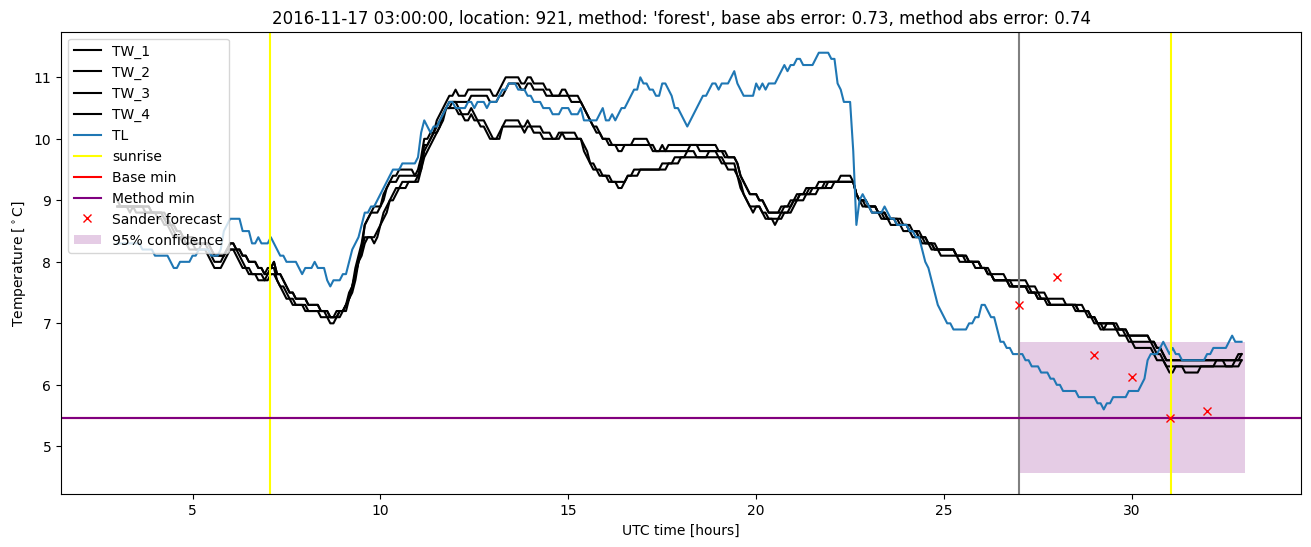
| forest |
winter 2016 |
0.994 |
0.045 |
0.287 |
0.411 |
2.407 |
0.489 |
3.338 |
| baseline |
winter 2017 |
0.964 |
0.050 |
0.420 |
0.478 |
2.841 |
NaN |
NaN |
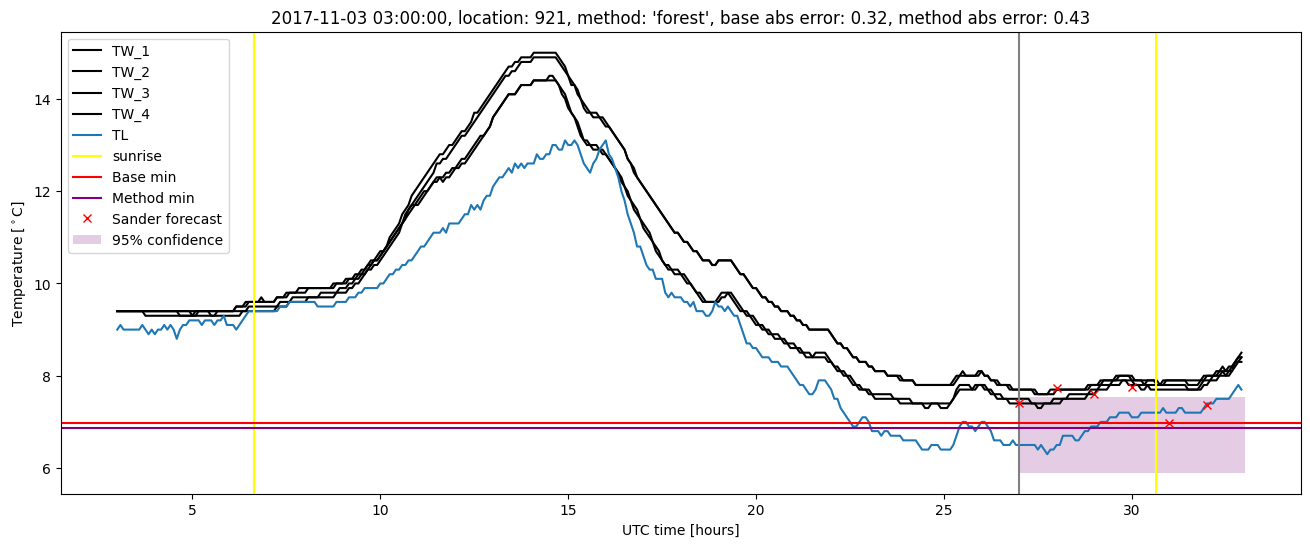
| forest |
winter 2017 |
0.955 |
0.050 |
0.326 |
0.418 |
1.972 |
0.460 |
3.011 |
| baseline |
winter 2018 |
0.986 |
0.105 |
0.396 |
0.470 |
2.146 |
NaN |
NaN |
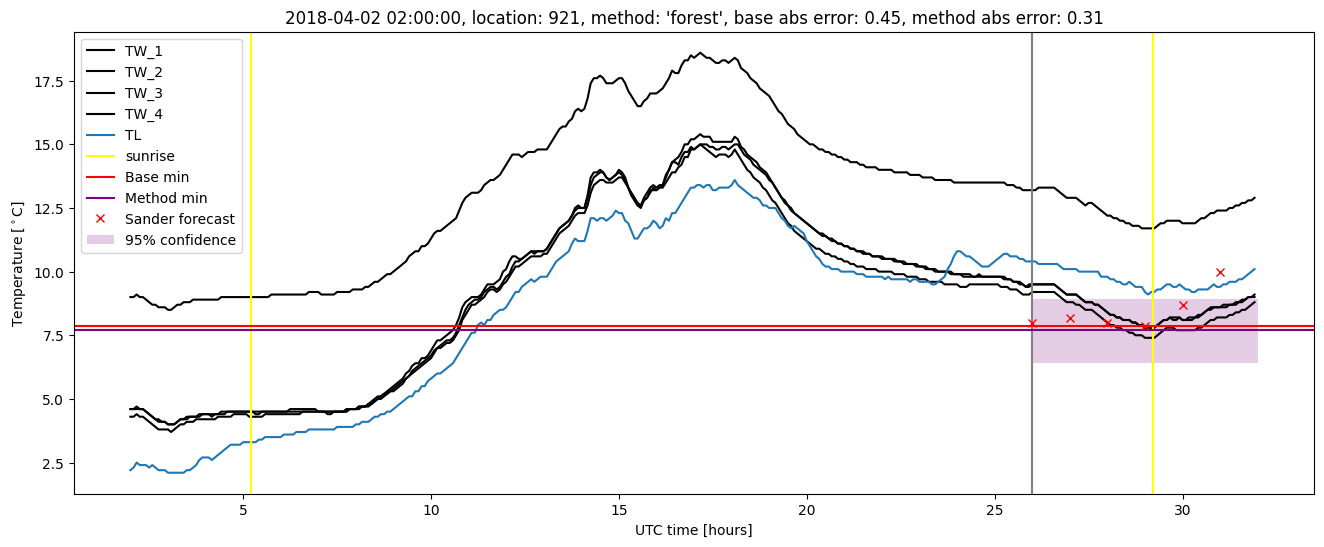
| forest |
winter 2018 |
0.986 |
0.105 |
0.328 |
0.432 |
1.993 |
0.485 |
2.744 |
| baseline |
winter 2019 |
0.972 |
0.000e+00 |
0.327 |
0.410 |
2.191 |
NaN |
NaN |
| forest |
winter 2019 |
0.972 |
0.000e+00 |
0.240 |
0.358 |
1.596 |
0.470 |
2.578 |
| baseline |
all |
0.979 |
0.062 |
0.374 |
0.451 |
2.841 |
NaN |
NaN |
| forest |
all |
0.979 |
0.062 |
0.296 |
0.406 |
2.407 |
0.477 |
2.936 |
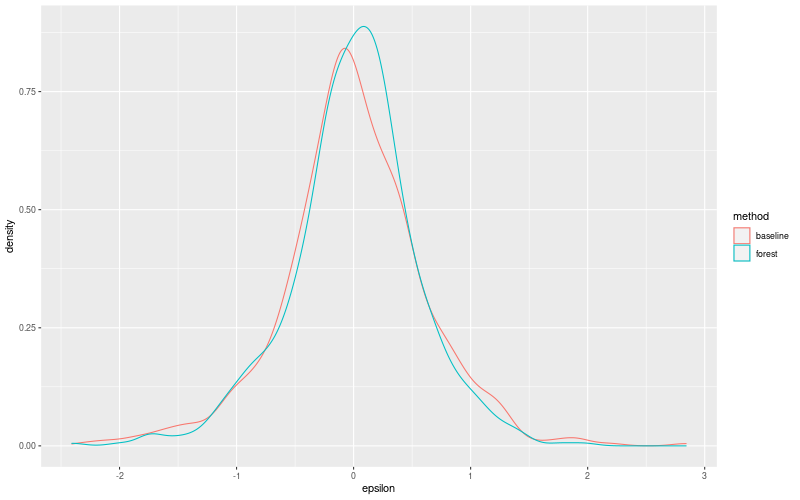
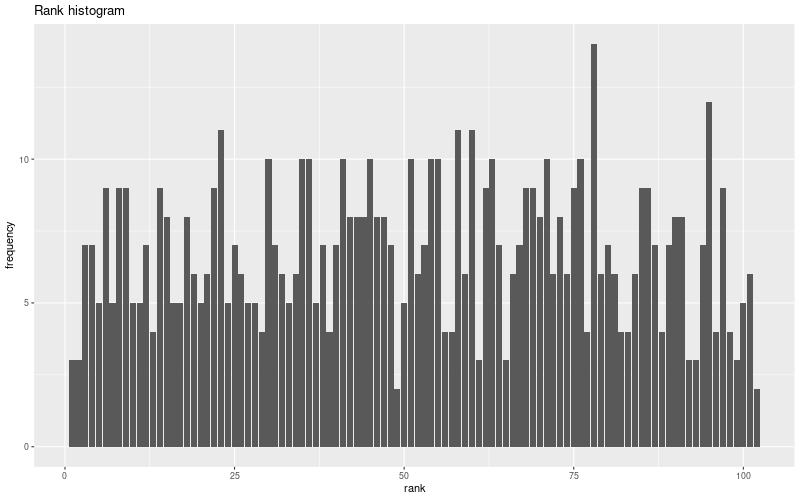
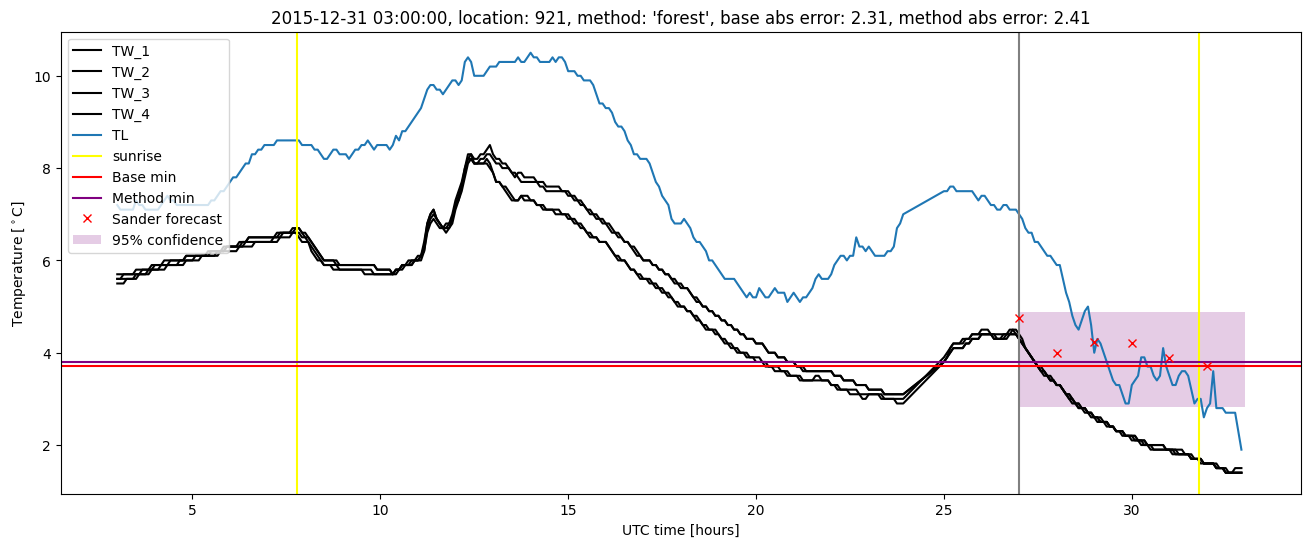
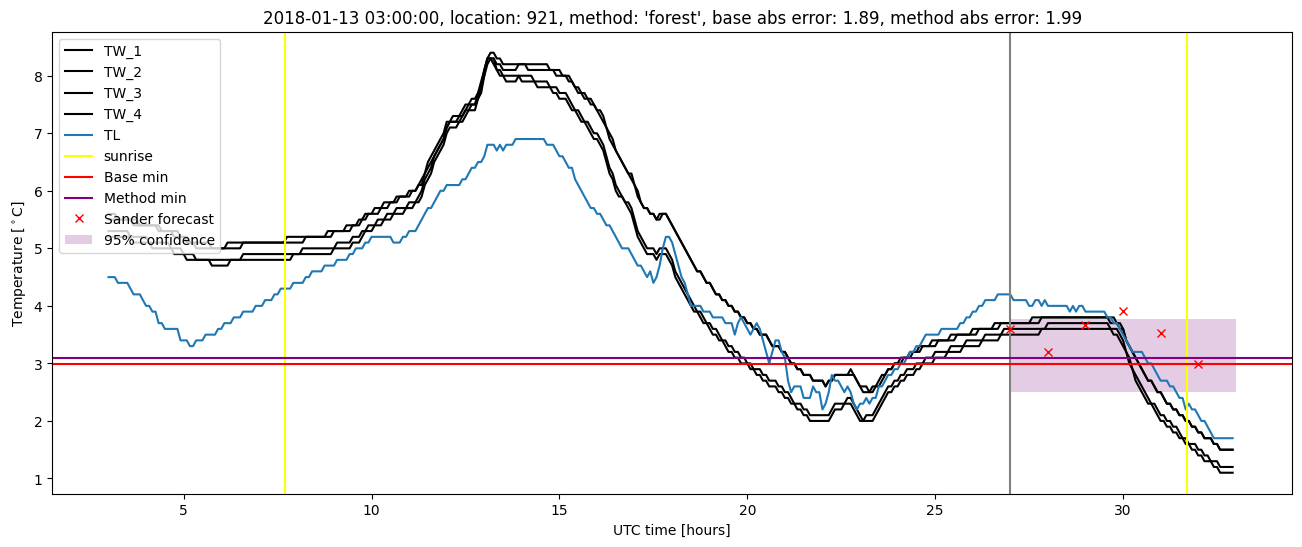
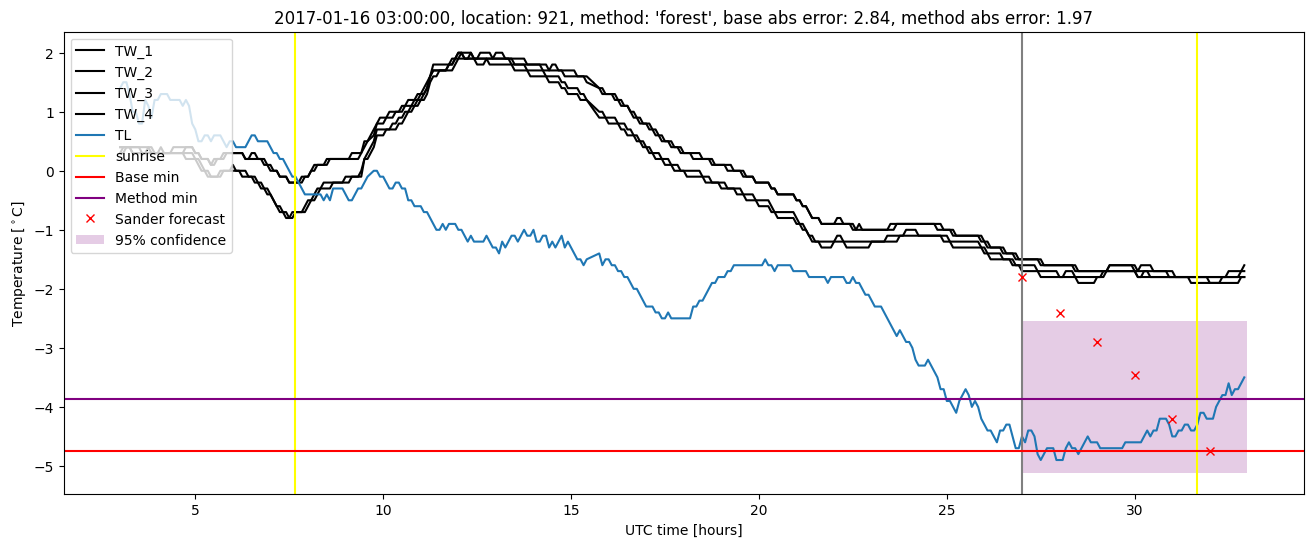
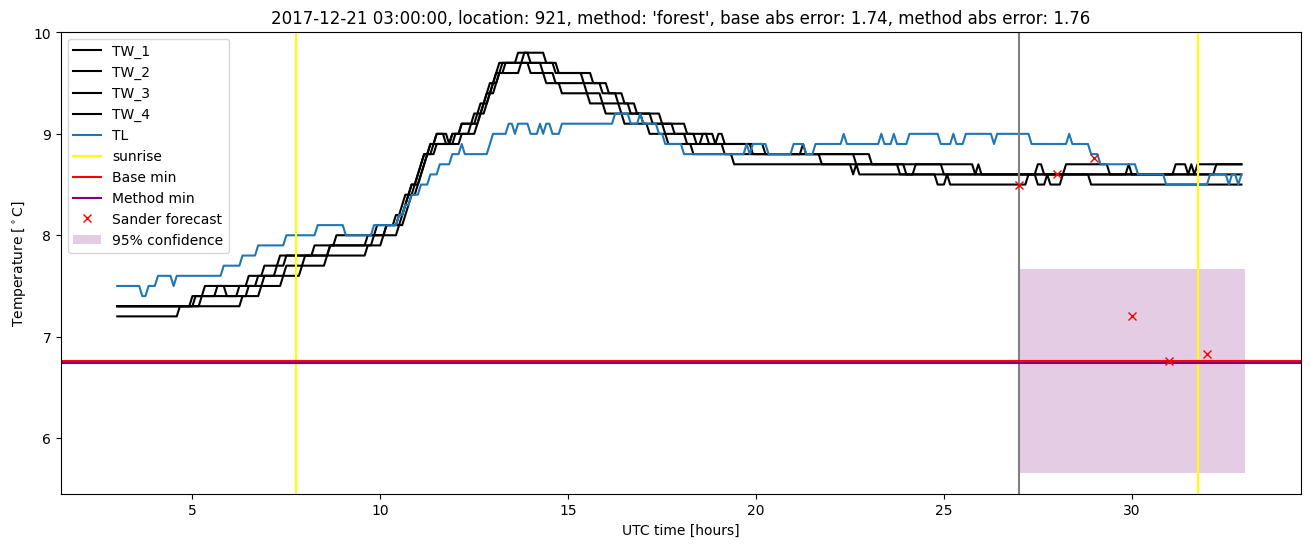
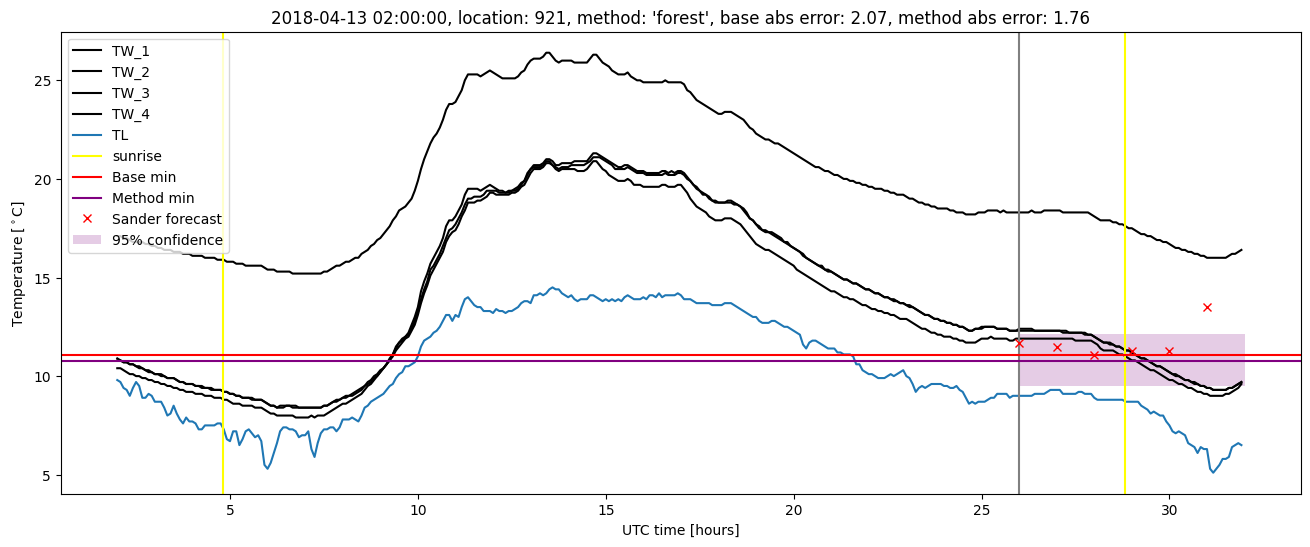
Random forest plots
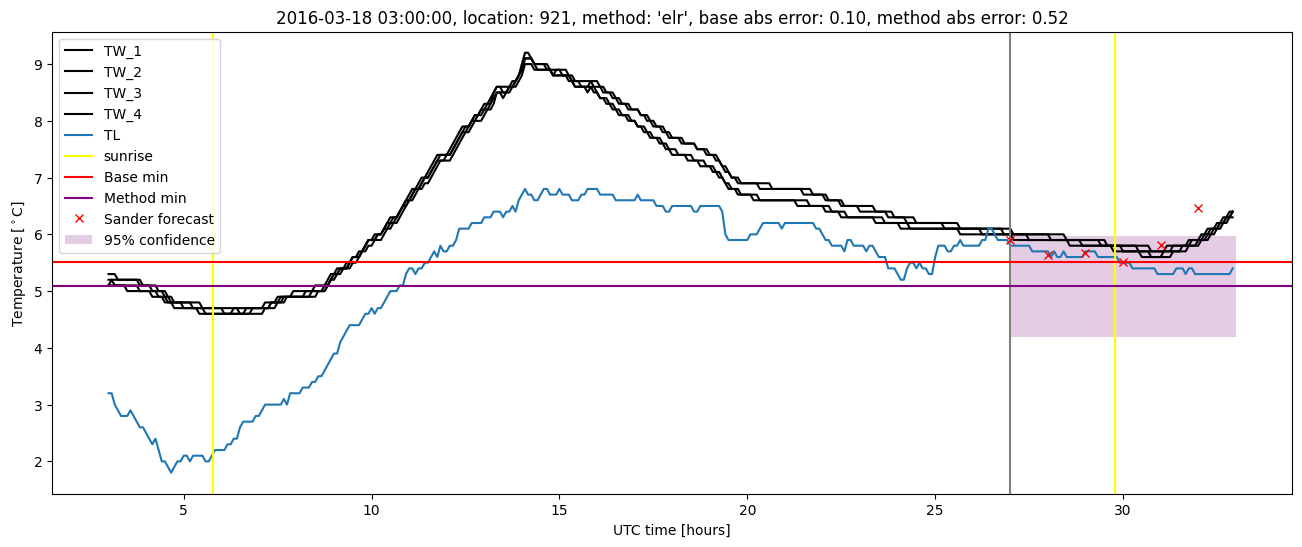
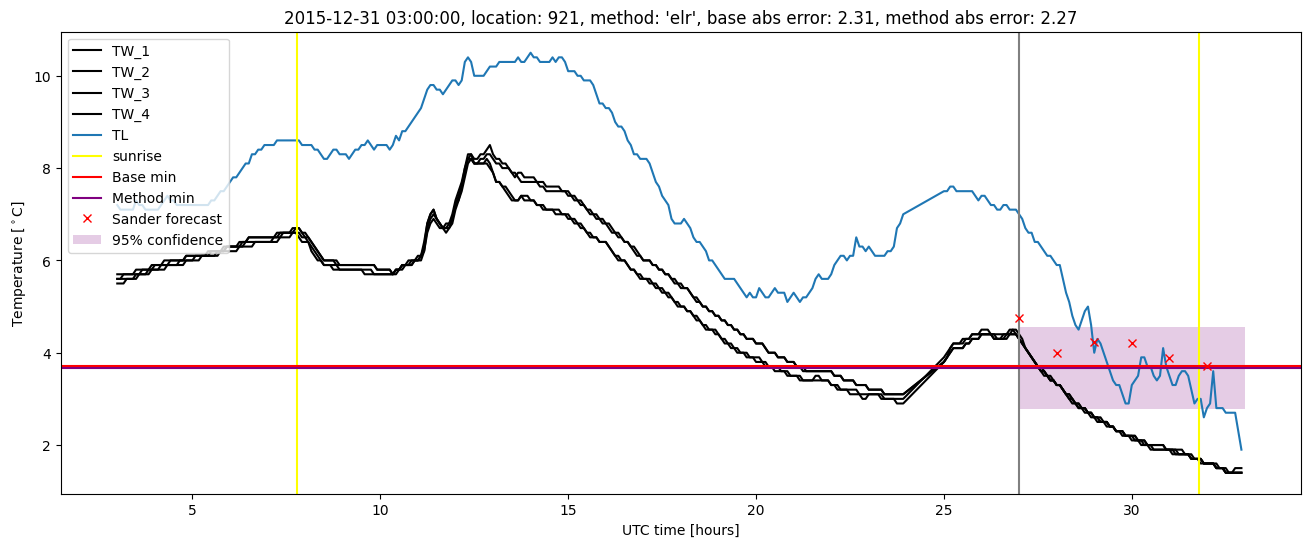
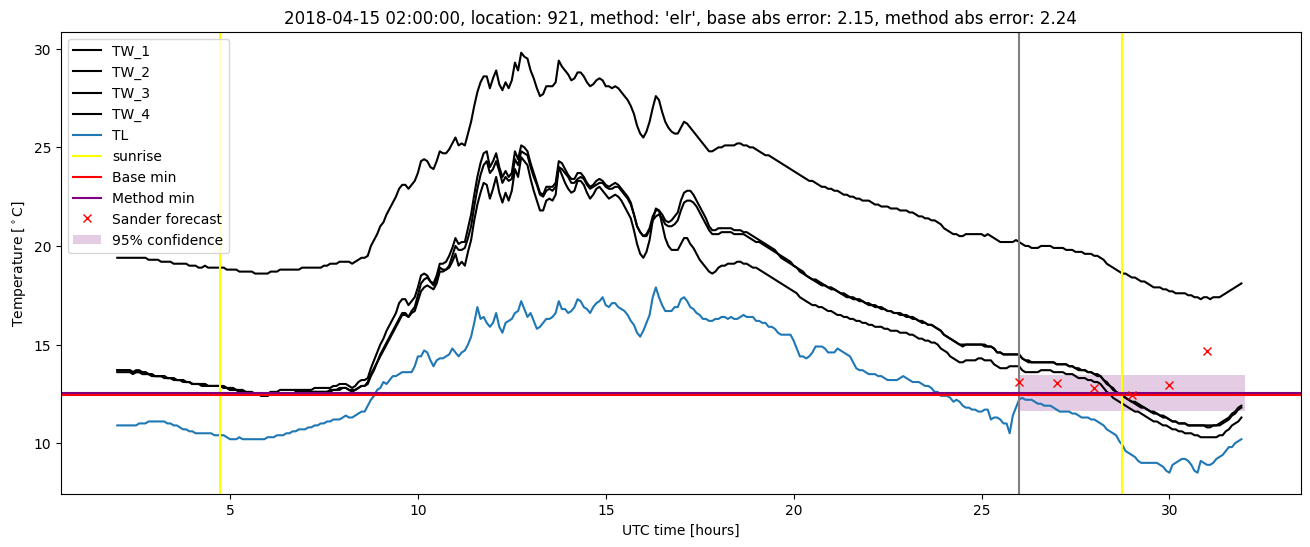
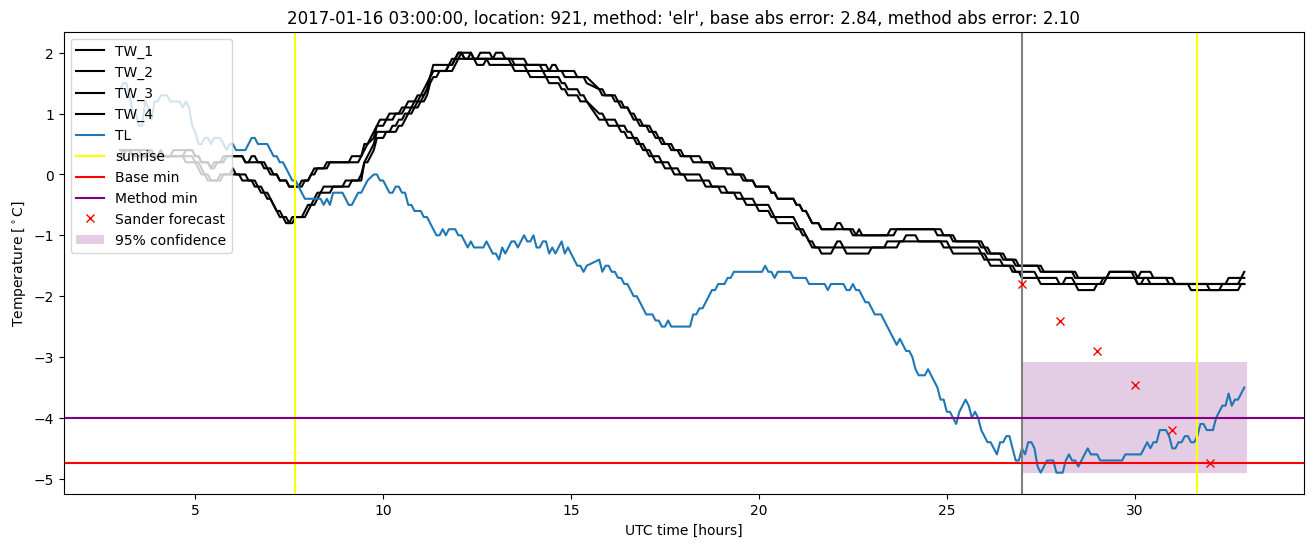
Extended logistic regression results
| names |
period |
power |
significance |
meanSquareError |
absError |
maxError |
CRPS |
IGN |
| baseline |
winter 2016 |
0.989 |
0.045 |
0.356 |
0.444 |
2.314 |
NaN |
NaN |
| elr |
winter 2016 |
1.000 |
0.045 |
0.304 |
0.434 |
2.267 |
0.553 |
4.266 |
| baseline |
winter 2017 |
0.964 |
0.050 |
0.420 |
0.478 |
2.841 |
NaN |
NaN |
| elr |
winter 2017 |
0.955 |
0.075 |
0.326 |
0.425 |
2.098 |
0.507 |
3.429 |
| baseline |
winter 2018 |
0.986 |
0.105 |
0.396 |
0.470 |
2.146 |
NaN |
NaN |
| elr |
winter 2018 |
0.993 |
0.105 |
0.355 |
0.435 |
2.239 |
0.507 |
3.504 |
| baseline |
winter 2019 |
0.972 |
0.000e+00 |
0.327 |
0.410 |
2.191 |
NaN |
NaN |
| elr |
winter 2019 |
0.986 |
0.000e+00 |
0.260 |
0.377 |
1.517 |
0.492 |
2.806 |
| baseline |
all |
0.979 |
0.062 |
0.374 |
0.451 |
2.841 |
NaN |
NaN |
| elr |
all |
0.986 |
0.071 |
0.312 |
0.419 |
2.267 |
0.517 |
3.548 |
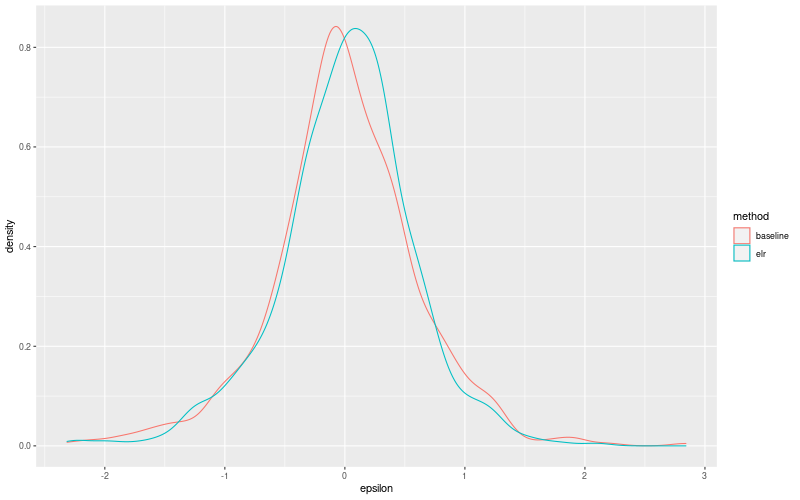
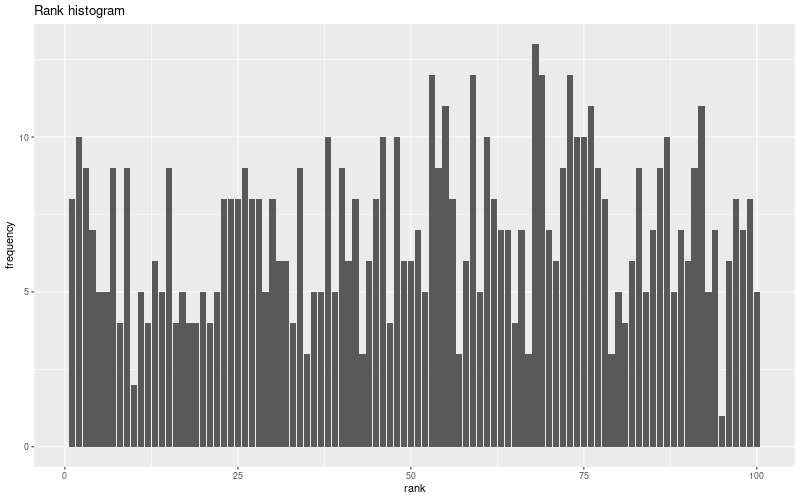
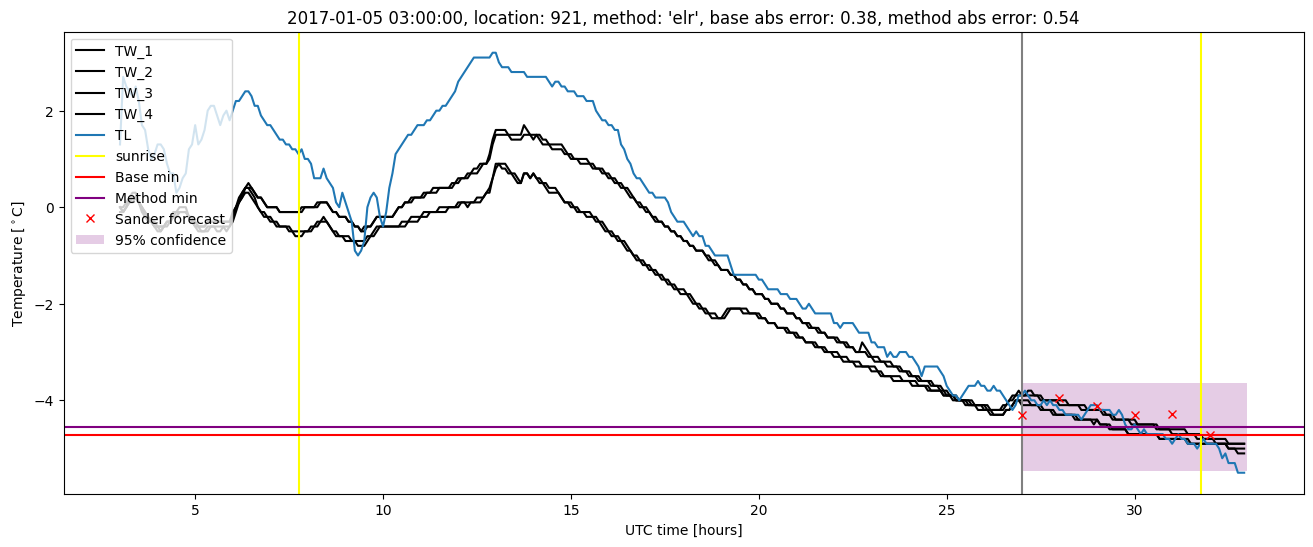
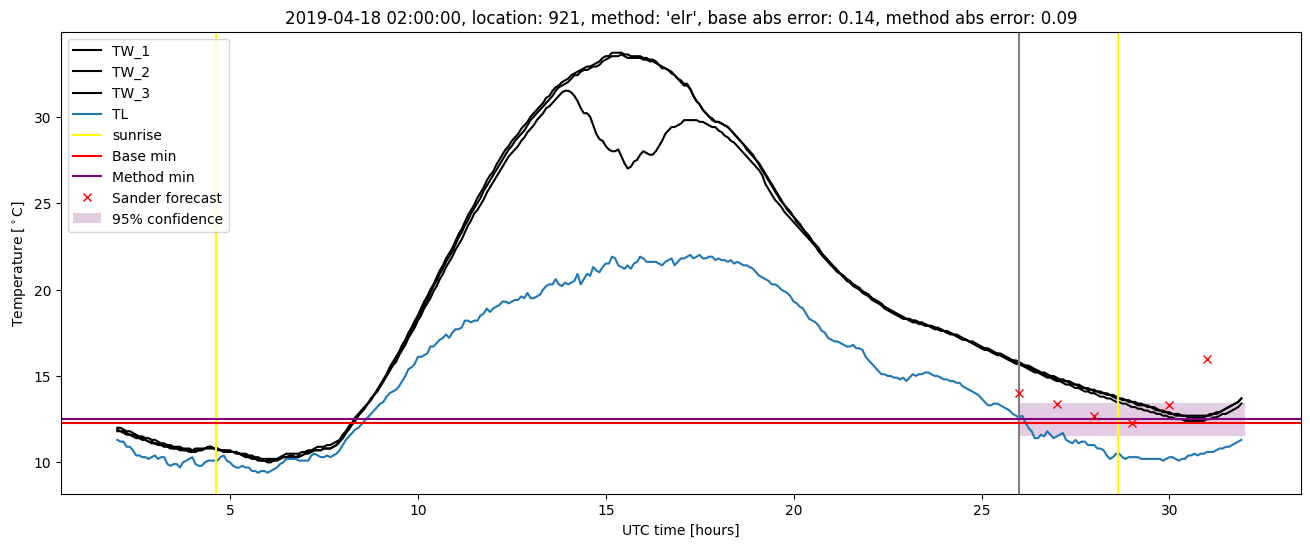
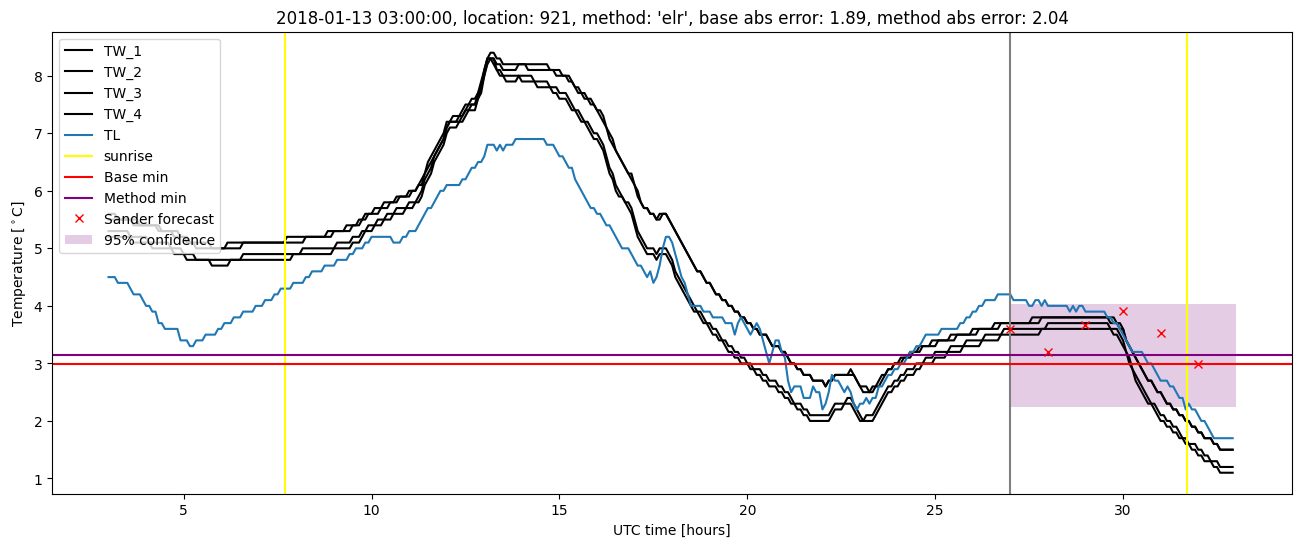
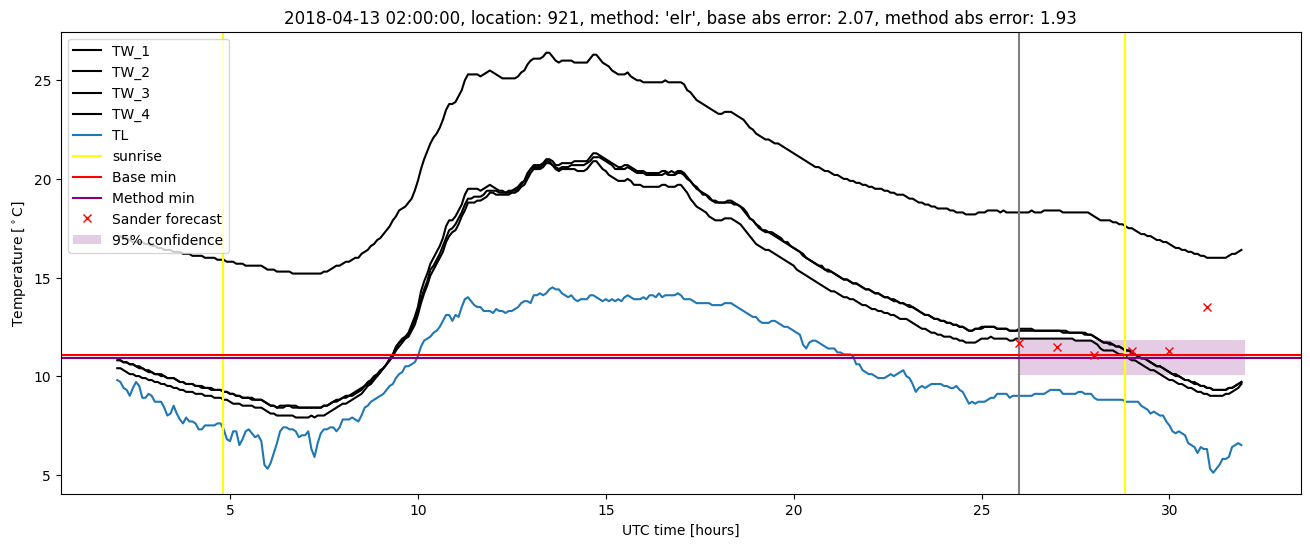
Extended logistic regression plots