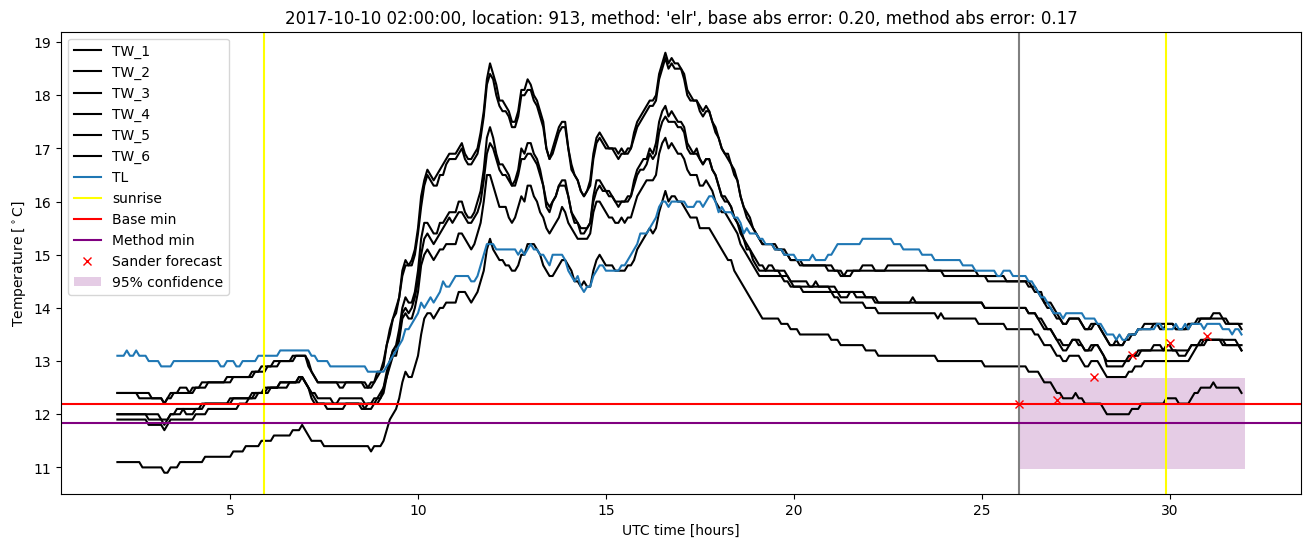
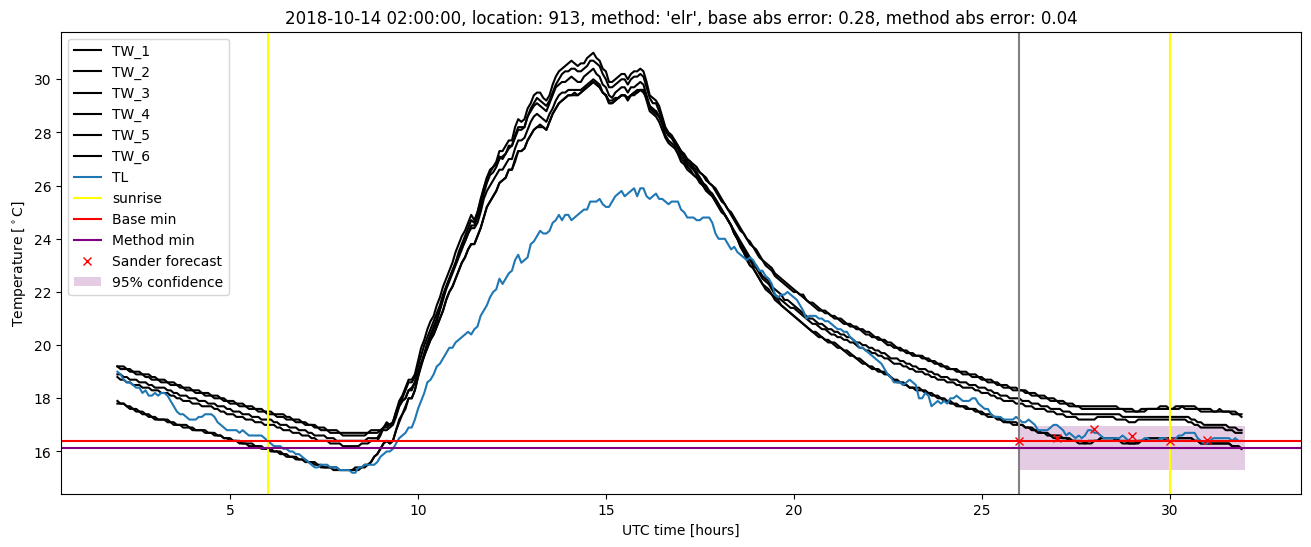
GMS location: 913
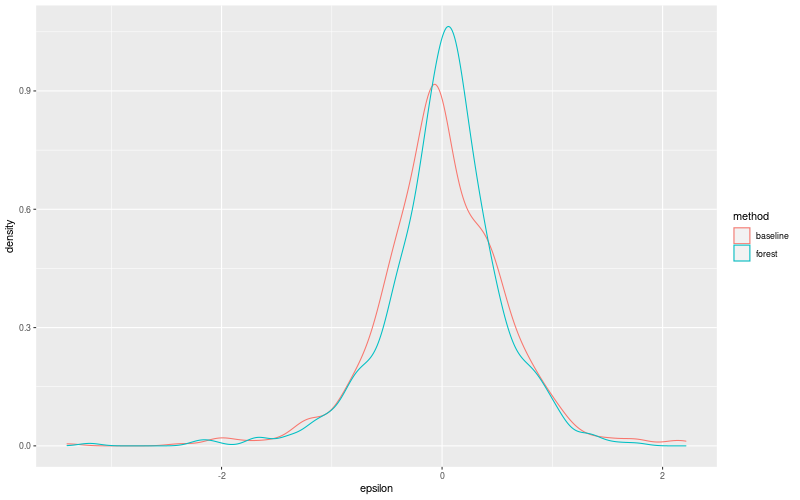
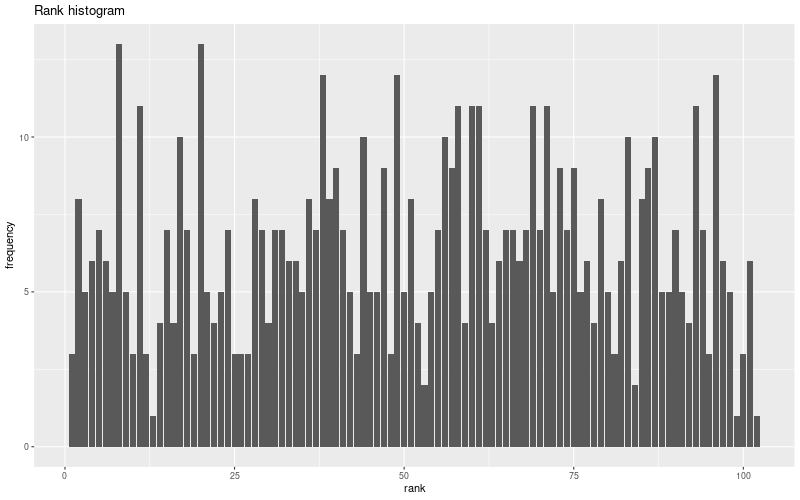
Random forest results
| names |
period |
power |
significance |
meanSquareError |
absError |
maxError |
CRPS |
IGN |
| baseline |
winter 2016 |
0.988 |
0.000e+00 |
0.315 |
0.433 |
1.790 |
NaN |
NaN |
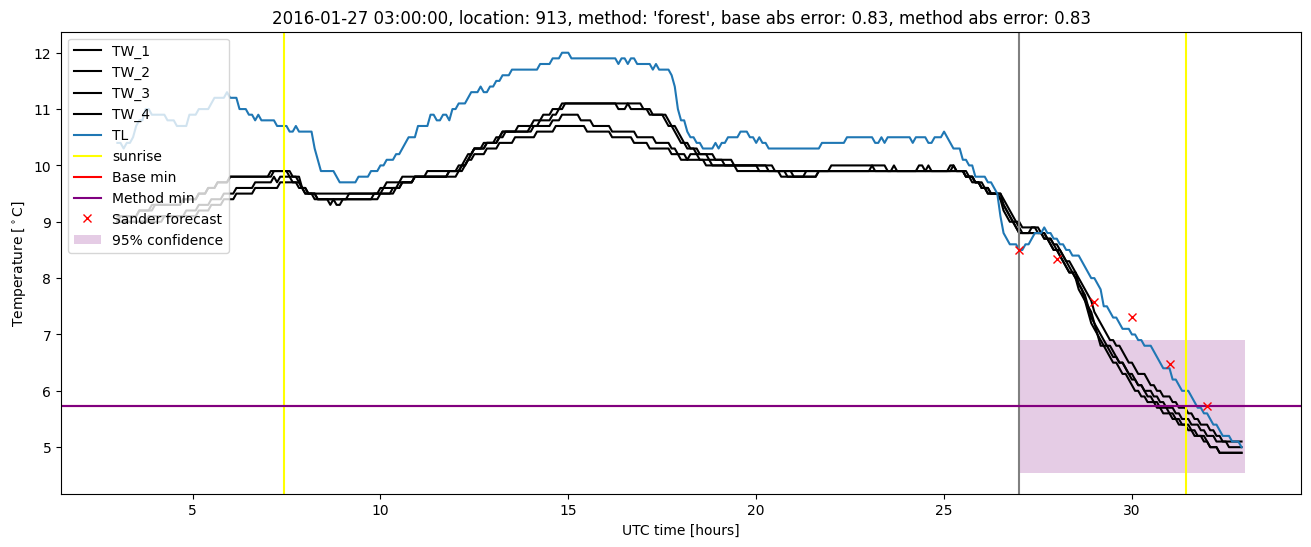
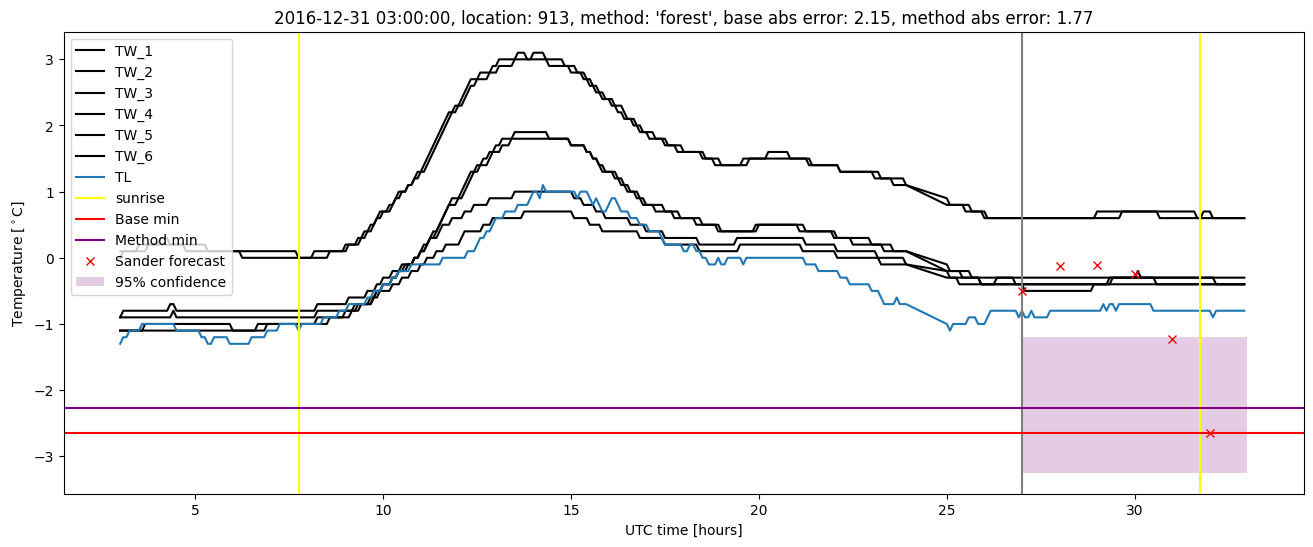
| forest |
winter 2016 |
0.994 |
0.105 |
0.251 |
0.372 |
1.590 |
0.503 |
3.326 |
| baseline |
winter 2017 |
0.954 |
0.029 |
0.317 |
0.404 |
2.370 |
NaN |
NaN |
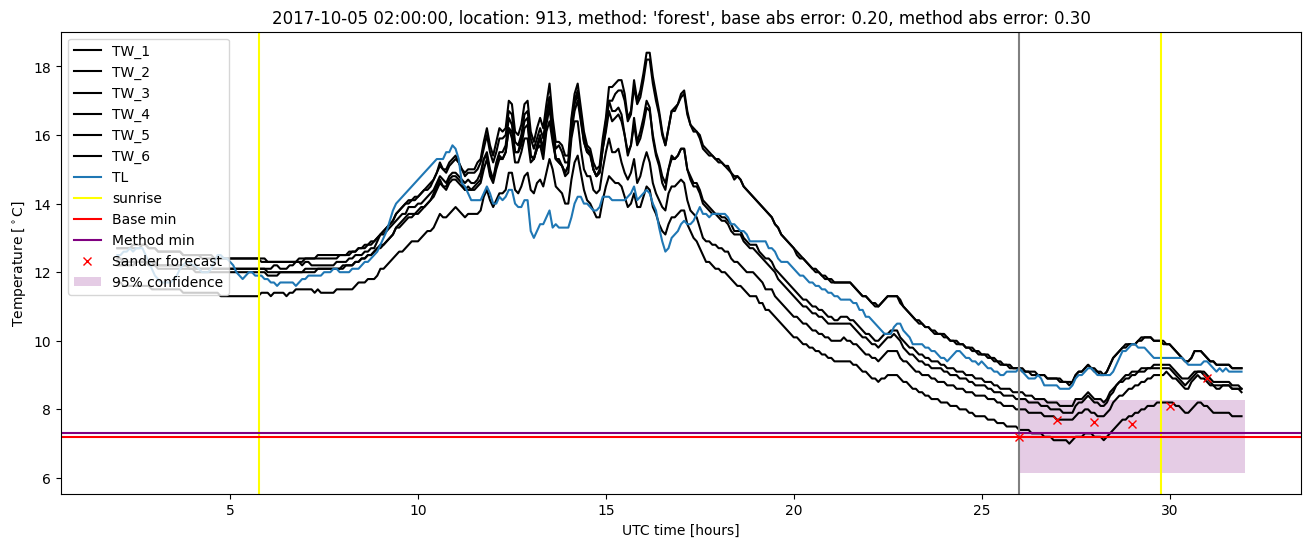
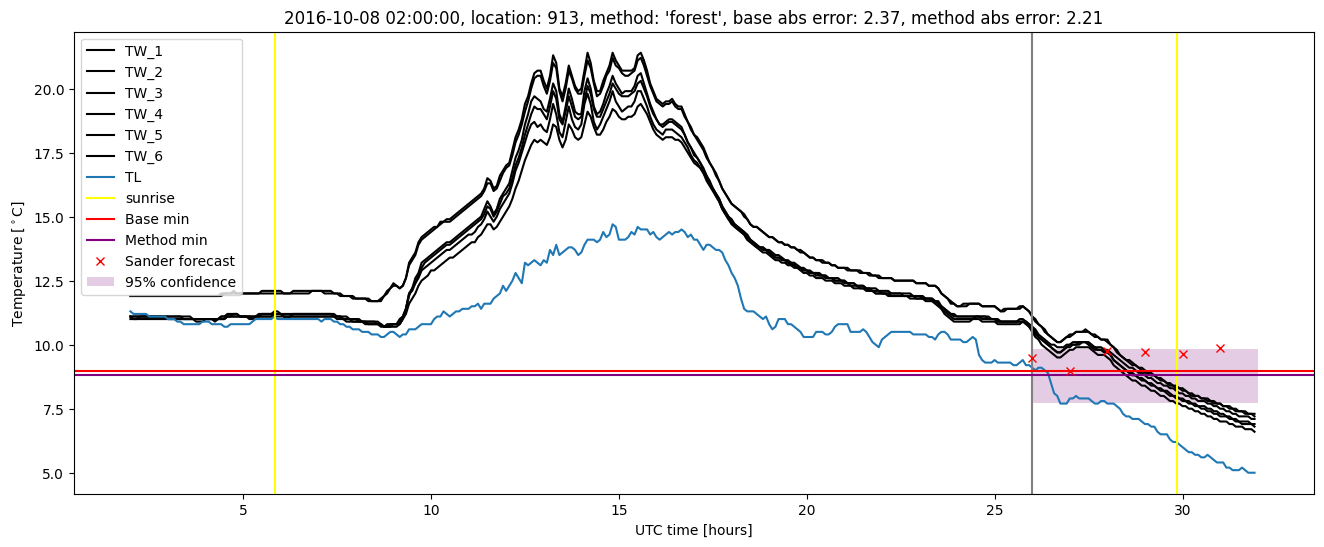
| forest |
winter 2017 |
0.954 |
0.029 |
0.242 |
0.348 |
2.215 |
0.465 |
3.012 |
| baseline |
winter 2018 |
0.993 |
0.031 |
0.312 |
0.402 |
2.095 |
NaN |
NaN |
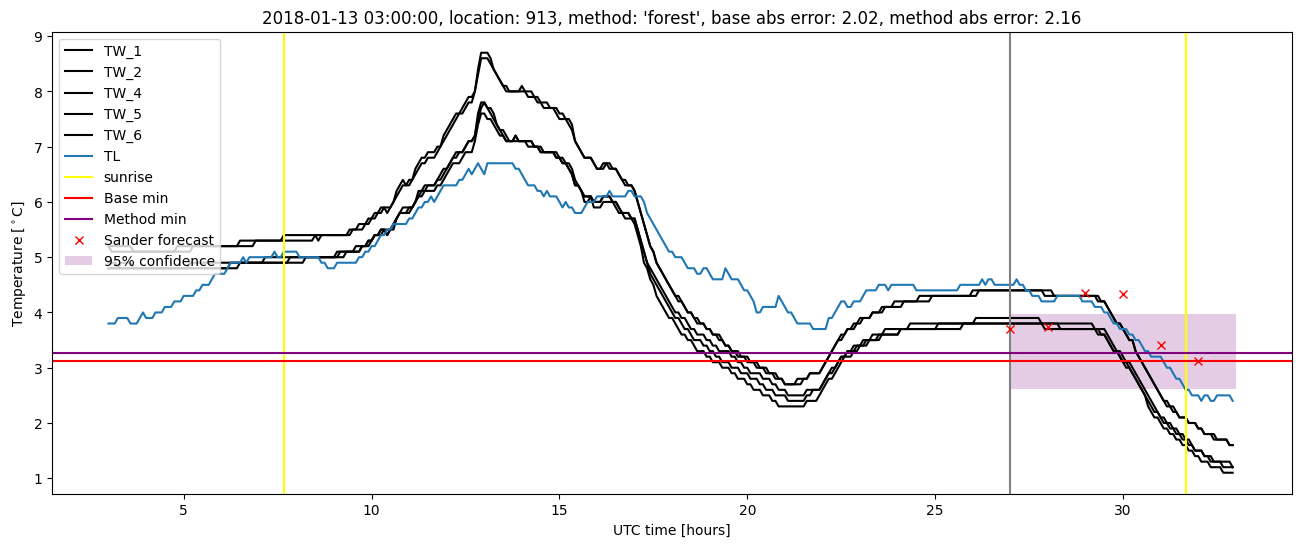
| forest |
winter 2018 |
0.993 |
0.062 |
0.266 |
0.381 |
2.164 |
0.498 |
3.276 |
| baseline |
winter 2019 |
0.993 |
0.067 |
0.446 |
0.462 |
3.401 |
NaN |
NaN |
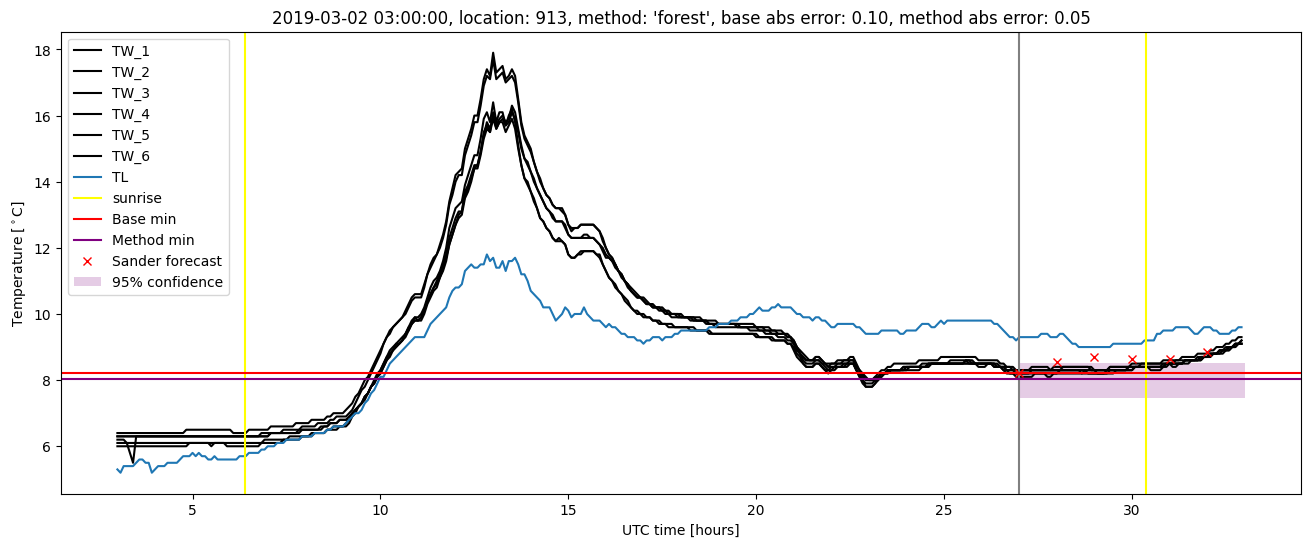
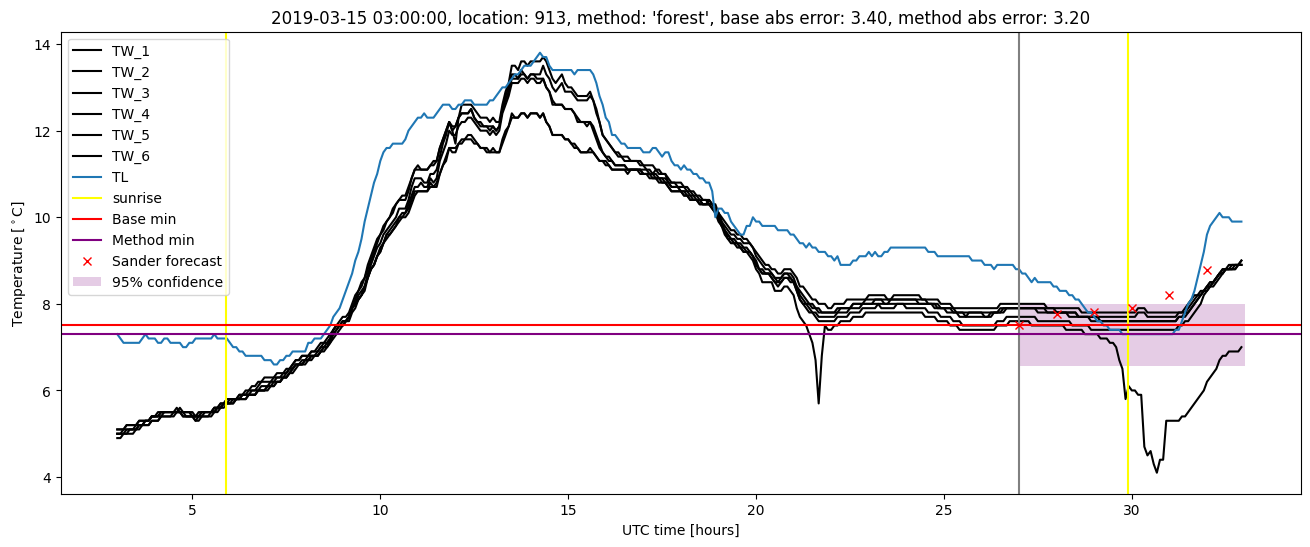
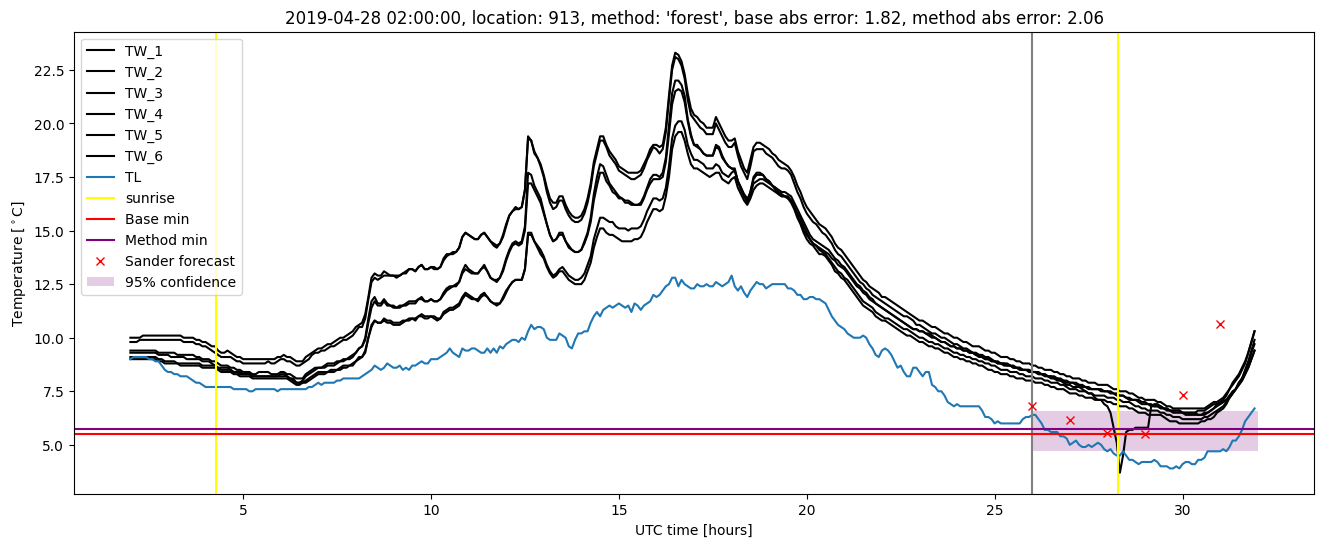
| forest |
winter 2019 |
0.993 |
0.133 |
0.350 |
0.403 |
3.196 |
0.480 |
4.297 |
| baseline |
all |
0.984 |
0.030 |
0.345 |
0.425 |
3.401 |
NaN |
NaN |
| forest |
all |
0.986 |
0.069 |
0.276 |
0.377 |
3.196 |
0.488 |
3.471 |
Random forest plots
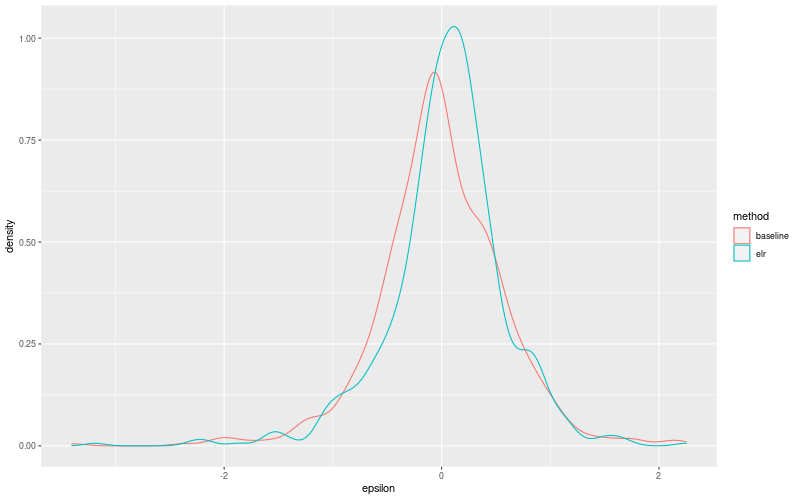
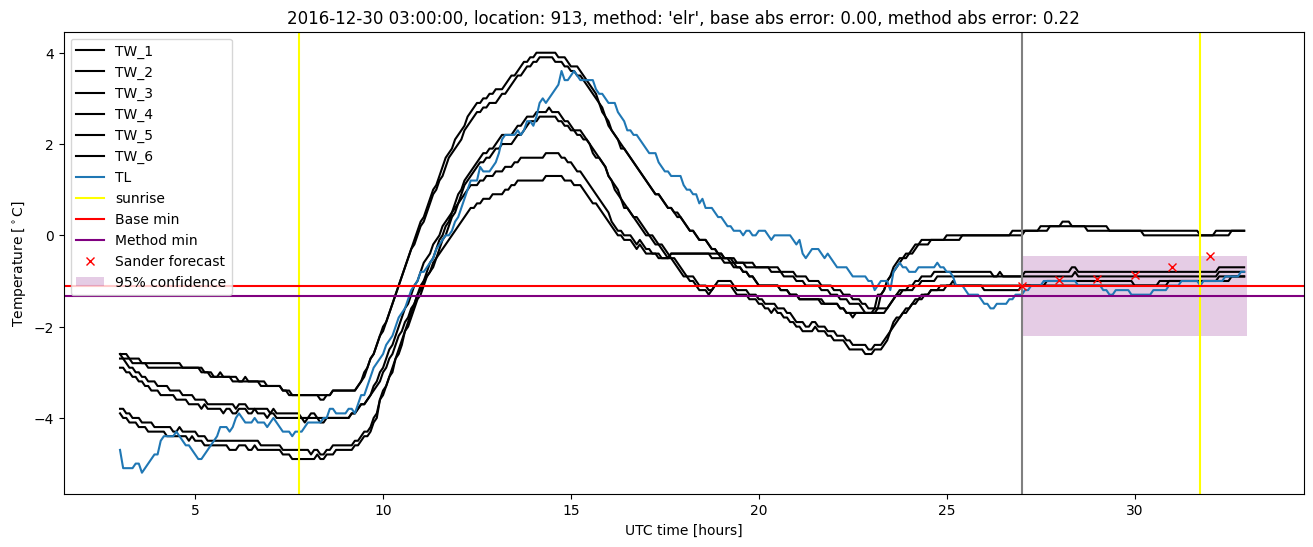
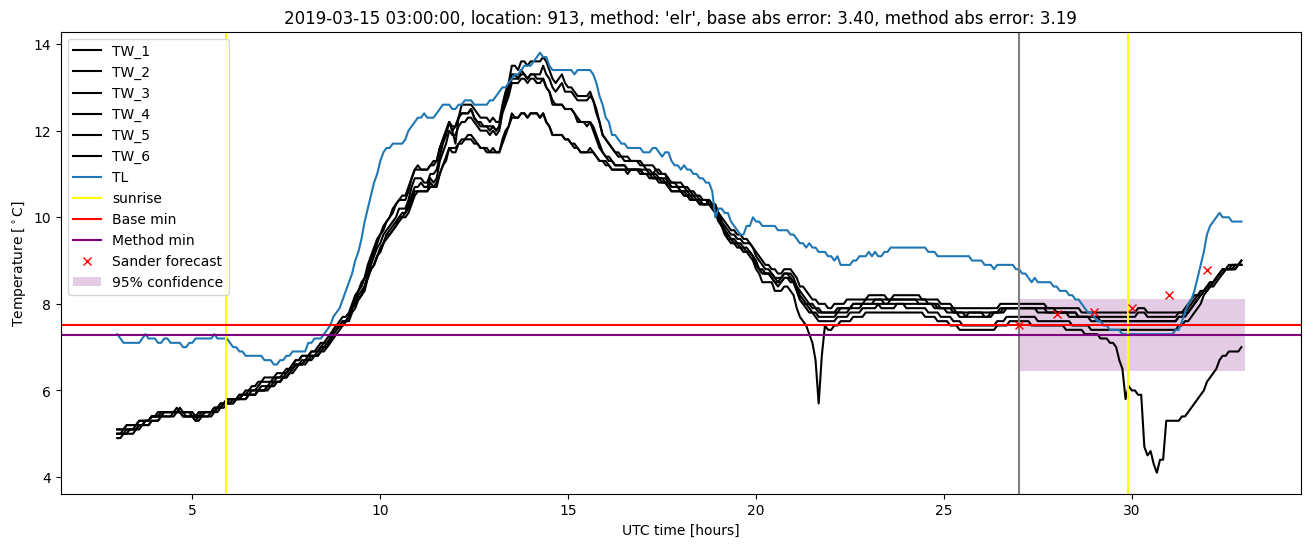
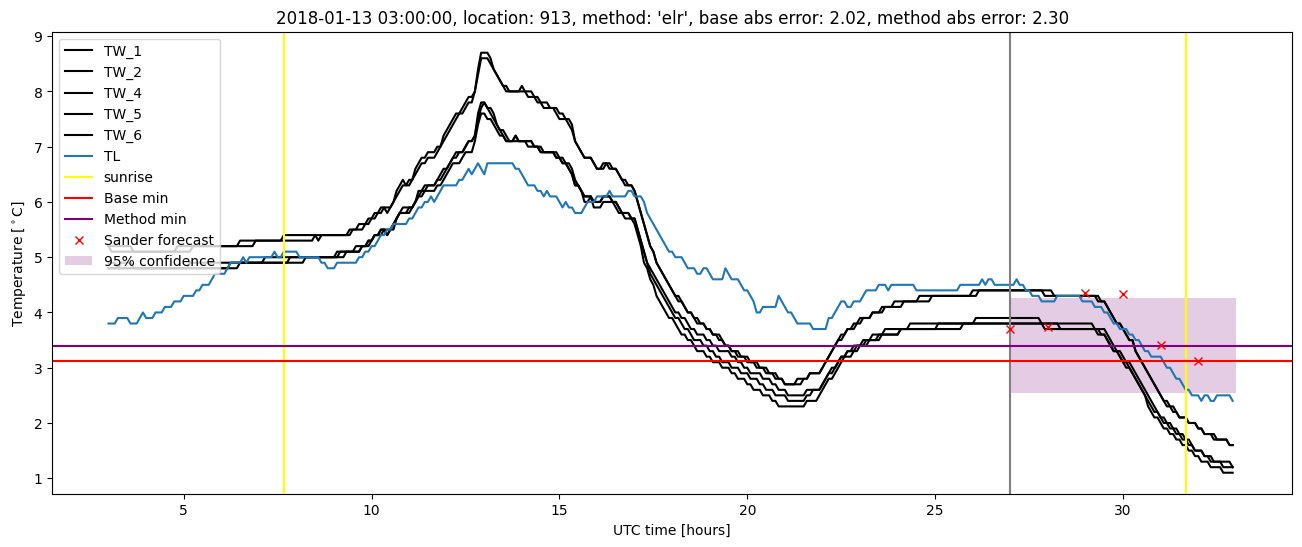
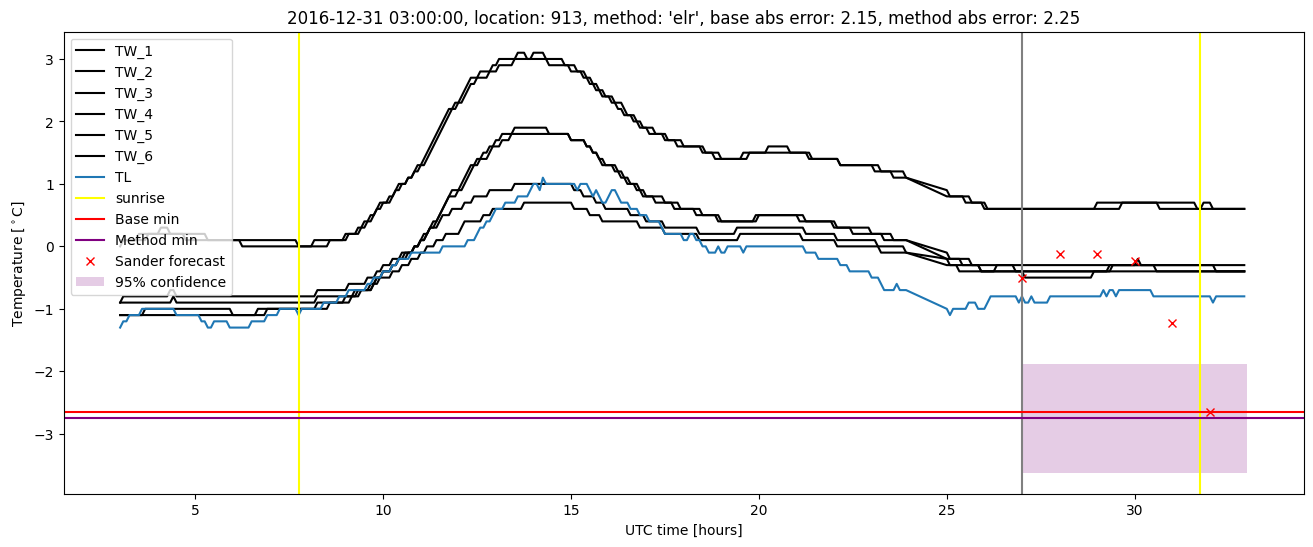
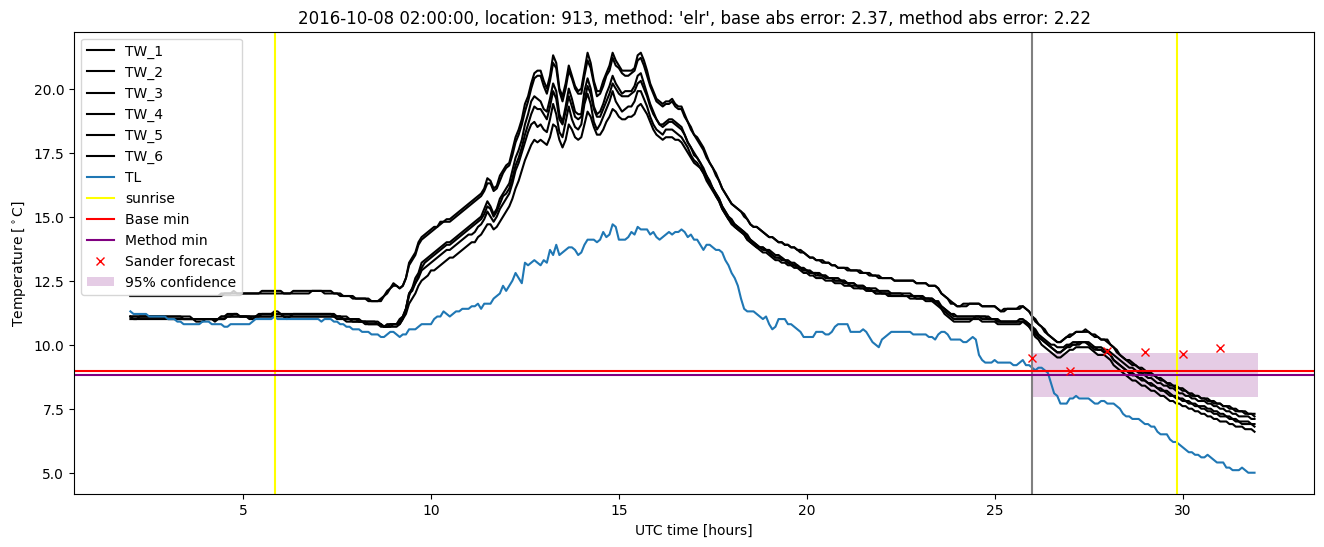
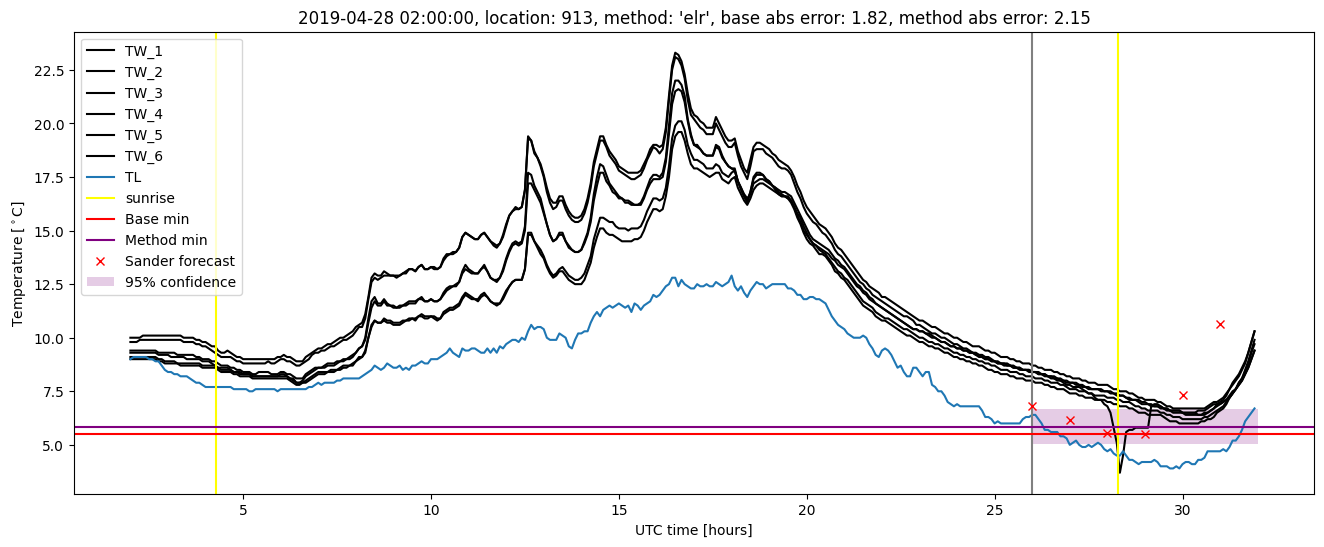
Extended logistic regression results
| names |
period |
power |
significance |
meanSquareError |
absError |
maxError |
CRPS |
IGN |
| baseline |
winter 2016 |
0.988 |
0.000e+00 |
0.315 |
0.433 |
1.790 |
NaN |
NaN |
| elr |
winter 2016 |
0.981 |
0.053 |
0.275 |
0.394 |
1.626 |
0.576 |
4.517 |
| baseline |
winter 2017 |
0.954 |
0.029 |
0.317 |
0.404 |
2.370 |
NaN |
NaN |
| elr |
winter 2017 |
0.963 |
0.057 |
0.272 |
0.378 |
2.250 |
0.538 |
4.417 |
| baseline |
winter 2018 |
0.993 |
0.031 |
0.312 |
0.402 |
2.095 |
NaN |
NaN |
| elr |
winter 2018 |
0.993 |
0.062 |
0.284 |
0.383 |
2.299 |
0.552 |
4.839 |
| baseline |
winter 2019 |
0.993 |
0.067 |
0.446 |
0.462 |
3.401 |
NaN |
NaN |
| elr |
winter 2019 |
0.993 |
0.133 |
0.354 |
0.397 |
3.187 |
0.549 |
5.472 |
| baseline |
all |
0.984 |
0.030 |
0.345 |
0.425 |
3.401 |
NaN |
NaN |
| elr |
all |
0.984 |
0.069 |
0.295 |
0.388 |
3.187 |
0.555 |
4.806 |
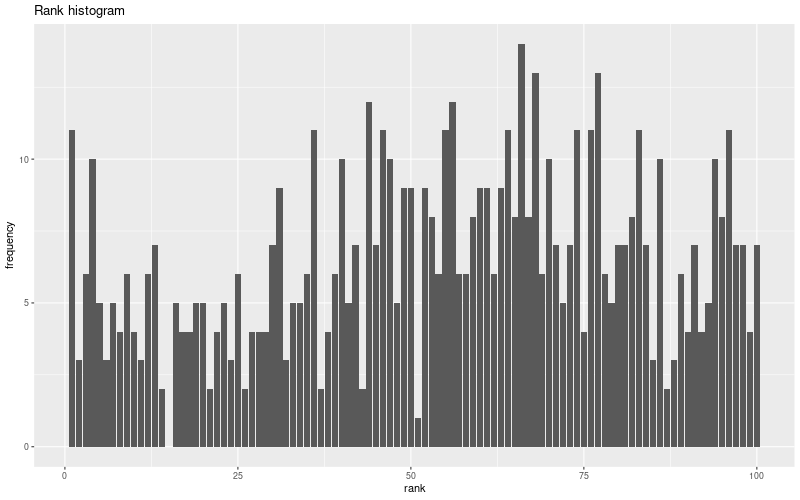
Extended logistic regression plots