GMS location: 912
Random forest results
| names |
period |
power |
significance |
meanSquareError |
absError |
maxError |
CRPS |
IGN |
| baseline |
winter 2016 |
0.979 |
0.062 |
0.328 |
0.431 |
2.402 |
NaN |
NaN |
| forest |
winter 2016 |
0.995 |
0.062 |
0.267 |
0.389 |
2.616 |
0.478 |
3.311 |
| baseline |
winter 2017 |
0.975 |
0.088 |
0.358 |
0.449 |
2.254 |
NaN |
NaN |
| forest |
winter 2017 |
0.983 |
0.176 |
0.278 |
0.387 |
1.943 |
0.470 |
3.591 |
| baseline |
winter 2018 |
0.993 |
0.094 |
0.412 |
0.450 |
3.268 |
NaN |
NaN |
| forest |
winter 2018 |
0.993 |
0.125 |
0.362 |
0.417 |
3.288 |
0.462 |
3.155 |
| baseline |
winter 2019 |
0.960 |
0.000e+00 |
0.371 |
0.447 |
2.518 |
NaN |
NaN |
| forest |
winter 2019 |
0.960 |
0.000e+00 |
0.254 |
0.377 |
1.947 |
0.451 |
2.609 |
| baseline |
all |
0.977 |
0.076 |
0.366 |
0.444 |
3.268 |
NaN |
NaN |
| forest |
all |
0.984 |
0.120 |
0.291 |
0.393 |
3.288 |
0.466 |
3.171 |
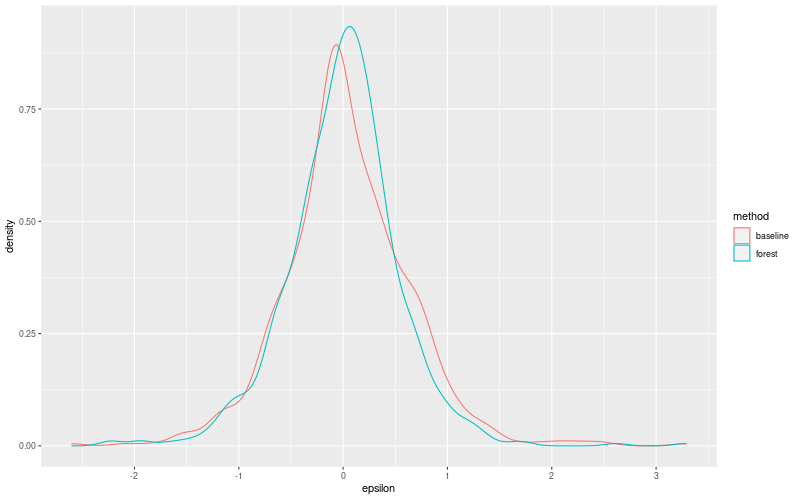
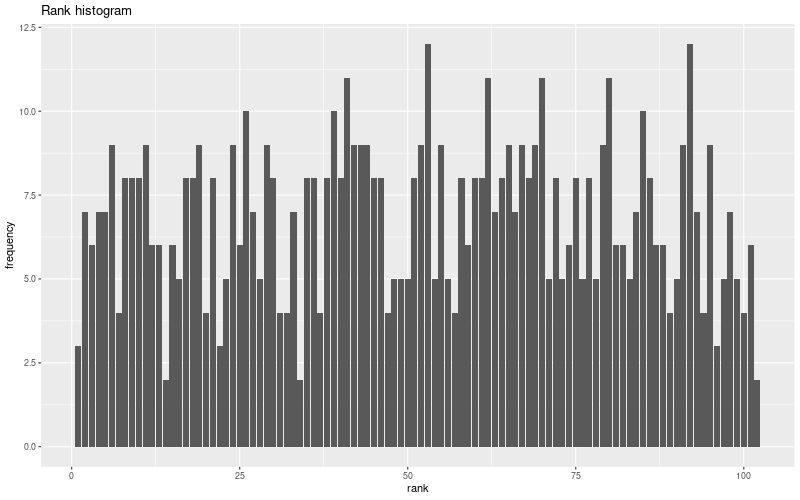
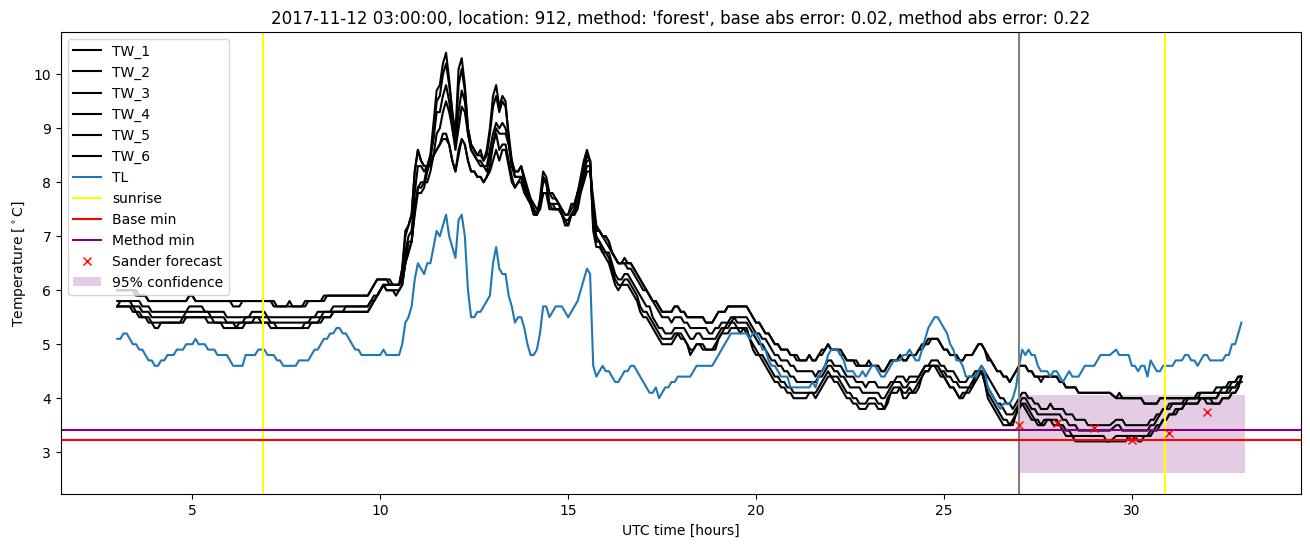
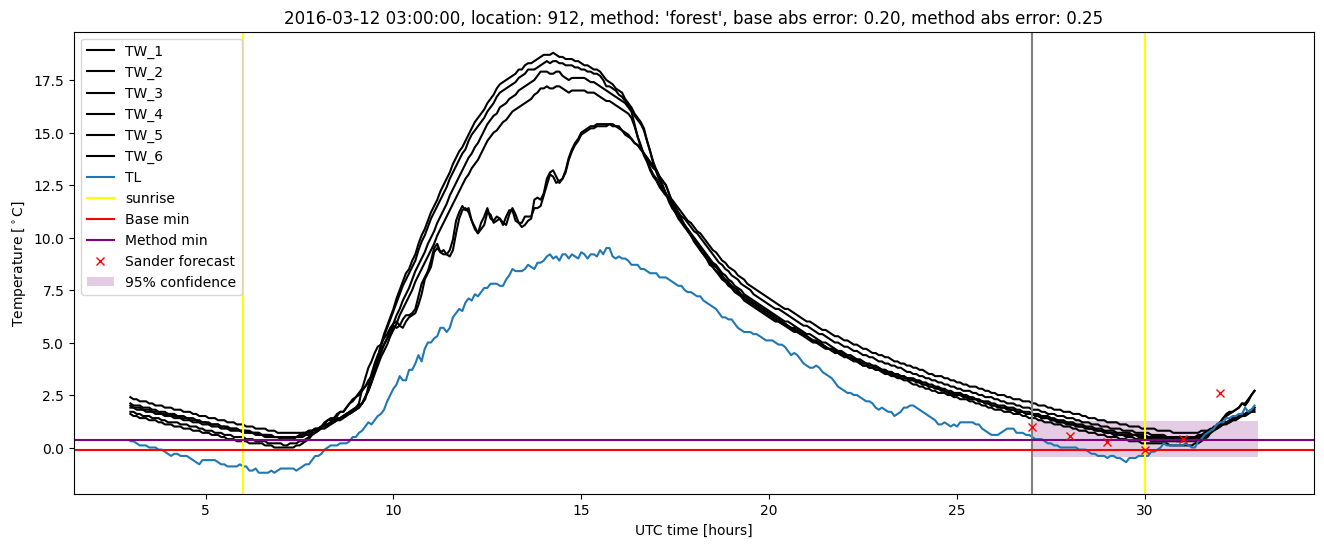
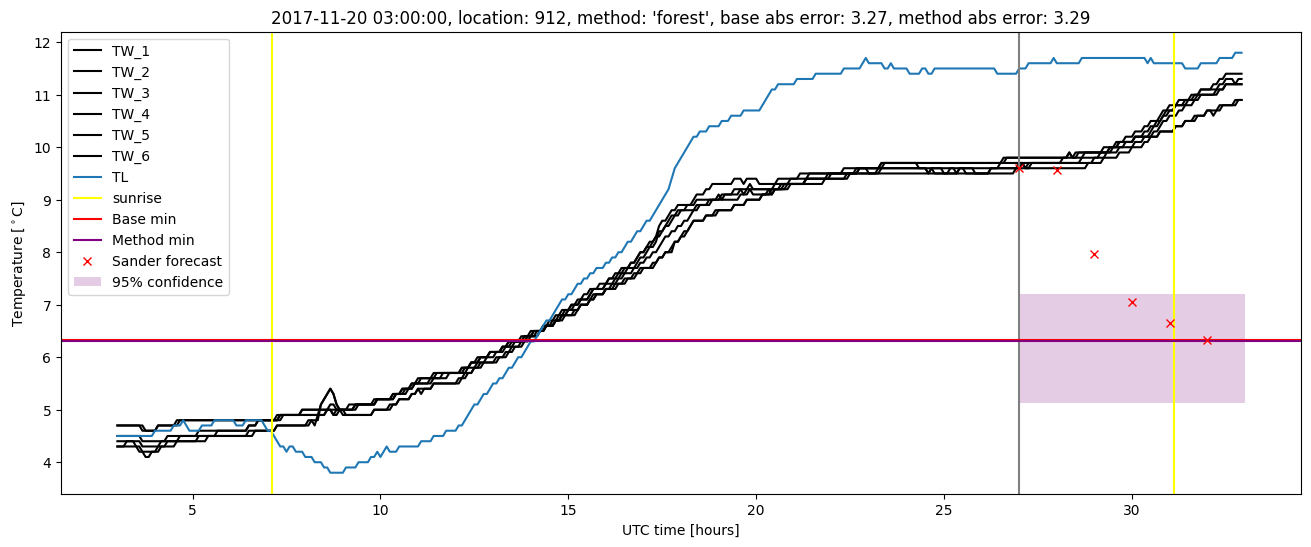
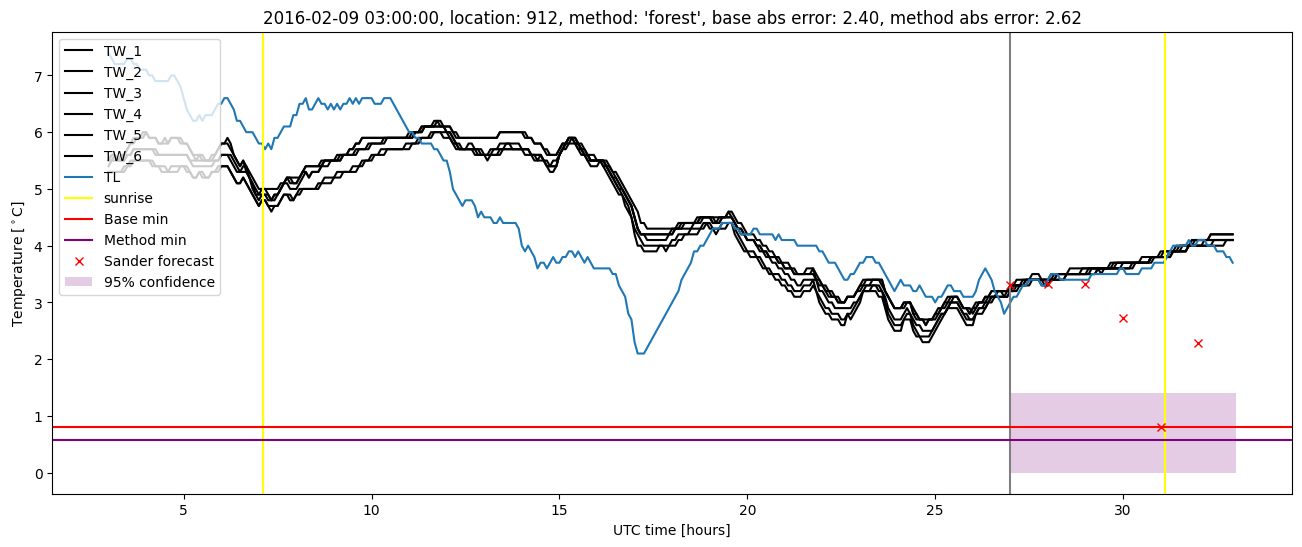
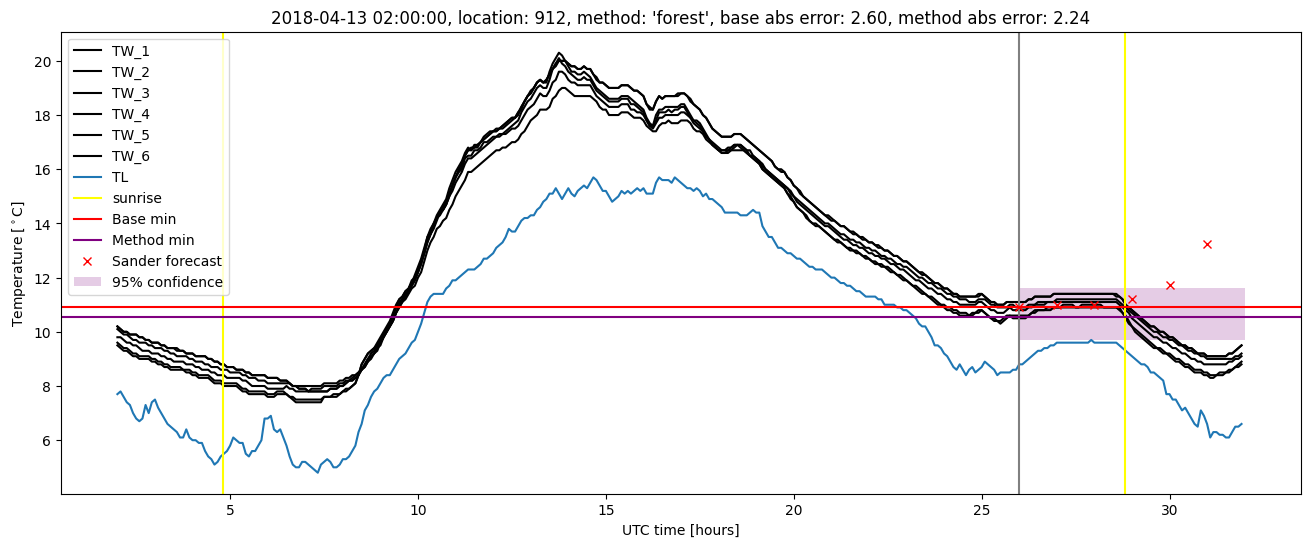
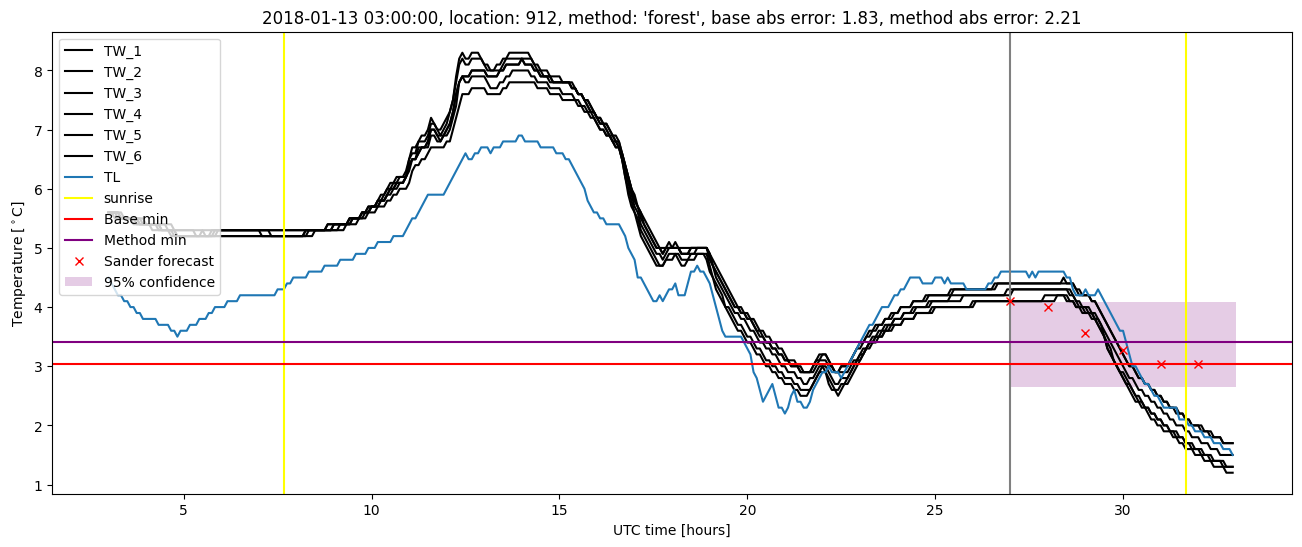
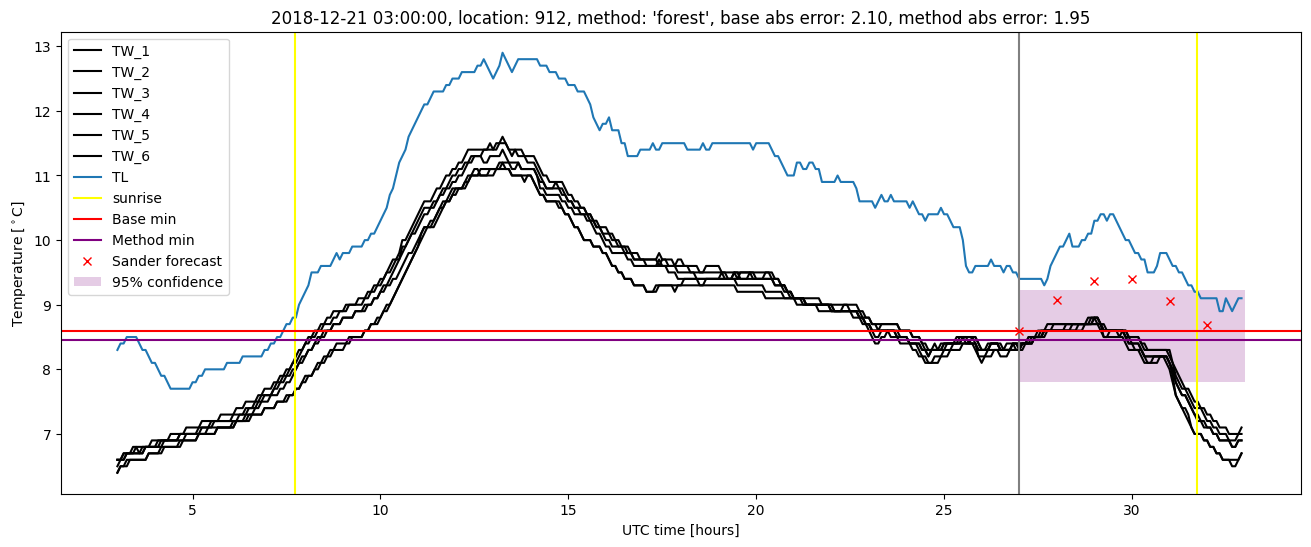
Random forest plots

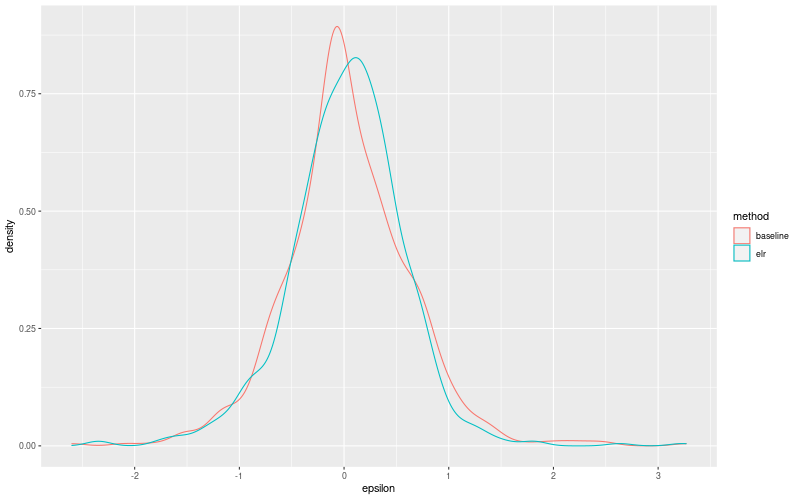
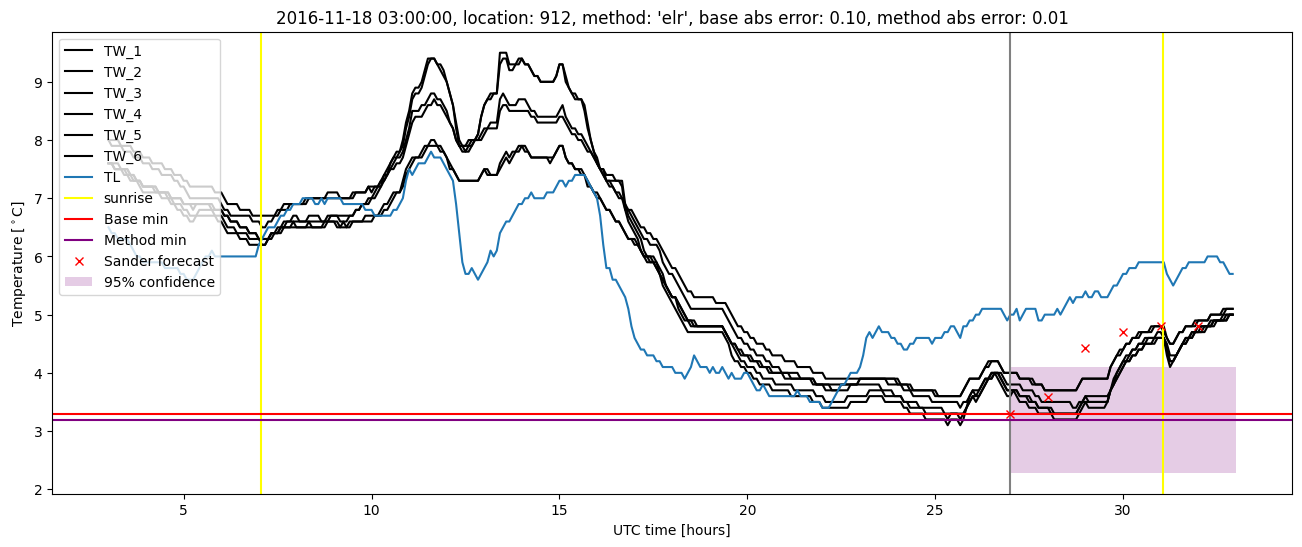
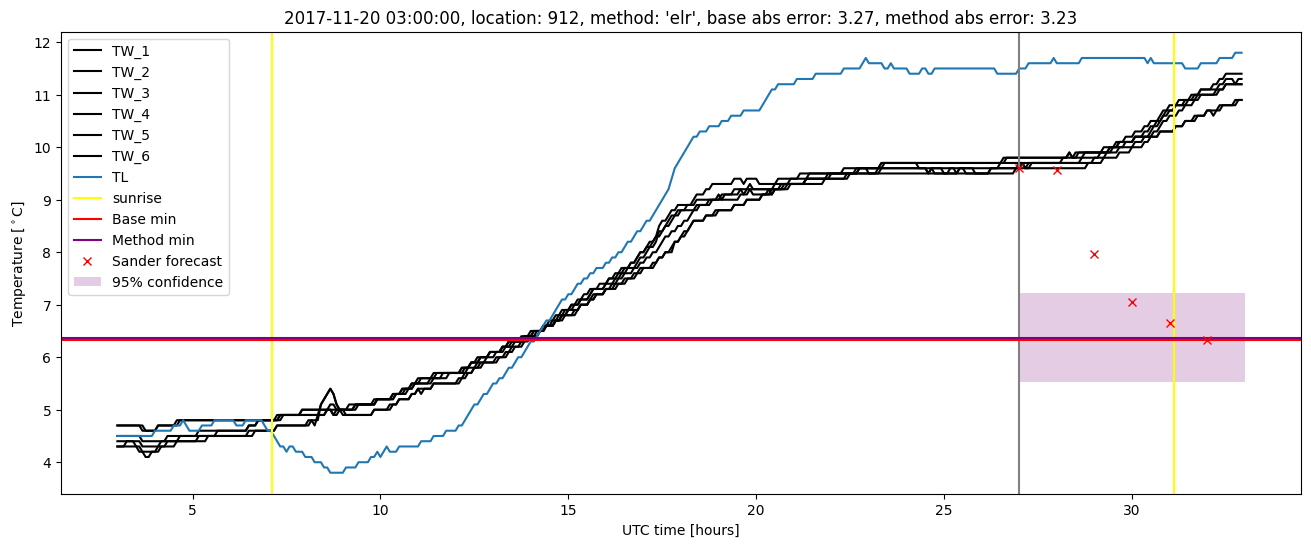
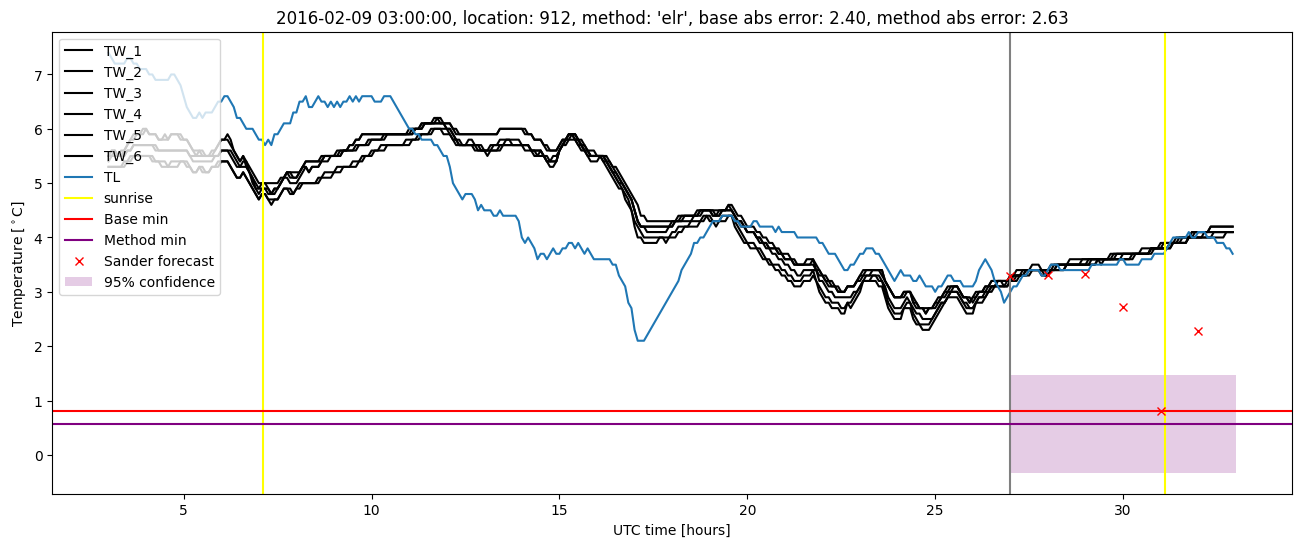
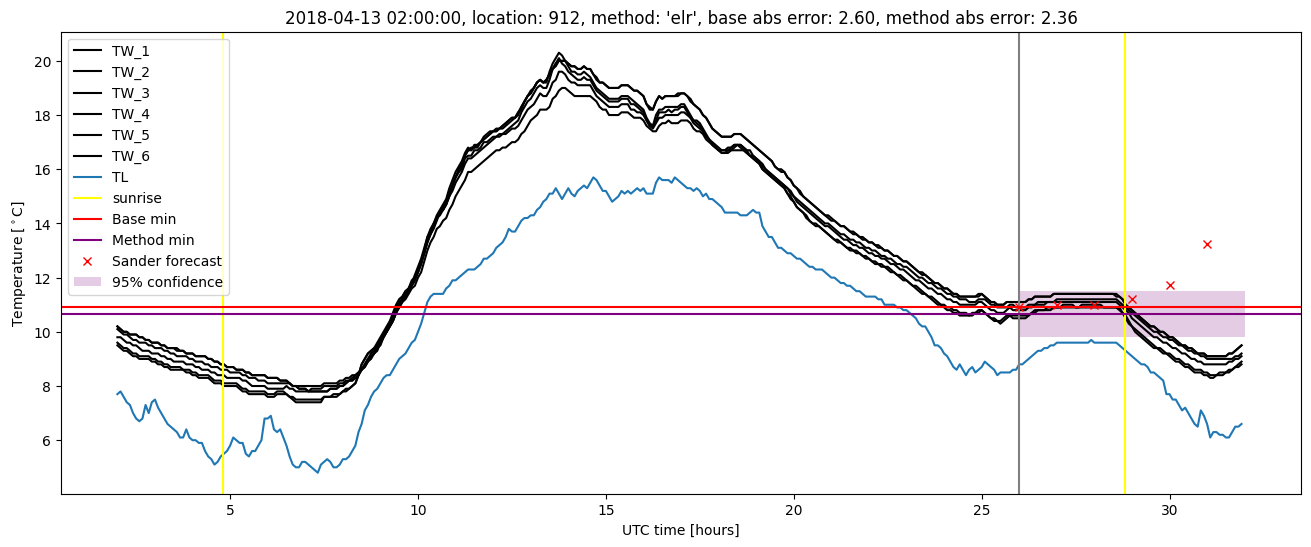
Extended logistic regression results
| names |
period |
power |
significance |
meanSquareError |
absError |
maxError |
CRPS |
IGN |
| baseline |
winter 2016 |
0.979 |
0.062 |
0.328 |
0.431 |
2.402 |
NaN |
NaN |
| elr |
winter 2016 |
0.990 |
0.062 |
0.283 |
0.399 |
2.631 |
0.561 |
4.299 |
| baseline |
winter 2017 |
0.975 |
0.088 |
0.358 |
0.449 |
2.254 |
NaN |
NaN |
| elr |
winter 2017 |
0.983 |
0.088 |
0.273 |
0.389 |
1.842 |
0.538 |
3.827 |
| baseline |
winter 2018 |
0.993 |
0.094 |
0.412 |
0.450 |
3.268 |
NaN |
NaN |
| elr |
winter 2018 |
1.000 |
0.125 |
0.376 |
0.431 |
3.229 |
0.512 |
4.292 |
| baseline |
winter 2019 |
0.960 |
0.000e+00 |
0.371 |
0.447 |
2.518 |
NaN |
NaN |
| elr |
winter 2019 |
0.974 |
0.000e+00 |
0.284 |
0.430 |
1.576 |
0.513 |
4.007 |
| baseline |
all |
0.977 |
0.076 |
0.366 |
0.444 |
3.268 |
NaN |
NaN |
| elr |
all |
0.987 |
0.087 |
0.305 |
0.412 |
3.229 |
0.532 |
4.128 |
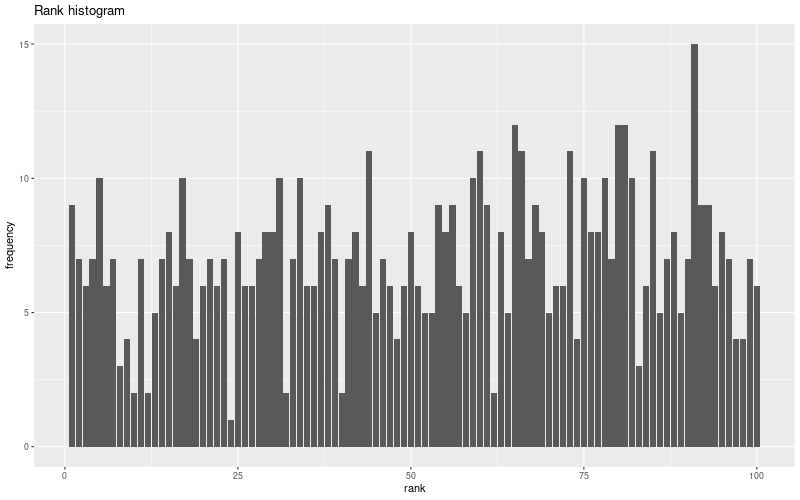
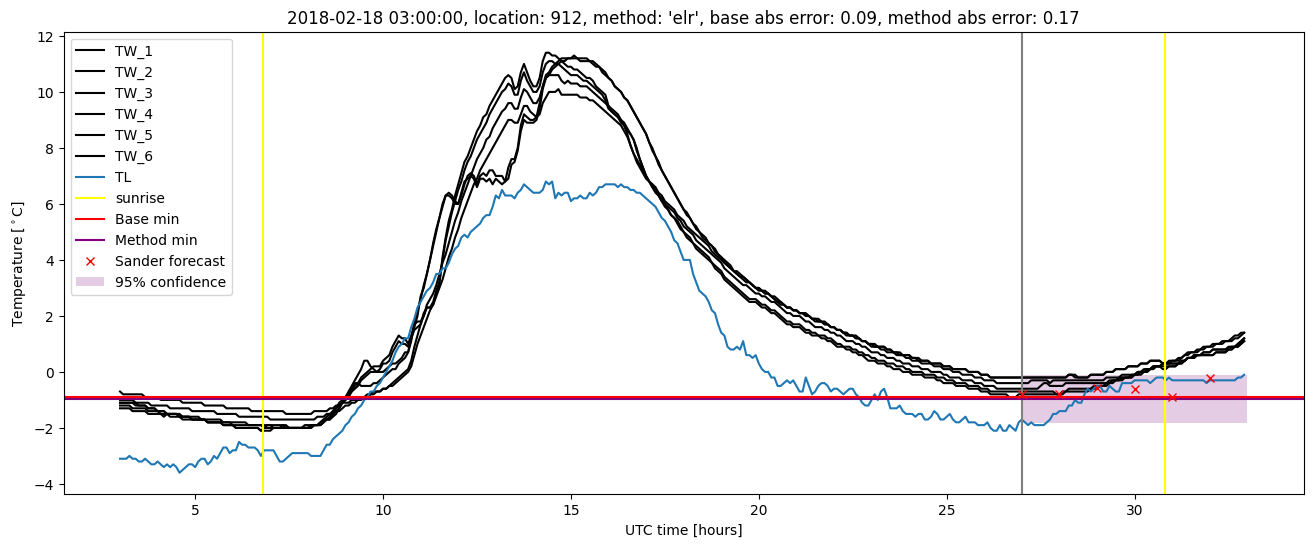
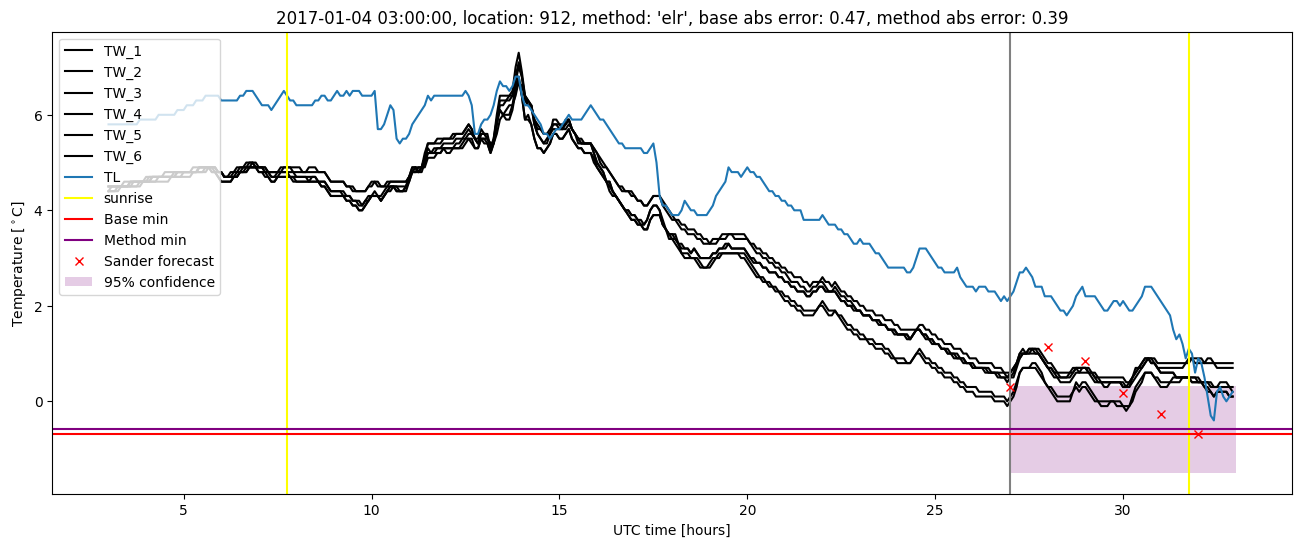
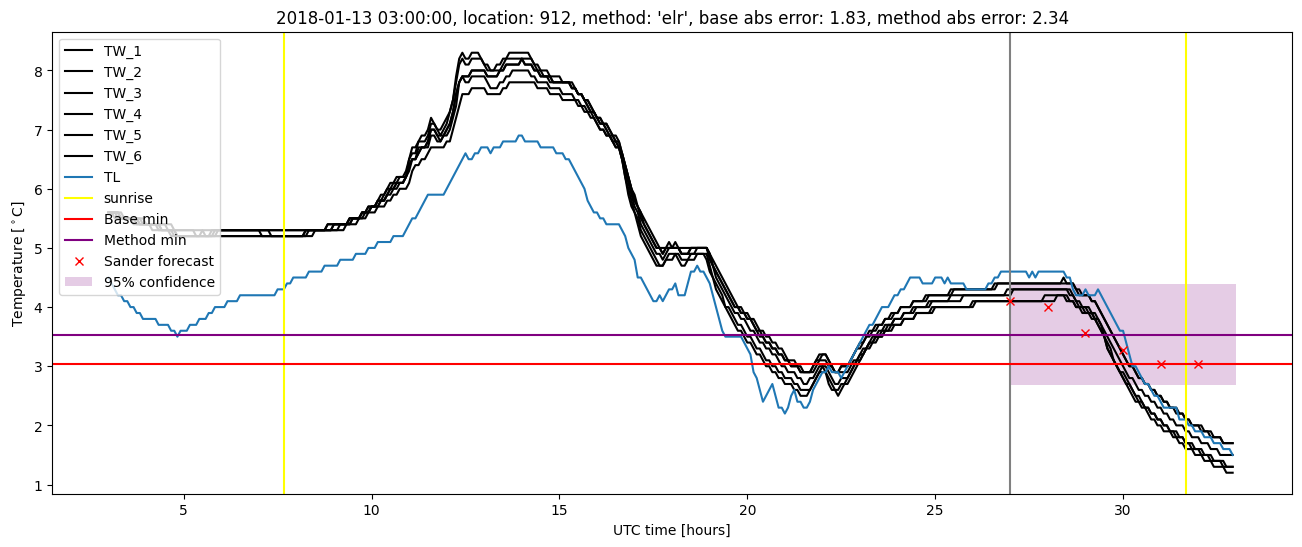
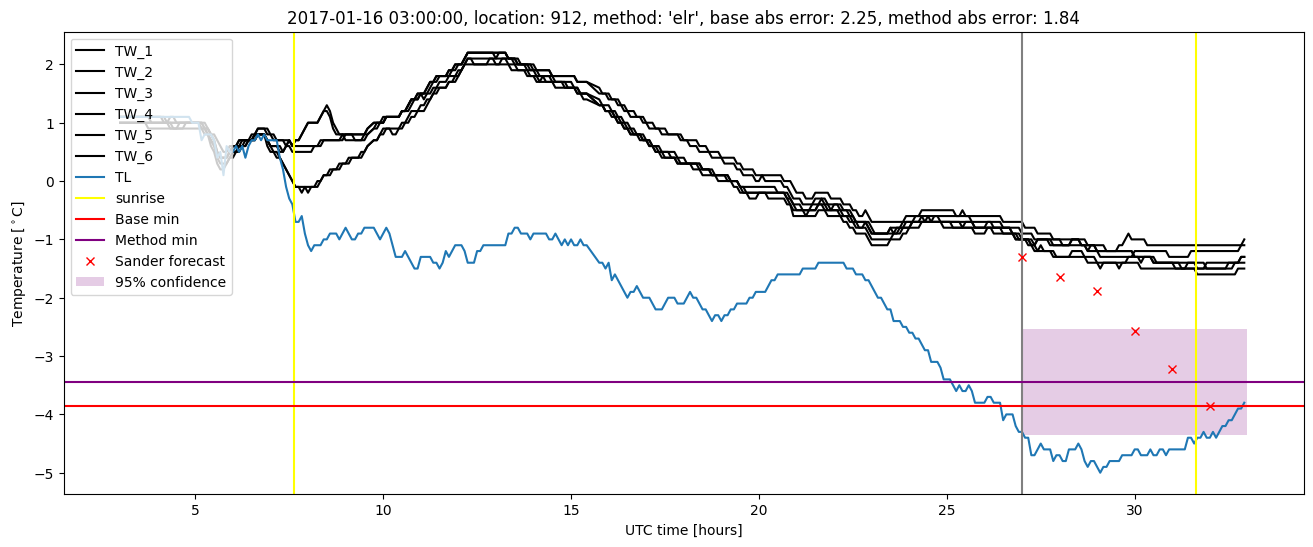
Extended logistic regression plots