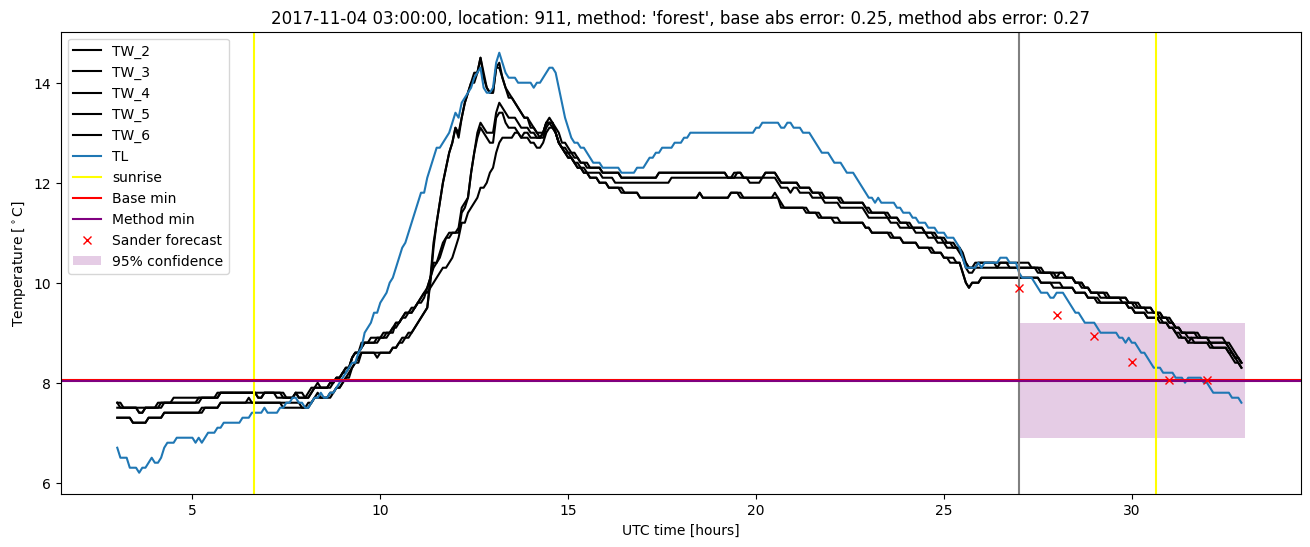
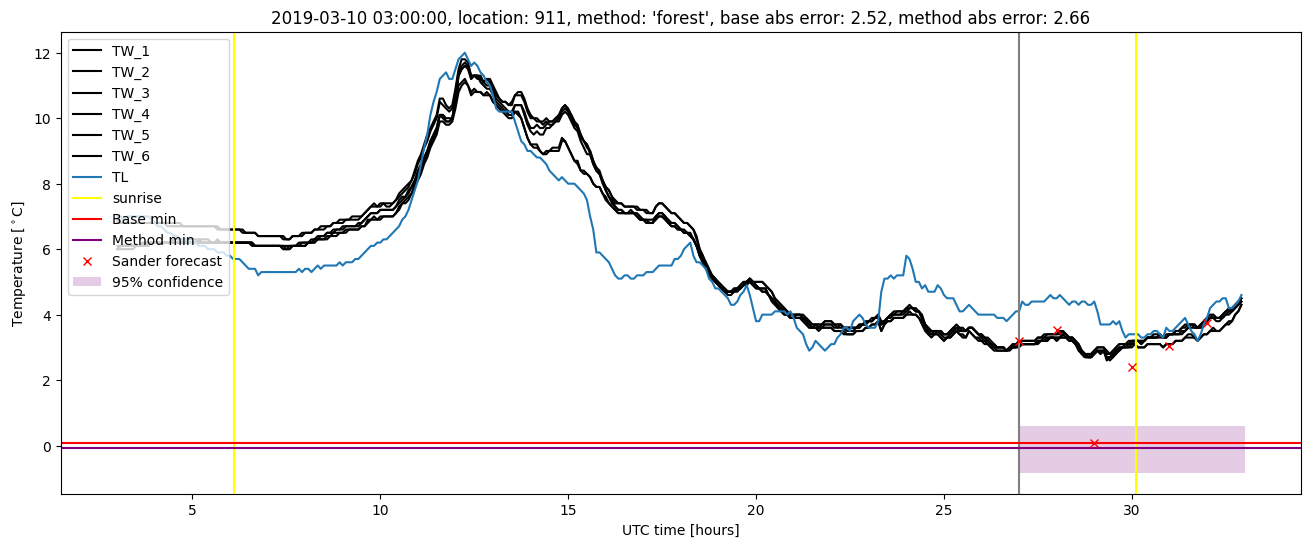
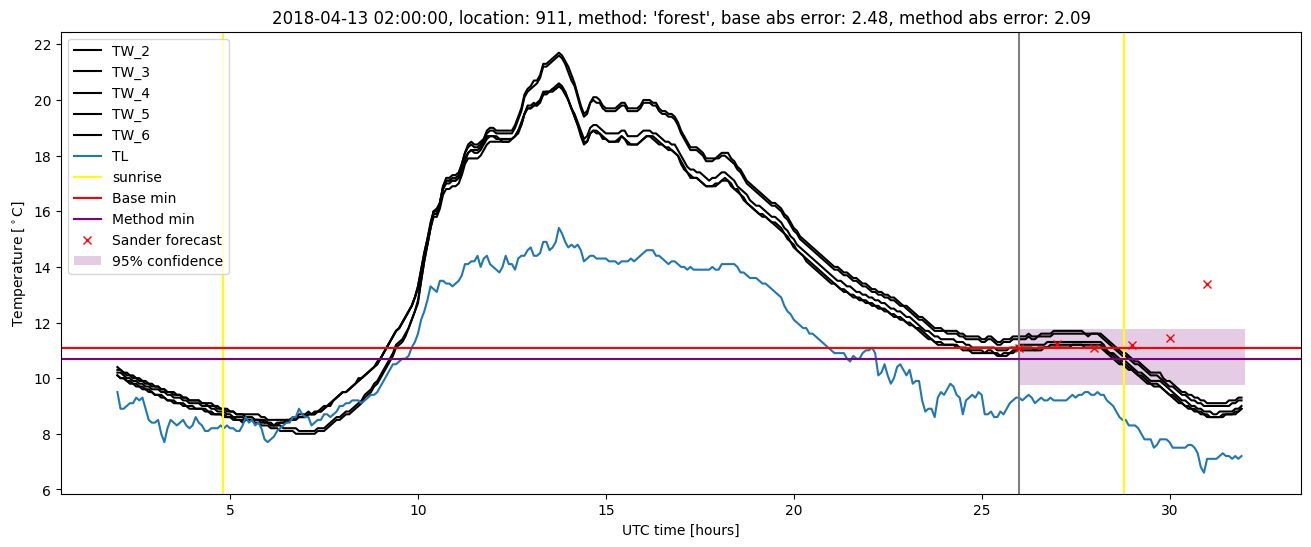
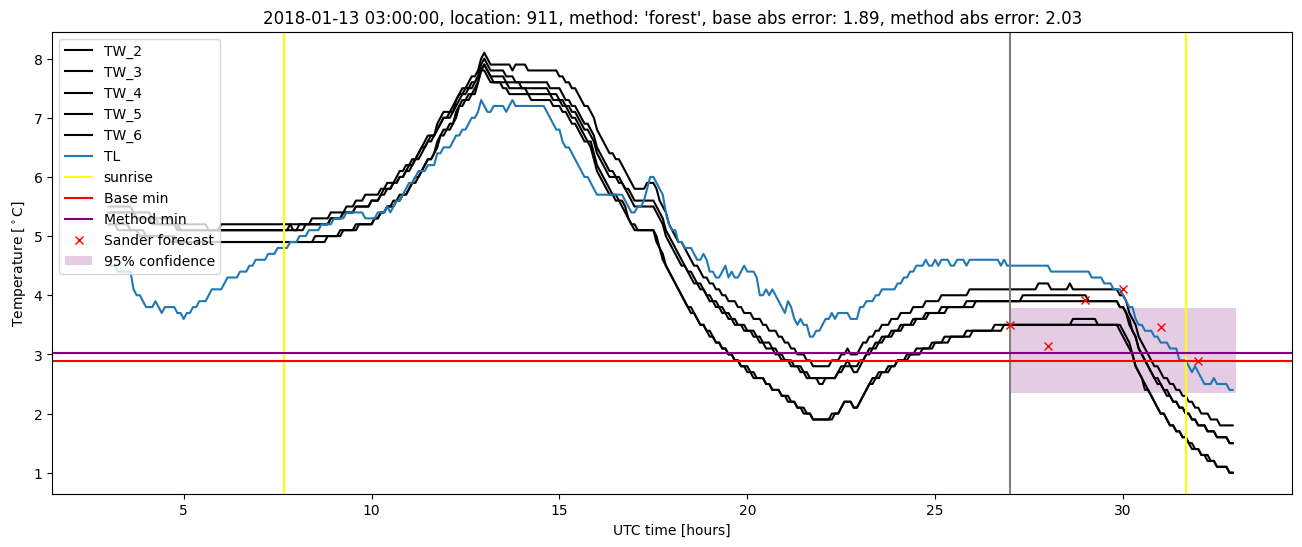
GMS location: 911
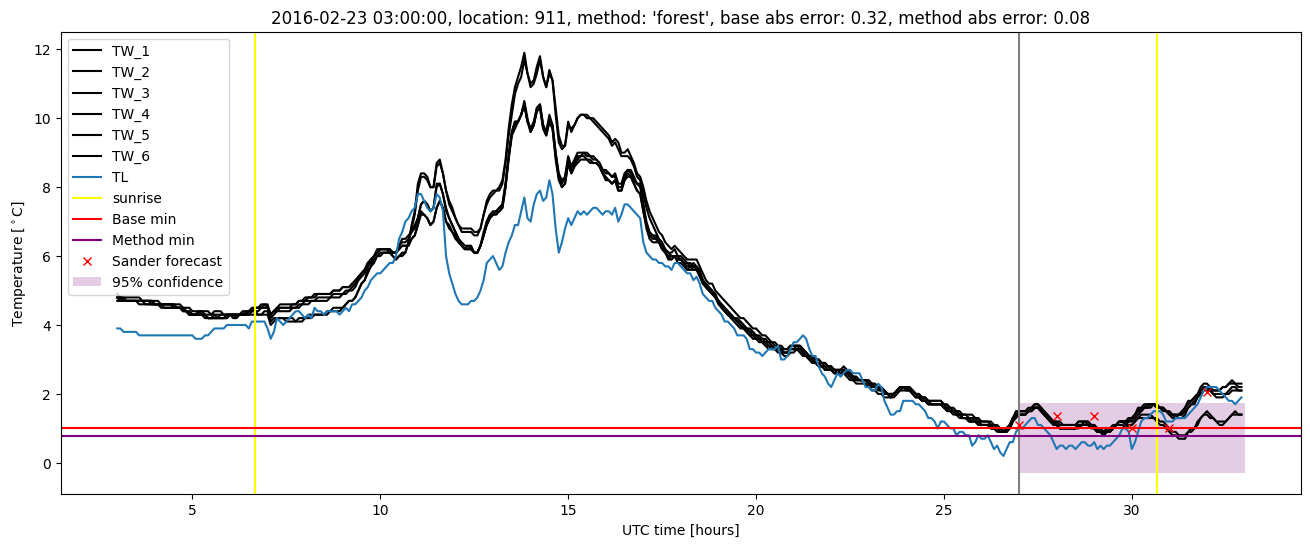
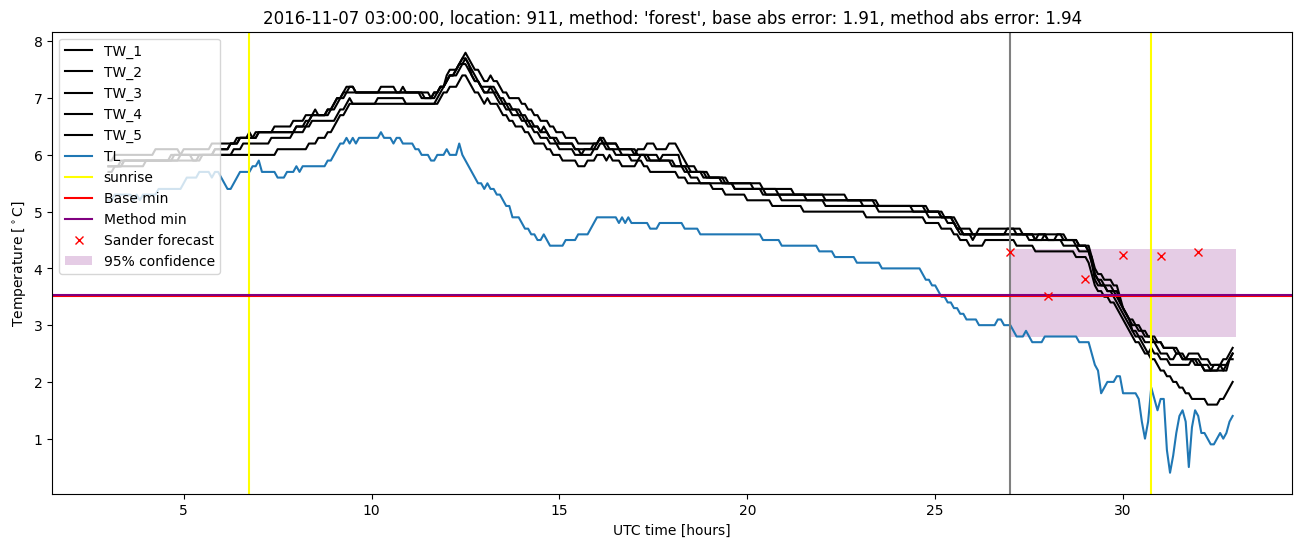
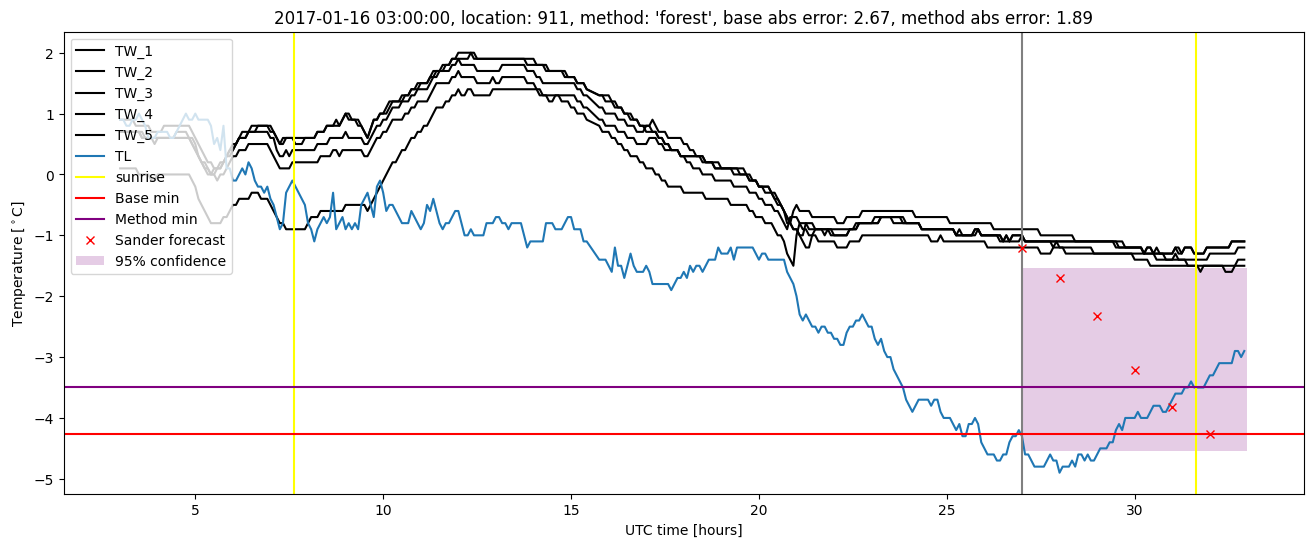
Random forest results
| names |
period |
power |
significance |
meanSquareError |
absError |
maxError |
CRPS |
IGN |
| baseline |
winter 2016 |
0.984 |
0.000e+00 |
0.329 |
0.431 |
1.993 |
NaN |
NaN |
| forest |
winter 2016 |
0.995 |
0.056 |
0.269 |
0.392 |
1.718 |
0.477 |
3.822 |
| baseline |
winter 2017 |
0.957 |
0.026 |
0.386 |
0.457 |
2.667 |
NaN |
NaN |
| forest |
winter 2017 |
0.948 |
0.026 |
0.316 |
0.410 |
1.939 |
0.464 |
3.643 |
| baseline |
winter 2018 |
0.992 |
0.069 |
0.349 |
0.441 |
2.481 |
NaN |
NaN |
| forest |
winter 2018 |
0.976 |
0.069 |
0.318 |
0.422 |
2.089 |
0.472 |
3.158 |
| baseline |
winter 2019 |
0.986 |
0.000e+00 |
0.340 |
0.407 |
2.739 |
NaN |
NaN |
| forest |
winter 2019 |
0.978 |
0.000e+00 |
0.252 |
0.346 |
2.664 |
0.463 |
2.875 |
| baseline |
all |
0.981 |
0.029 |
0.349 |
0.434 |
2.739 |
NaN |
NaN |
| forest |
all |
0.977 |
0.039 |
0.287 |
0.392 |
2.664 |
0.470 |
3.406 |
Random forest plots

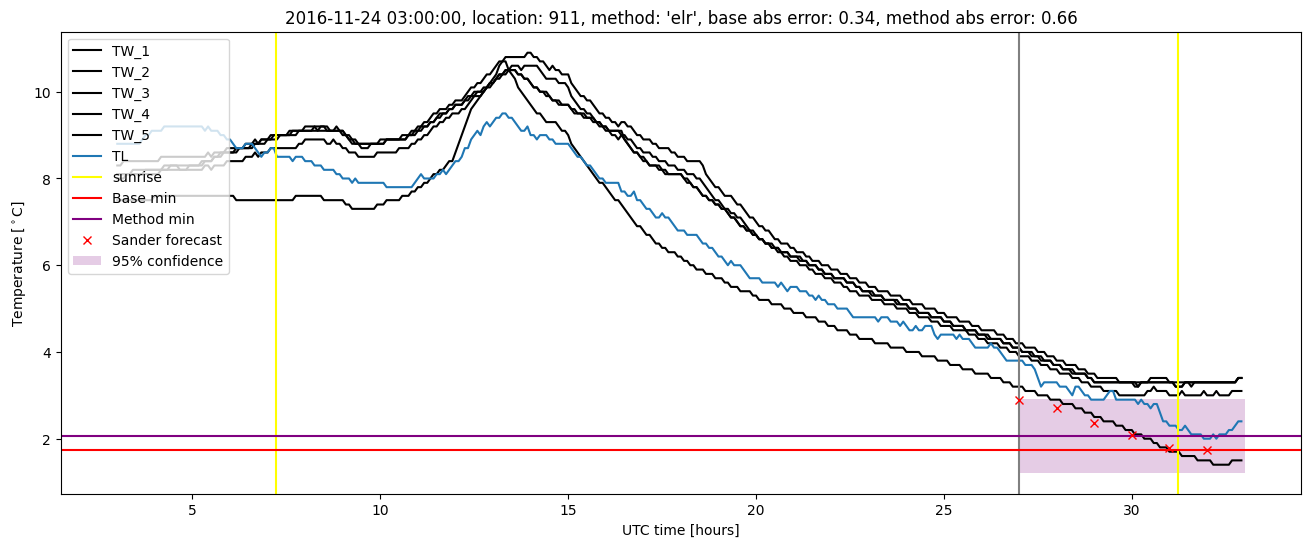
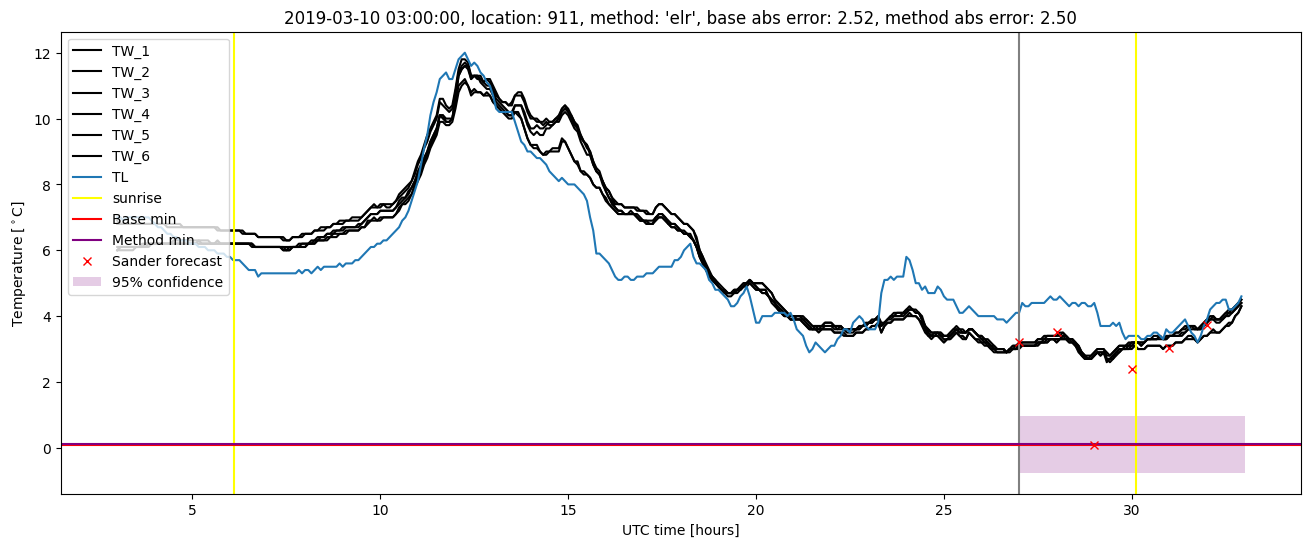
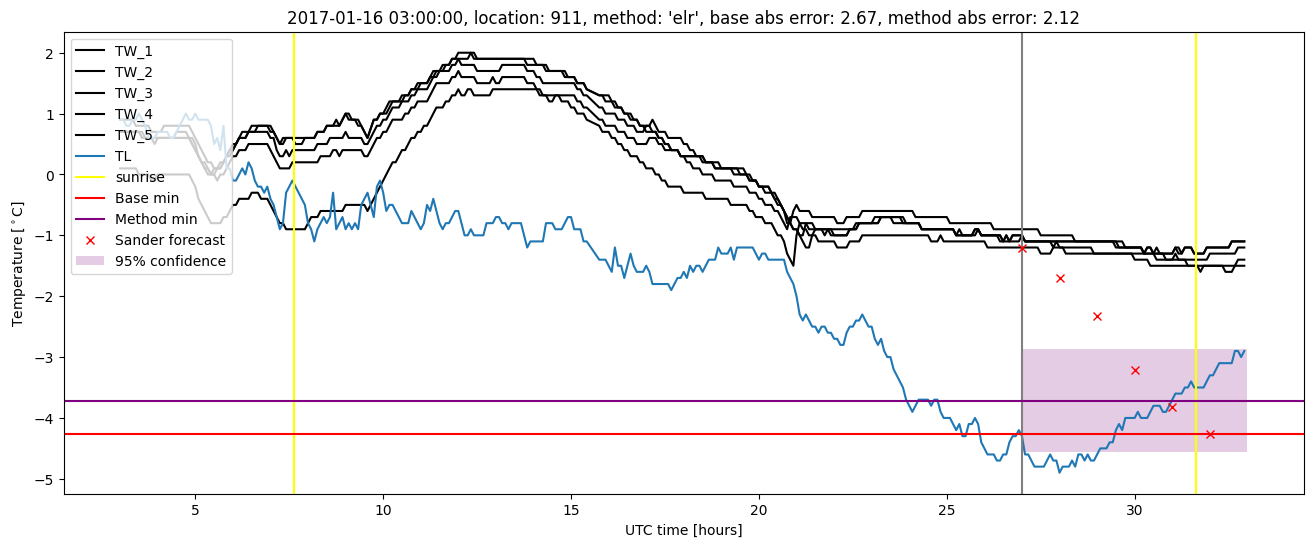
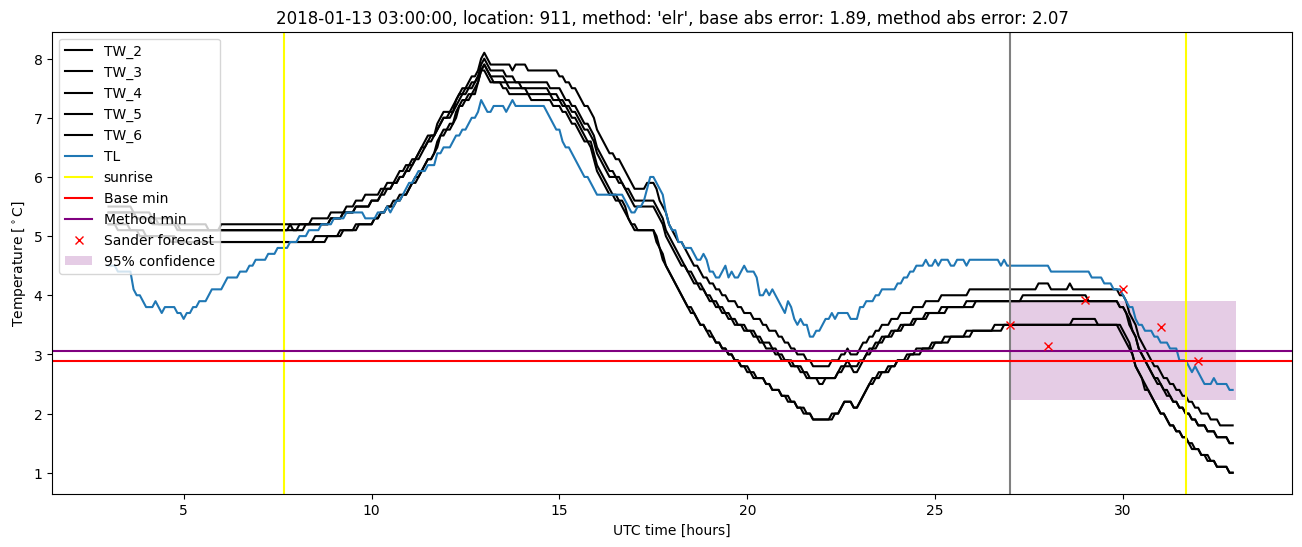
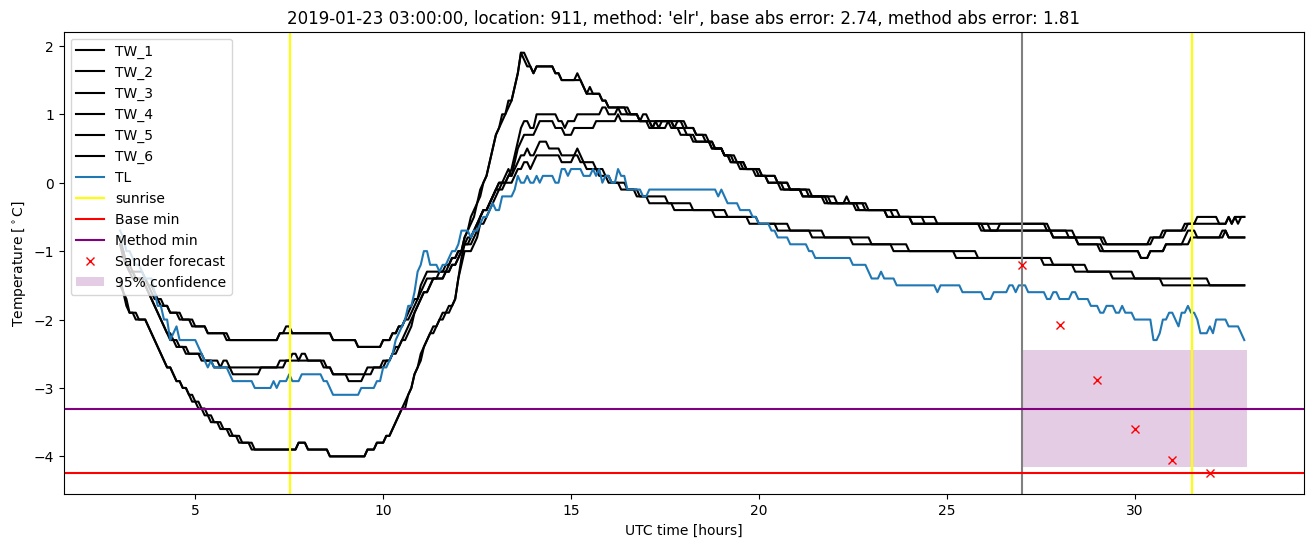
Extended logistic regression results
| names |
period |
power |
significance |
meanSquareError |
absError |
maxError |
CRPS |
IGN |
| baseline |
winter 2016 |
0.984 |
0.000e+00 |
0.329 |
0.431 |
1.993 |
NaN |
NaN |
| elr |
winter 2016 |
0.995 |
0.111 |
0.299 |
0.422 |
1.650 |
0.537 |
5.228 |
| baseline |
winter 2017 |
0.957 |
0.026 |
0.386 |
0.457 |
2.667 |
NaN |
NaN |
| elr |
winter 2017 |
0.948 |
0.026 |
0.312 |
0.427 |
2.119 |
0.540 |
4.931 |
| baseline |
winter 2018 |
0.992 |
0.069 |
0.349 |
0.441 |
2.481 |
NaN |
NaN |
| elr |
winter 2018 |
0.984 |
0.069 |
0.317 |
0.417 |
2.169 |
0.523 |
4.679 |
| baseline |
winter 2019 |
0.986 |
0.000e+00 |
0.340 |
0.407 |
2.739 |
NaN |
NaN |
| elr |
winter 2019 |
0.986 |
0.000e+00 |
0.258 |
0.371 |
2.497 |
0.502 |
4.064 |
| baseline |
all |
0.981 |
0.029 |
0.349 |
0.434 |
2.739 |
NaN |
NaN |
| elr |
all |
0.981 |
0.049 |
0.296 |
0.410 |
2.497 |
0.526 |
4.760 |
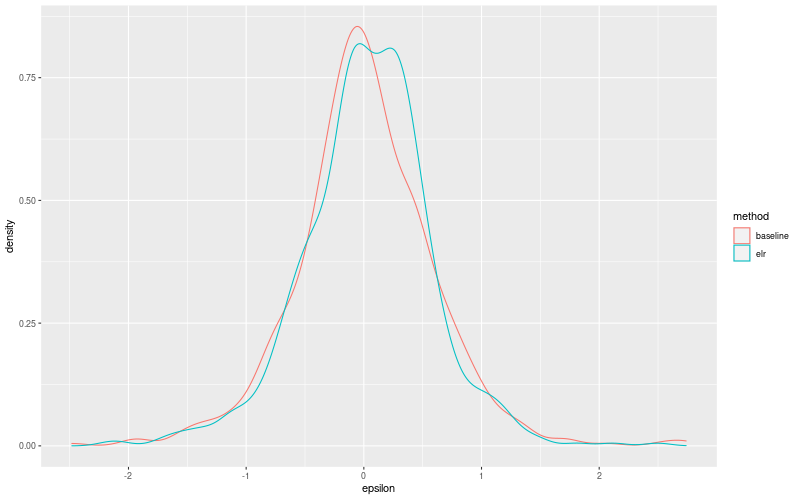
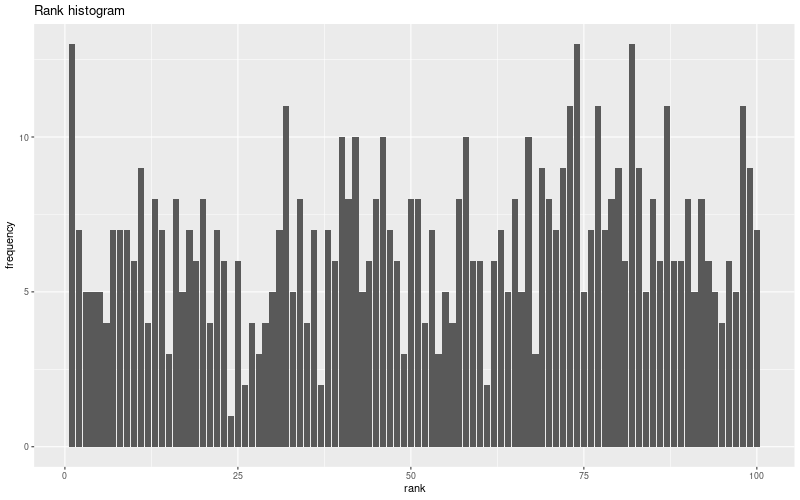
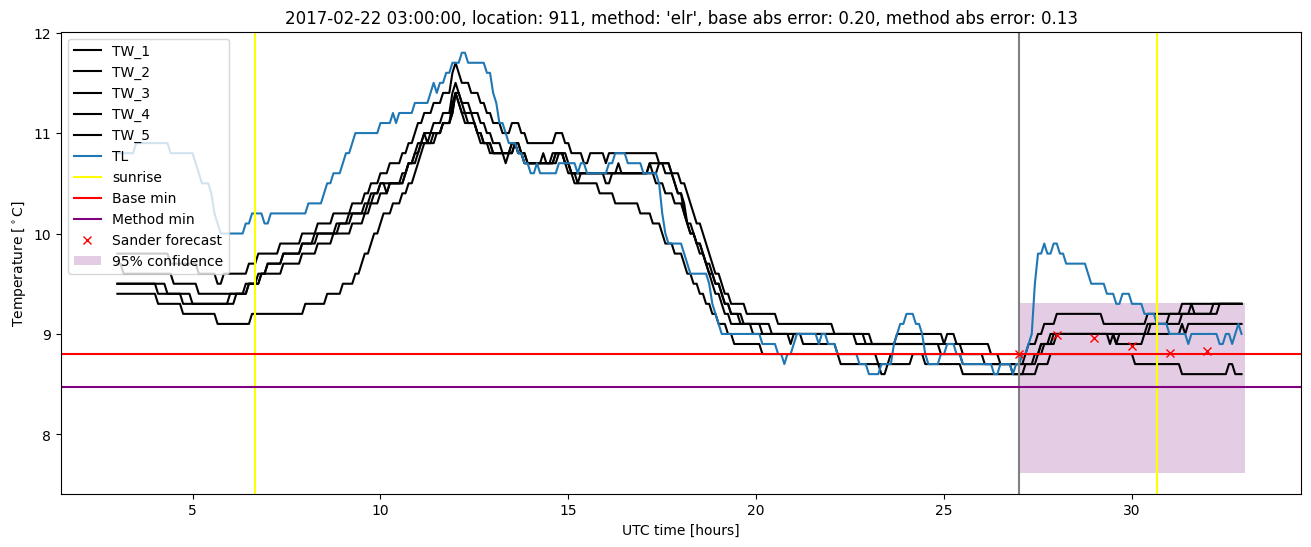
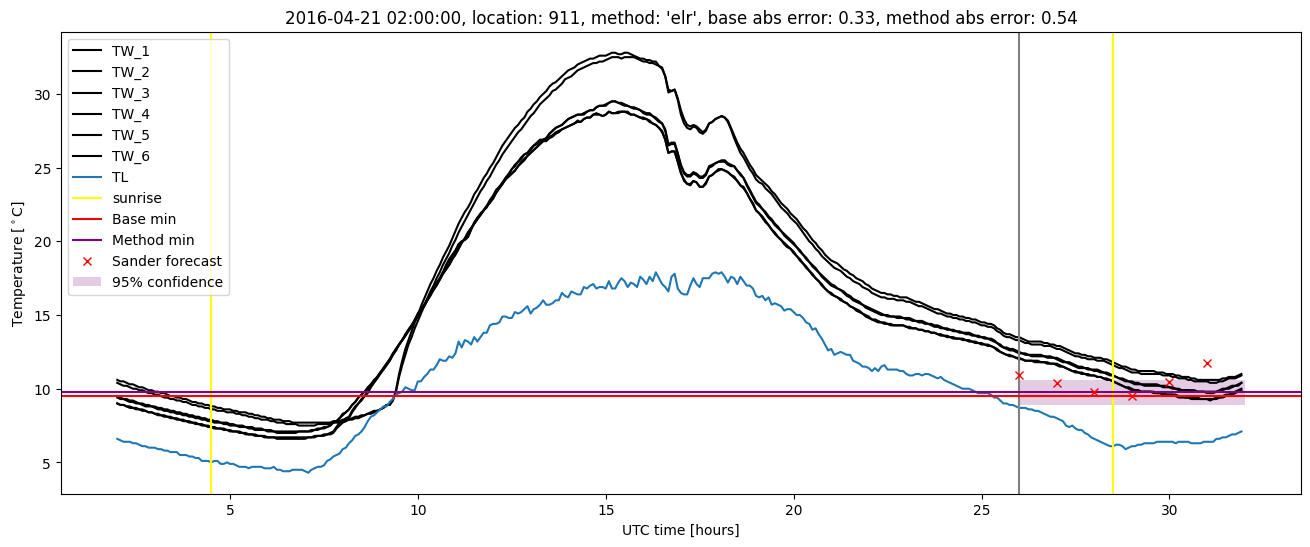
Extended logistic regression plots