GMS location: 910
Random forest results
| names |
period |
power |
significance |
meanSquareError |
absError |
maxError |
CRPS |
IGN |
| baseline |
winter 2016 |
0.984 |
0.000e+00 |
0.312 |
0.423 |
1.783 |
NaN |
NaN |
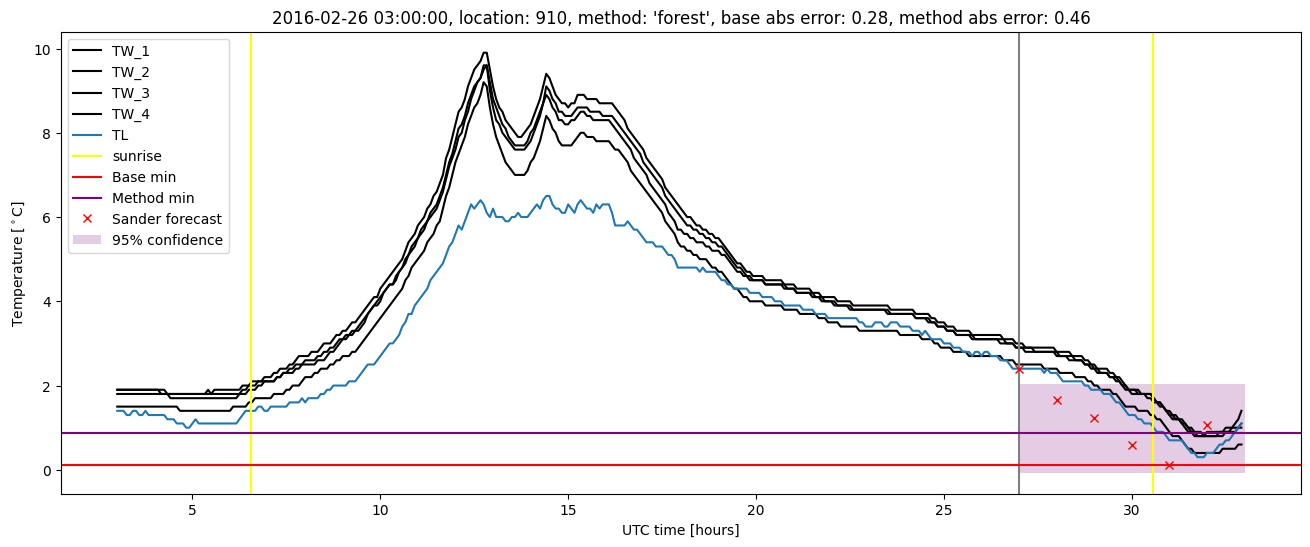
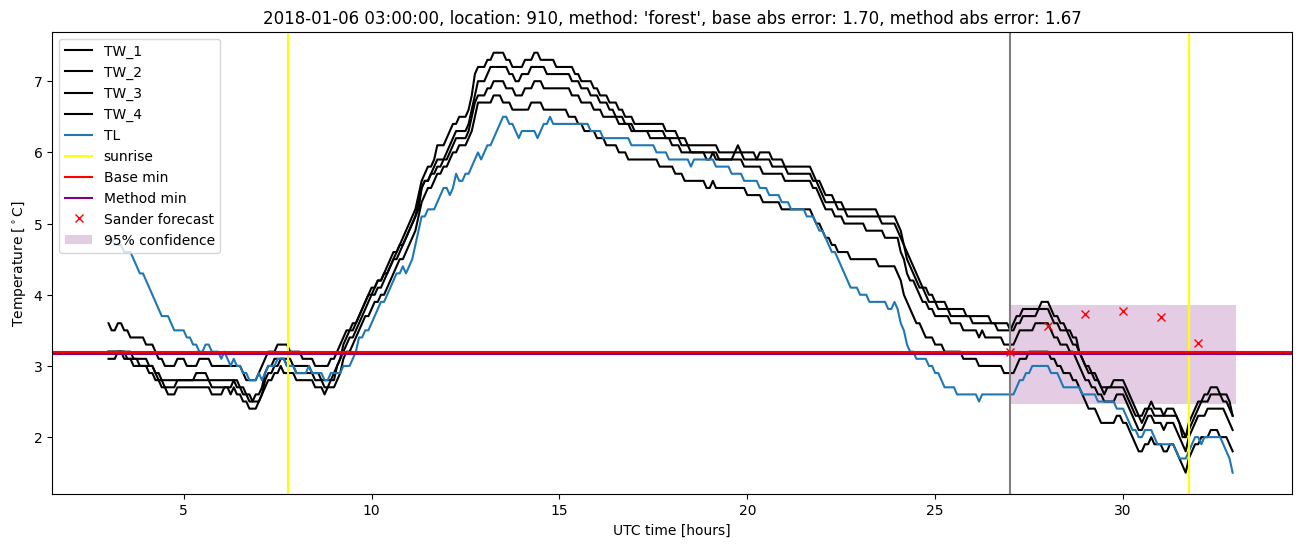
| forest |
winter 2016 |
0.989 |
0.071 |
0.190 |
0.329 |
1.305 |
0.440 |
3.883 |
| baseline |
winter 2017 |
0.952 |
0.071 |
0.376 |
0.456 |
2.712 |
NaN |
NaN |
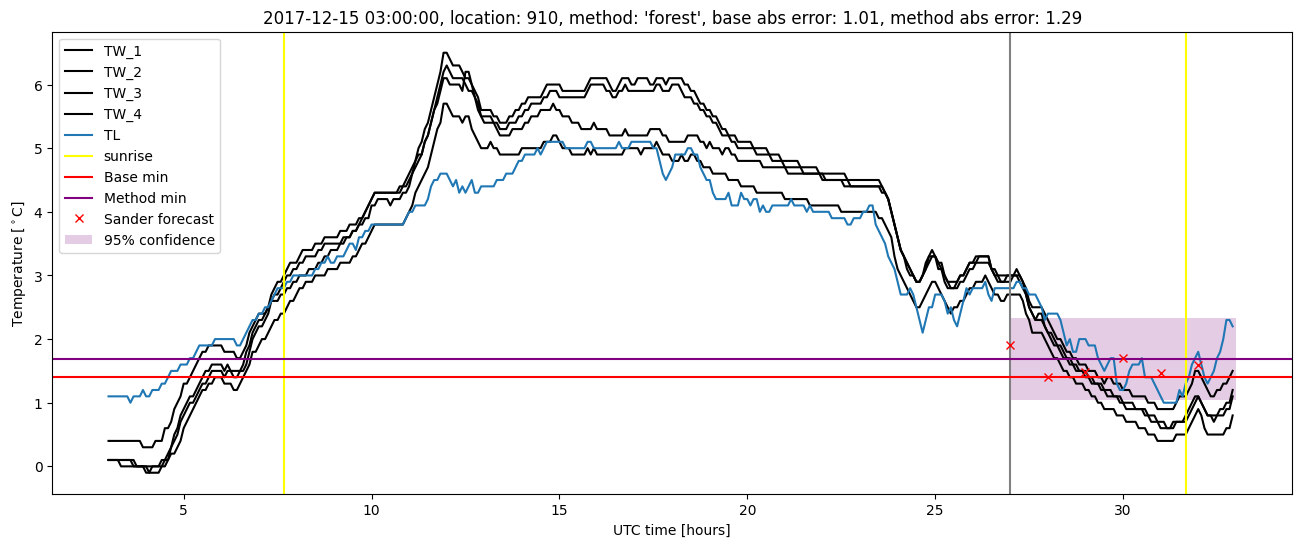
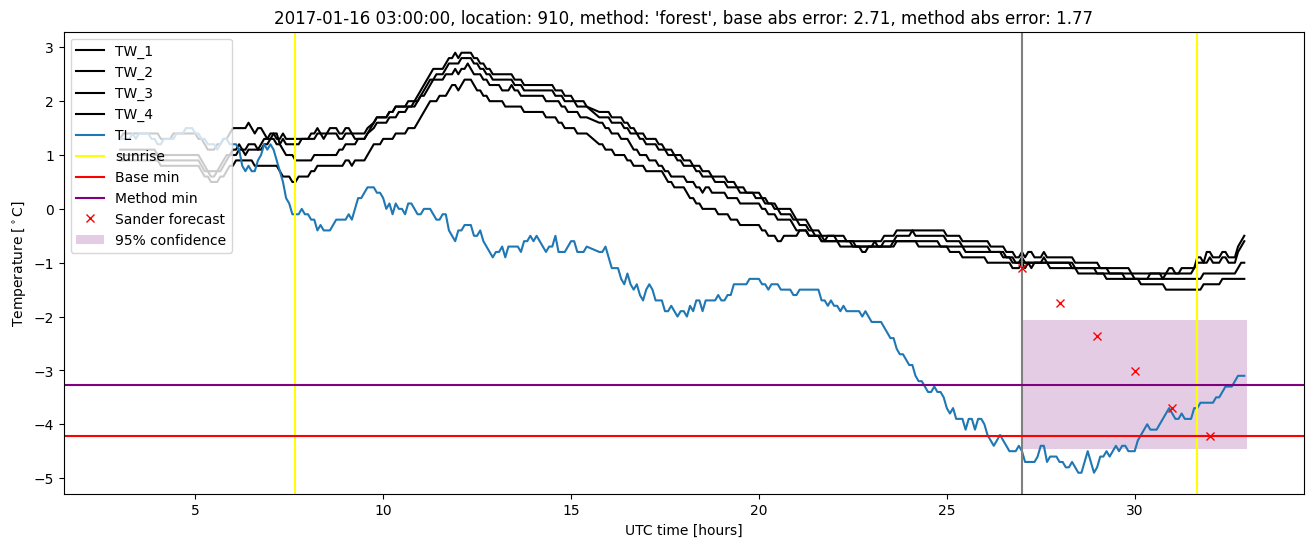
| forest |
winter 2017 |
0.984 |
0.071 |
0.227 |
0.354 |
1.771 |
0.440 |
4.461 |
| baseline |
winter 2018 |
0.987 |
0.069 |
0.384 |
0.476 |
2.198 |
NaN |
NaN |
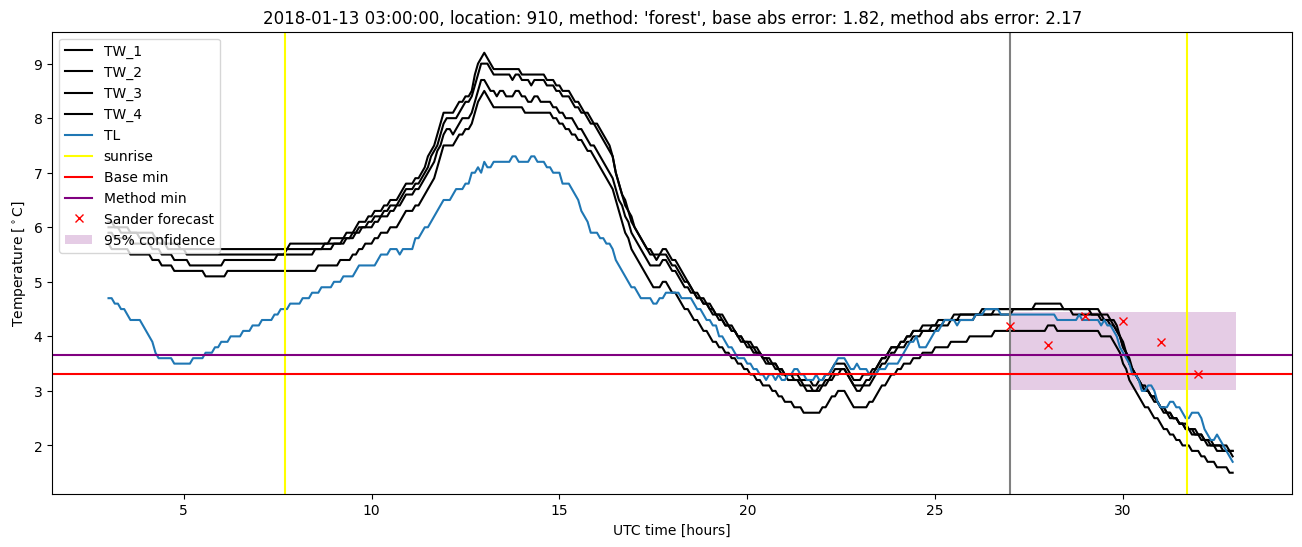
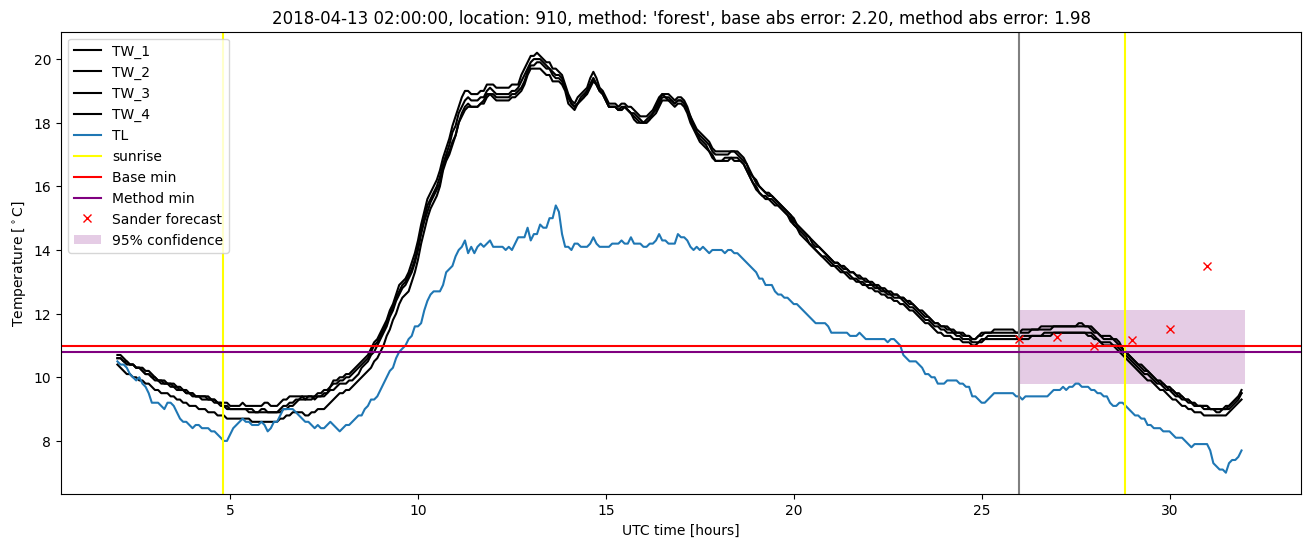
| forest |
winter 2018 |
0.987 |
0.103 |
0.302 |
0.414 |
2.167 |
0.445 |
3.630 |
| baseline |
winter 2019 |
0.972 |
0.000e+00 |
0.368 |
0.445 |
2.151 |
NaN |
NaN |
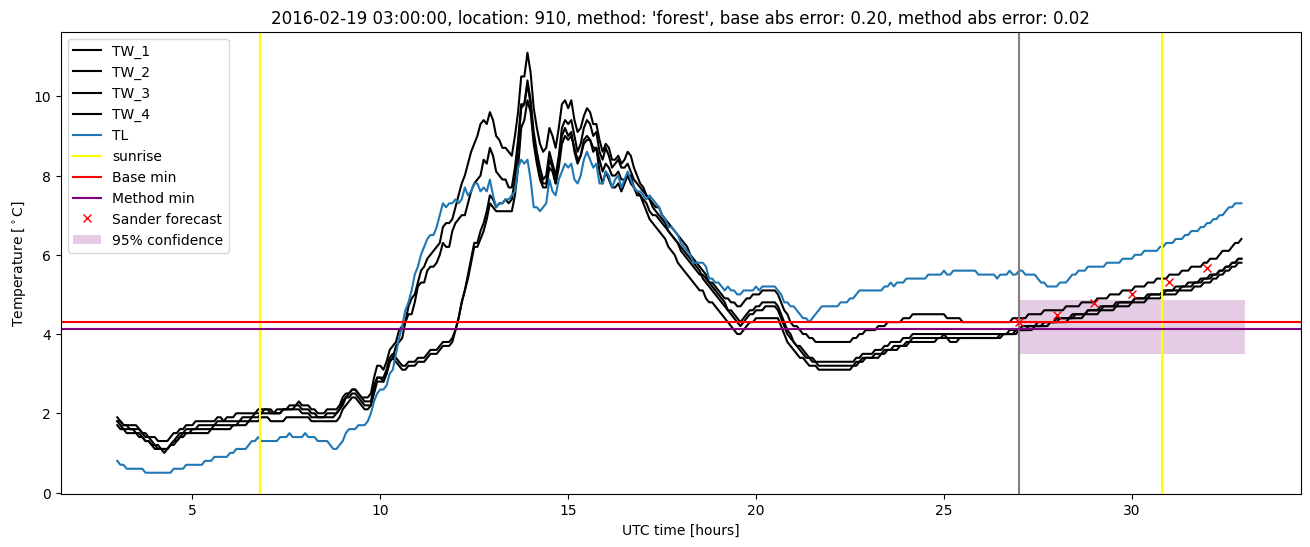
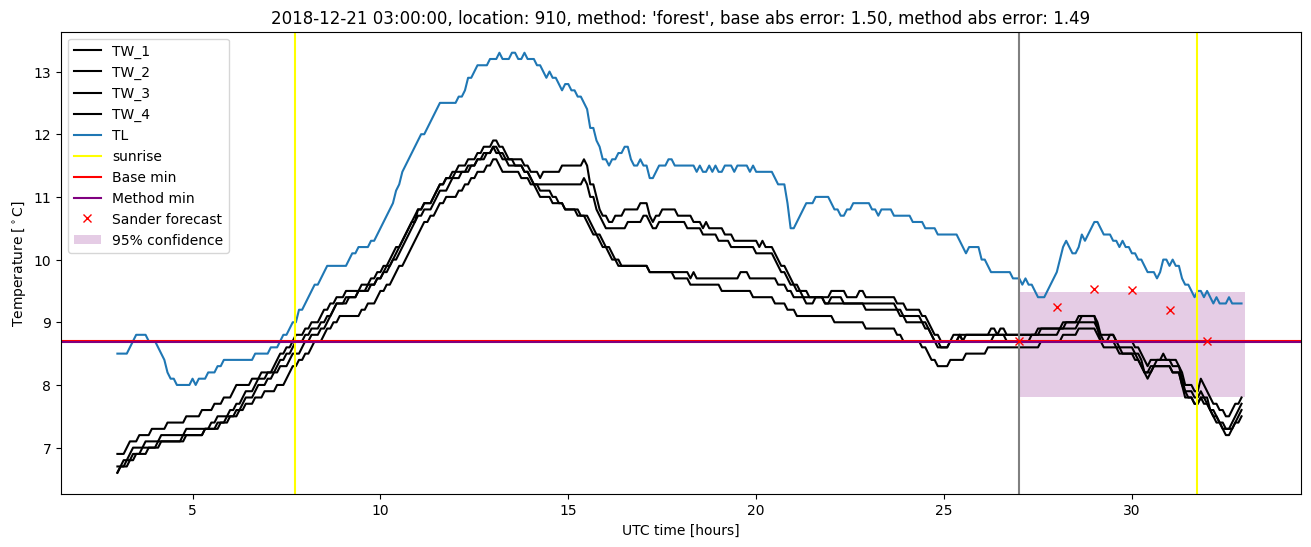
| forest |
winter 2019 |
0.972 |
0.000e+00 |
0.225 |
0.360 |
1.487 |
0.432 |
3.521 |
| baseline |
all |
0.975 |
0.049 |
0.358 |
0.449 |
2.712 |
NaN |
NaN |
| forest |
all |
0.984 |
0.073 |
0.236 |
0.364 |
2.167 |
0.439 |
3.862 |
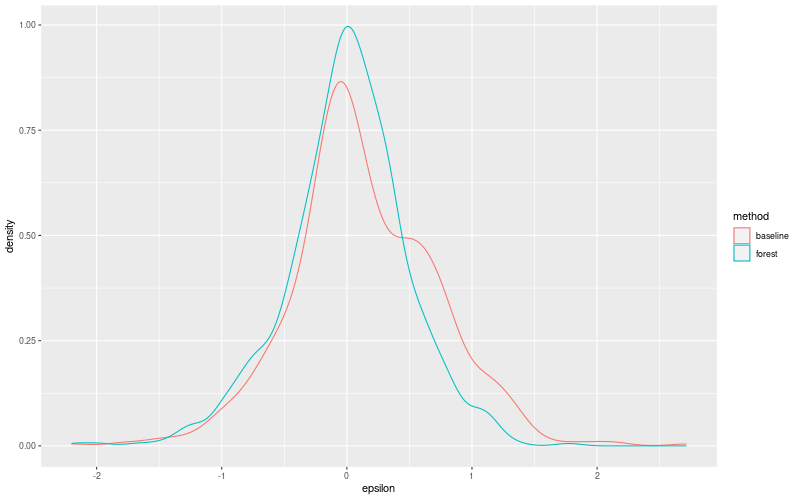
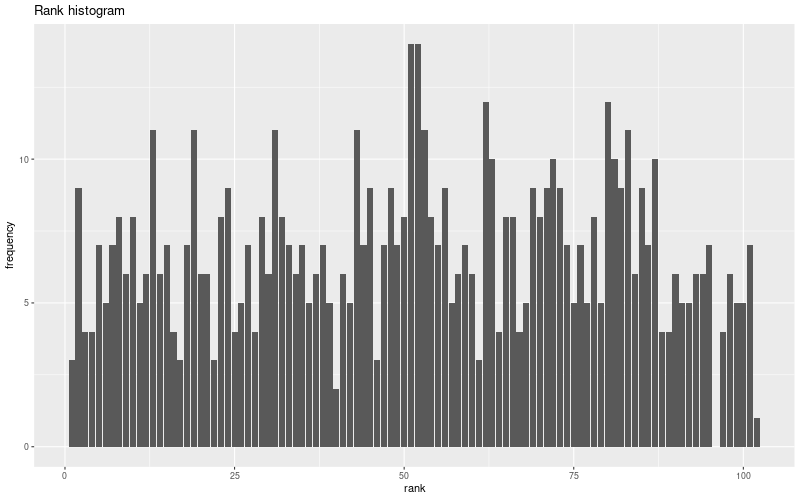
Random forest plots
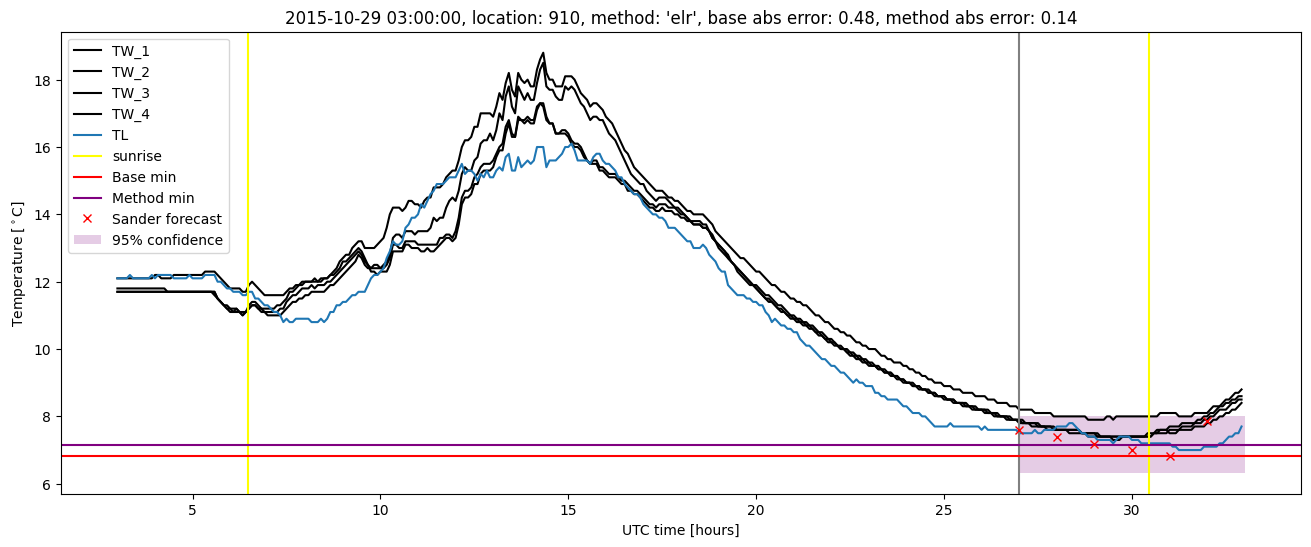
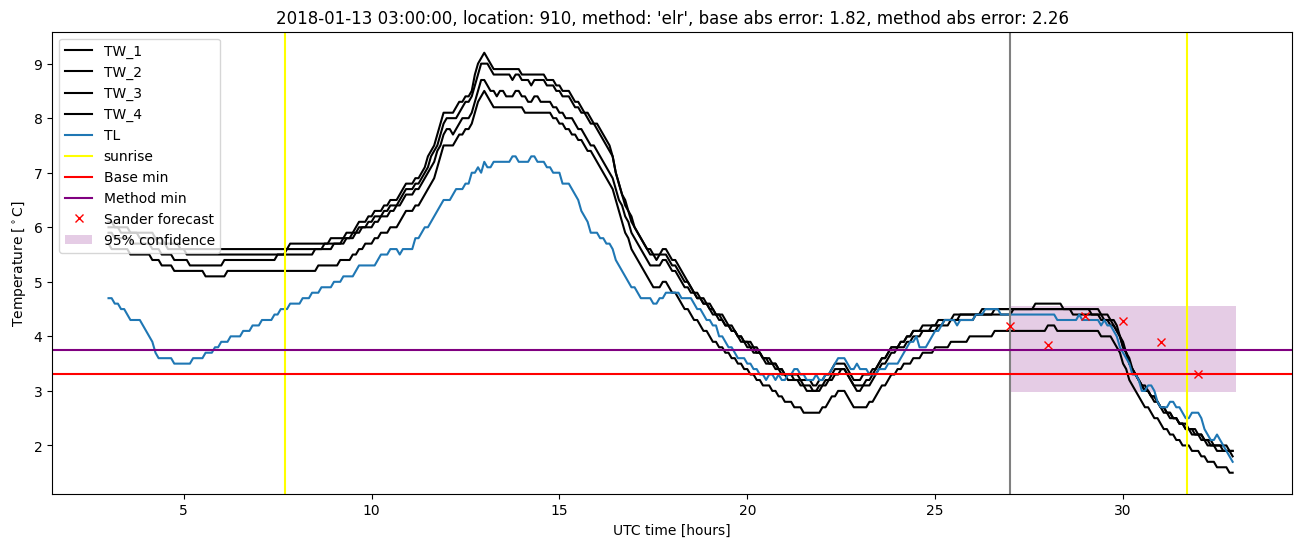
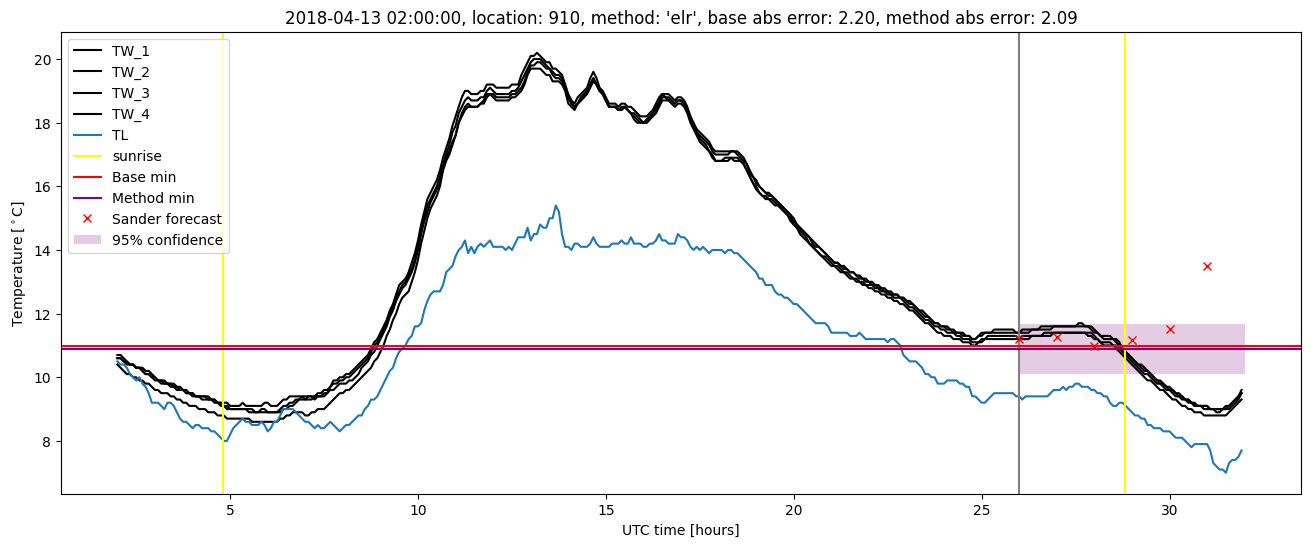
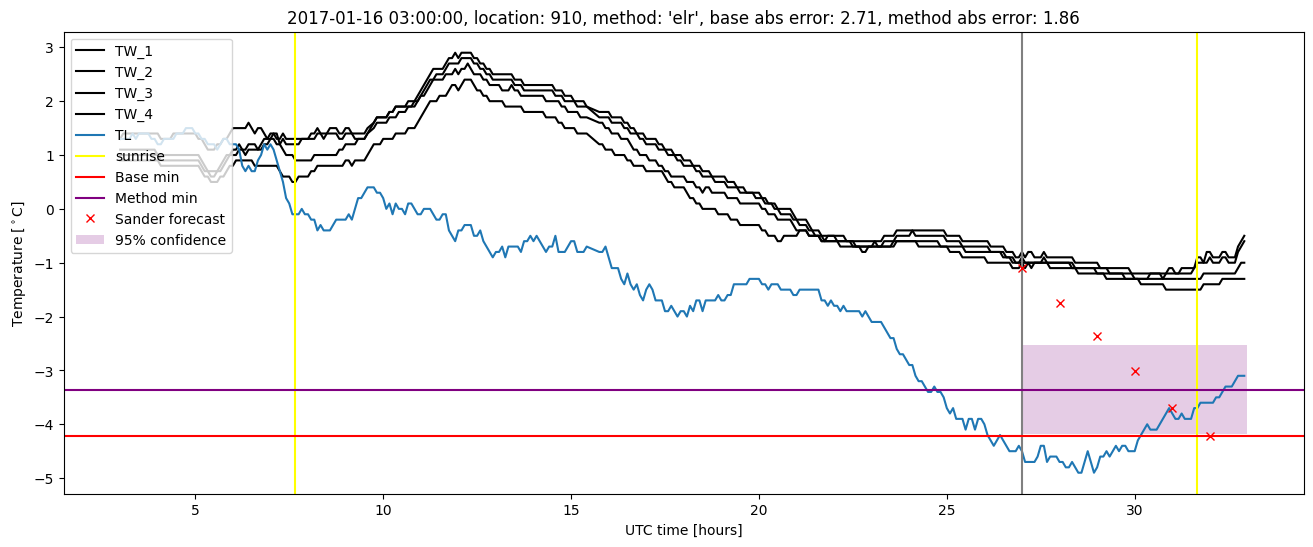
Extended logistic regression results
| names |
period |
power |
significance |
meanSquareError |
absError |
maxError |
CRPS |
IGN |
| baseline |
winter 2016 |
0.984 |
0.000e+00 |
0.312 |
0.423 |
1.783 |
NaN |
NaN |
| elr |
winter 2016 |
0.989 |
0.000e+00 |
0.236 |
0.389 |
1.359 |
0.521 |
4.649 |
| baseline |
winter 2017 |
0.952 |
0.071 |
0.376 |
0.456 |
2.712 |
NaN |
NaN |
| elr |
winter 2017 |
0.968 |
0.036 |
0.237 |
0.372 |
1.864 |
0.503 |
4.764 |
| baseline |
winter 2018 |
0.987 |
0.069 |
0.384 |
0.476 |
2.198 |
NaN |
NaN |
| elr |
winter 2018 |
0.994 |
0.103 |
0.319 |
0.423 |
2.258 |
0.503 |
5.351 |
| baseline |
winter 2019 |
0.972 |
0.000e+00 |
0.368 |
0.445 |
2.151 |
NaN |
NaN |
| elr |
winter 2019 |
0.986 |
0.000e+00 |
0.260 |
0.393 |
1.351 |
0.481 |
4.531 |
| baseline |
all |
0.975 |
0.049 |
0.358 |
0.449 |
2.712 |
NaN |
NaN |
| elr |
all |
0.985 |
0.049 |
0.264 |
0.395 |
2.258 |
0.503 |
4.834 |
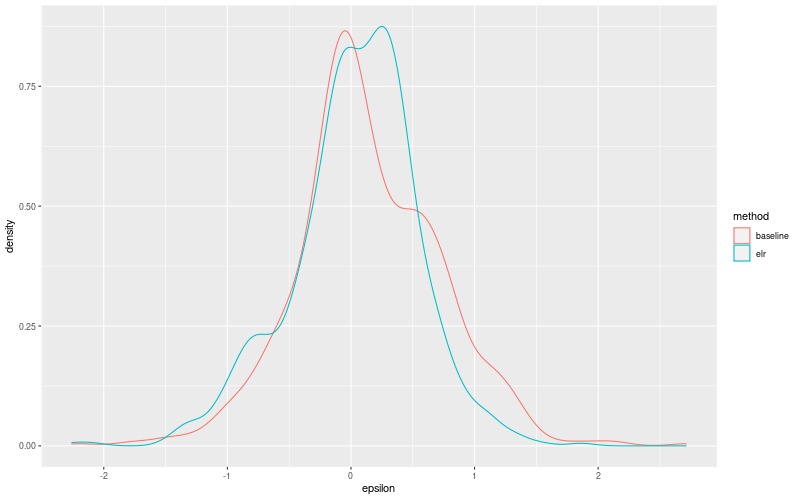
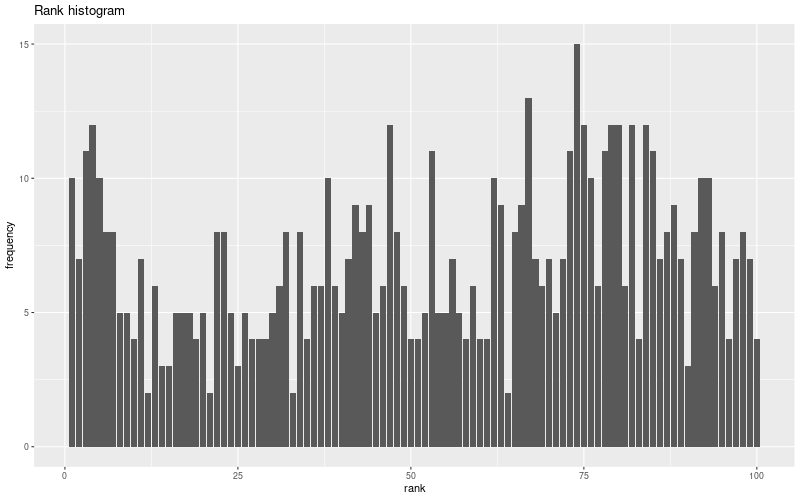
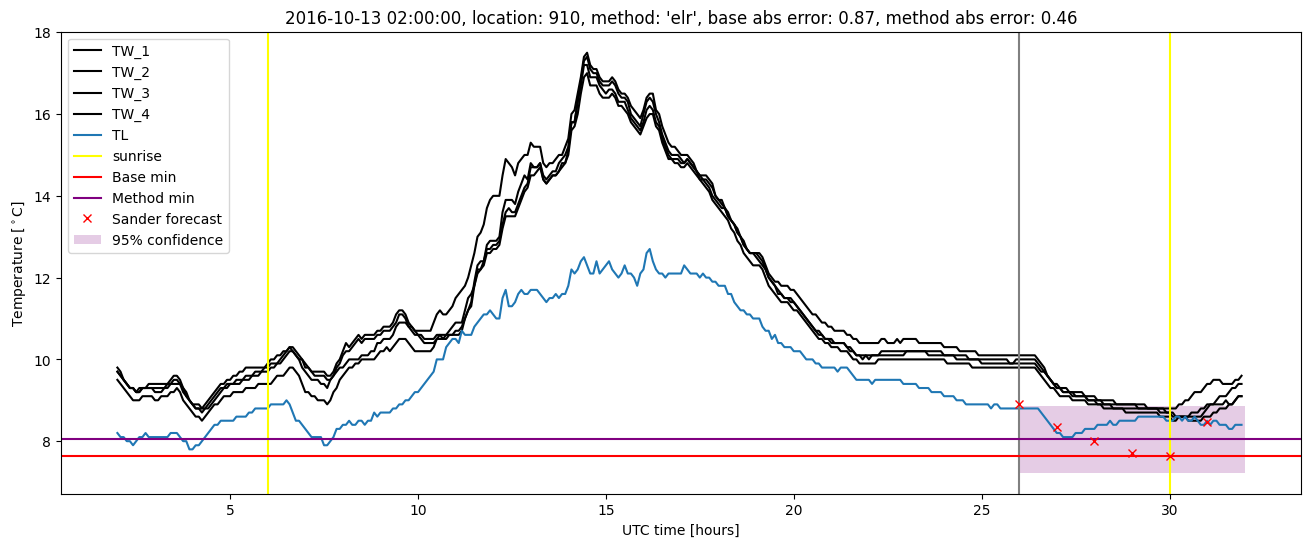
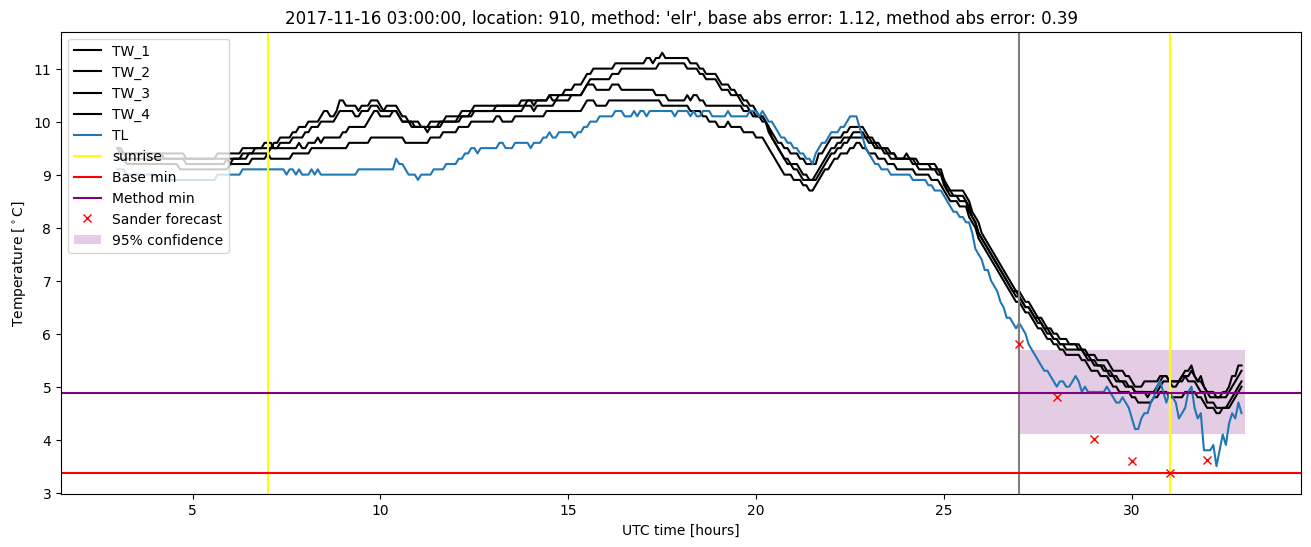
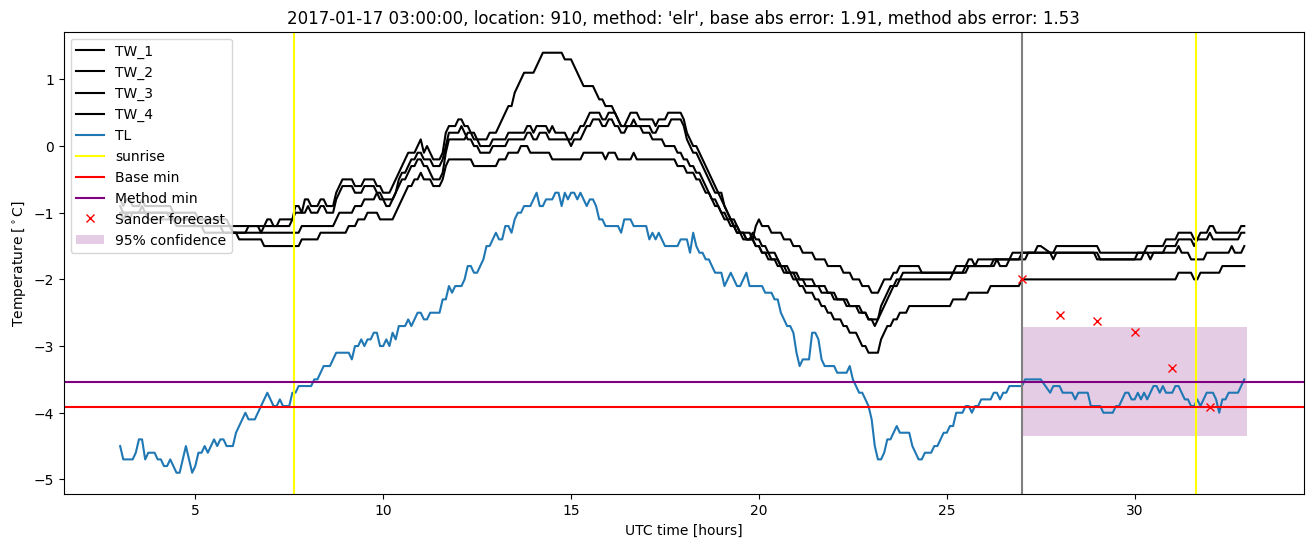
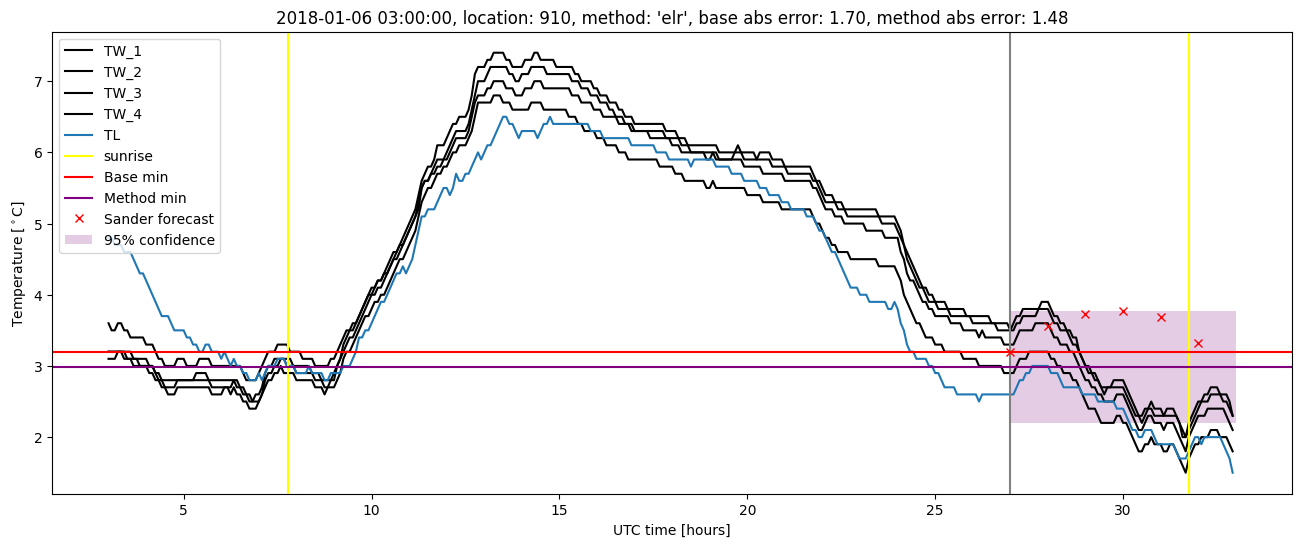
Extended logistic regression plots