GMS location: 909
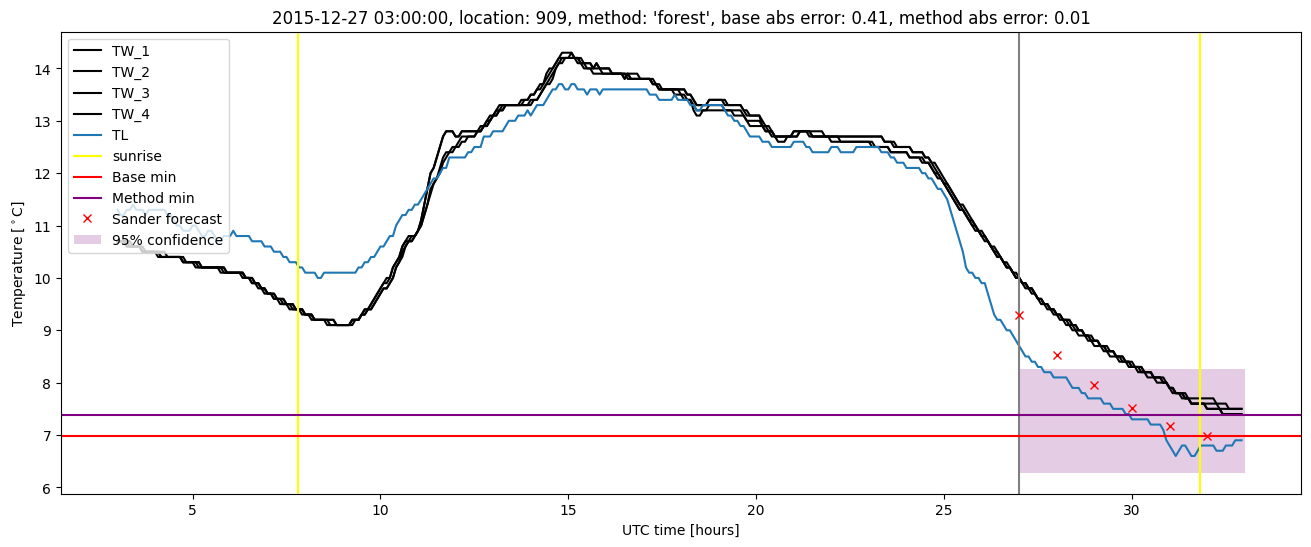
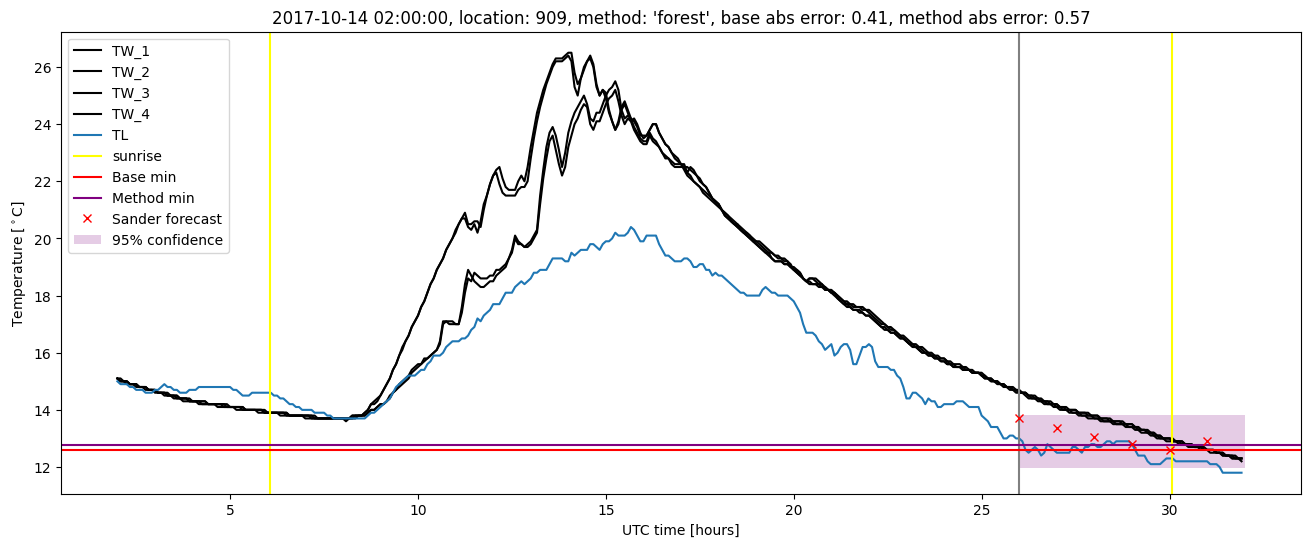
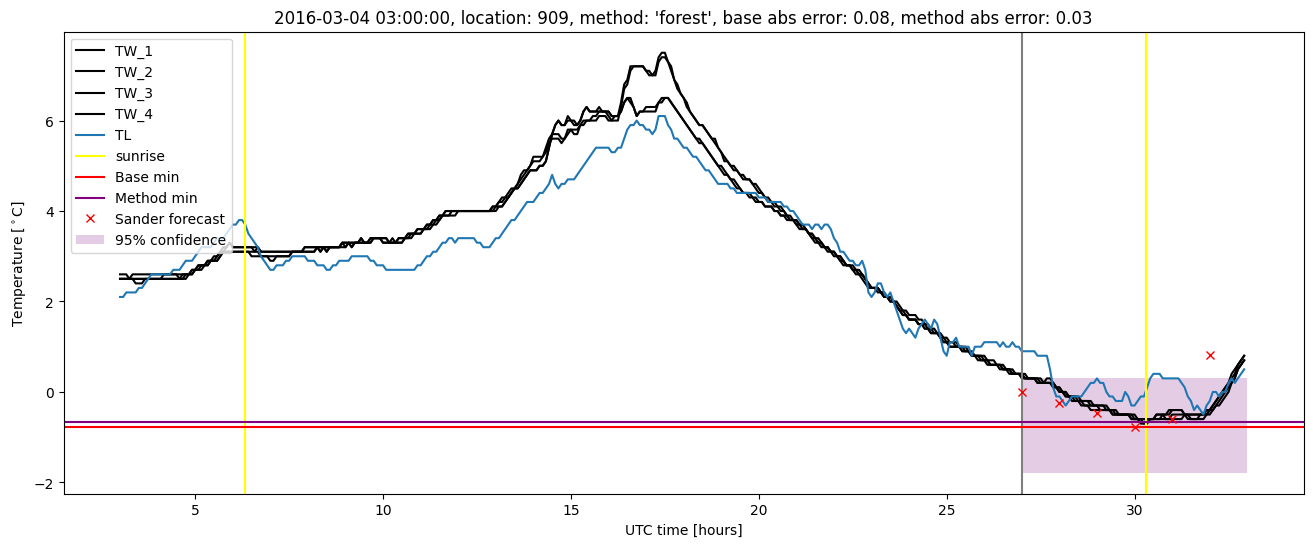
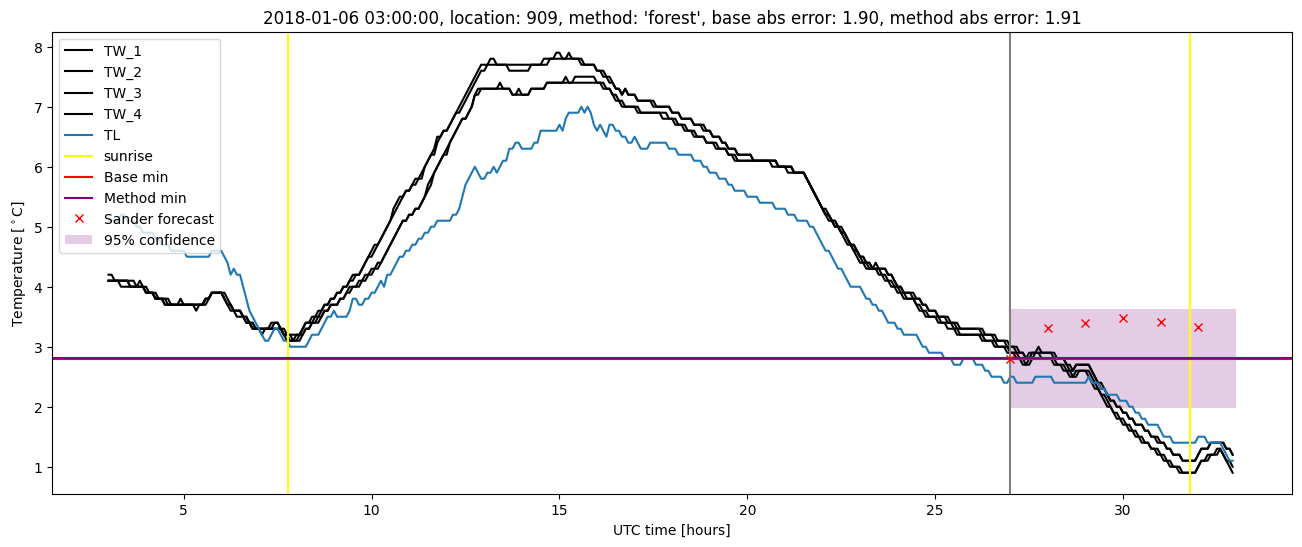
Random forest results
| names |
period |
power |
significance |
meanSquareError |
absError |
maxError |
CRPS |
IGN |
| baseline |
winter 2016 |
0.979 |
0.000e+00 |
0.338 |
0.450 |
1.669 |
NaN |
NaN |
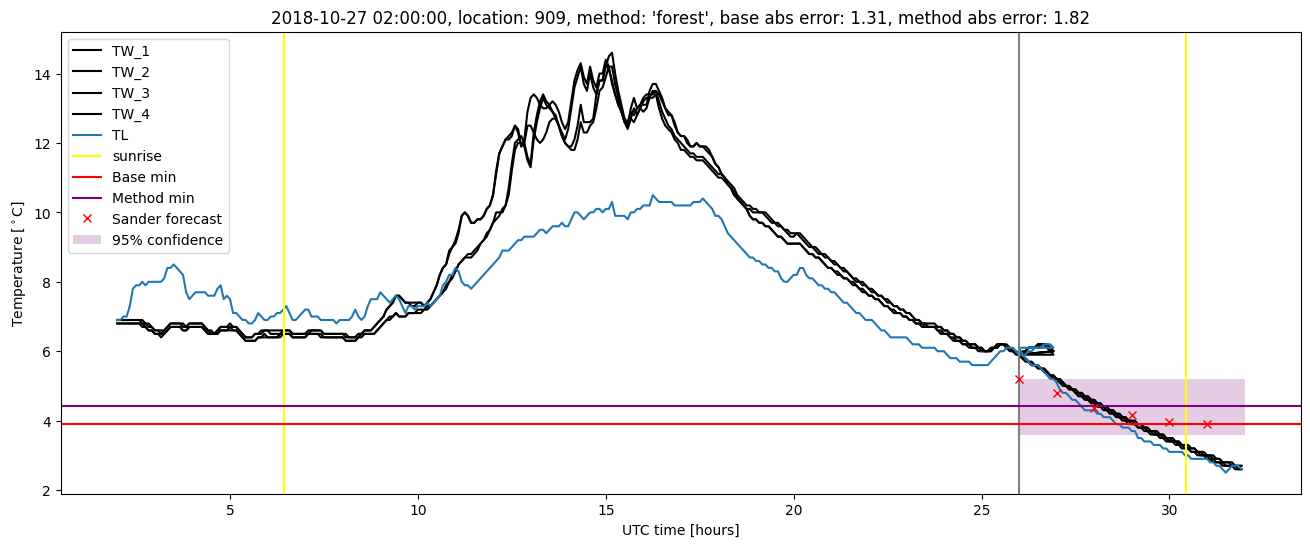
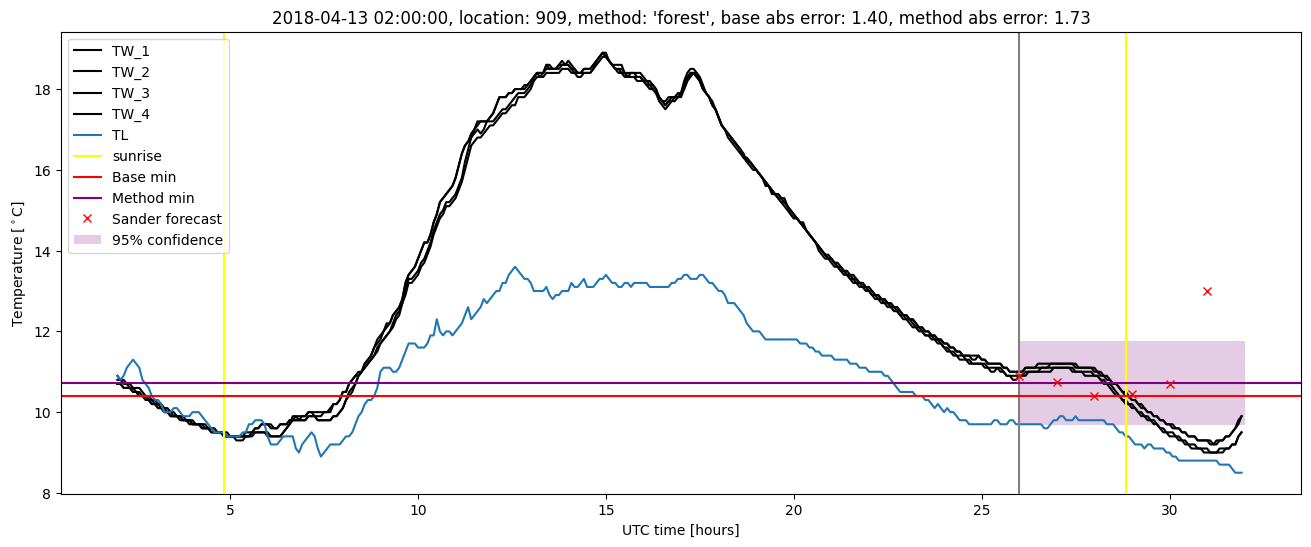
| forest |
winter 2016 |
0.984 |
0.091 |
0.210 |
0.363 |
1.281 |
0.403 |
3.356 |
| baseline |
winter 2017 |
0.952 |
0.000e+00 |
0.415 |
0.506 |
1.794 |
NaN |
NaN |
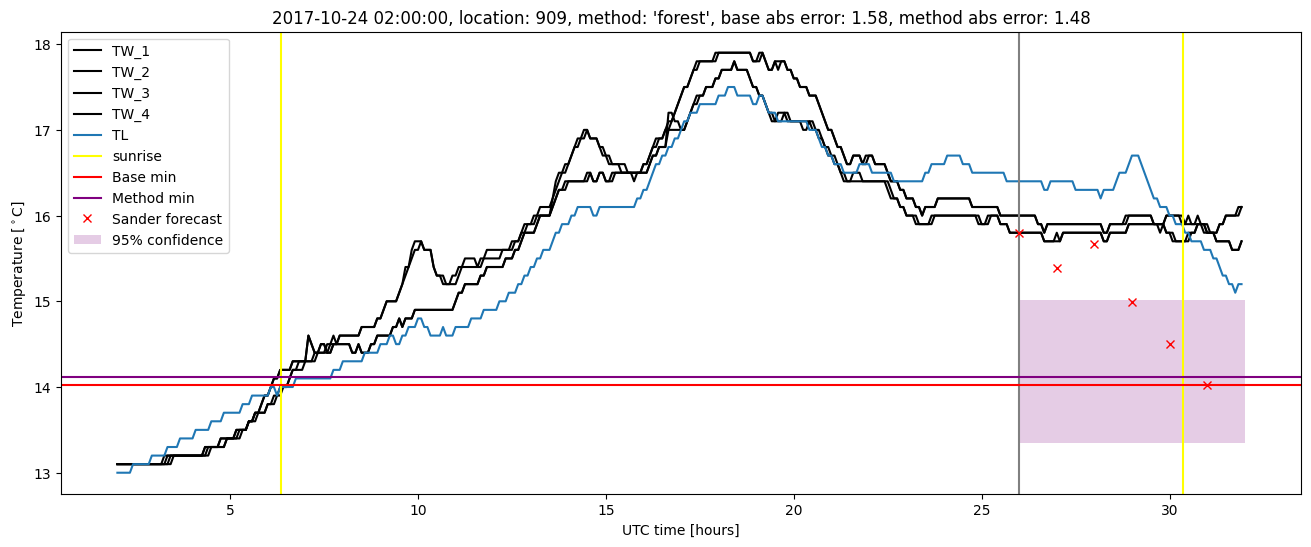
| forest |
winter 2017 |
0.960 |
0.040 |
0.257 |
0.399 |
1.373 |
0.408 |
4.553 |
| baseline |
winter 2018 |
0.991 |
0.071 |
0.356 |
0.454 |
1.903 |
NaN |
NaN |
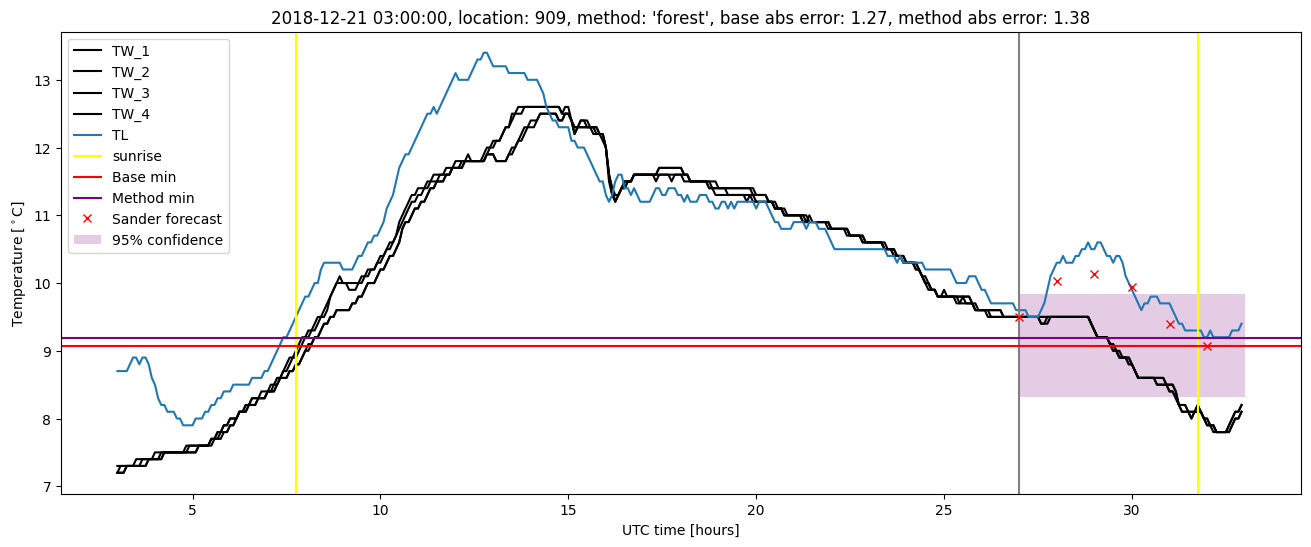
| forest |
winter 2018 |
1.000 |
0.071 |
0.300 |
0.404 |
1.910 |
0.396 |
2.955 |
| baseline |
winter 2019 |
0.992 |
0.000e+00 |
0.278 |
0.383 |
1.654 |
NaN |
NaN |
| forest |
winter 2019 |
0.992 |
0.000e+00 |
0.212 |
0.341 |
1.821 |
0.405 |
2.836 |
| baseline |
all |
0.978 |
0.018 |
0.348 |
0.450 |
1.903 |
NaN |
NaN |
| forest |
all |
0.983 |
0.053 |
0.240 |
0.375 |
1.910 |
0.403 |
3.465 |
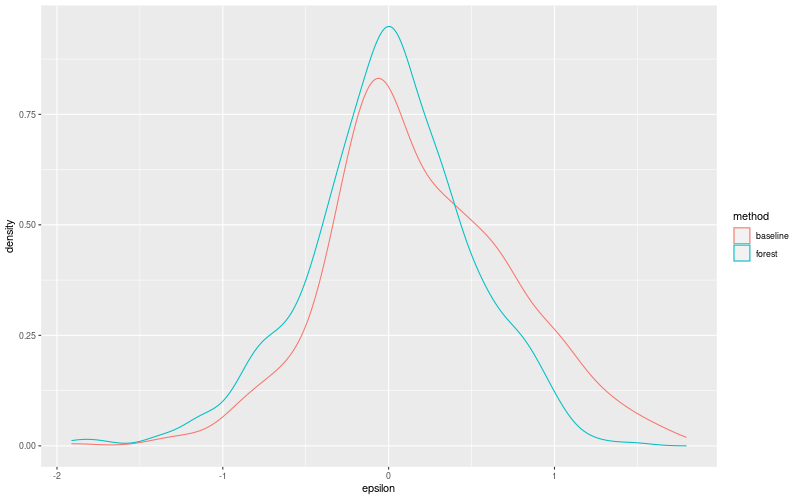
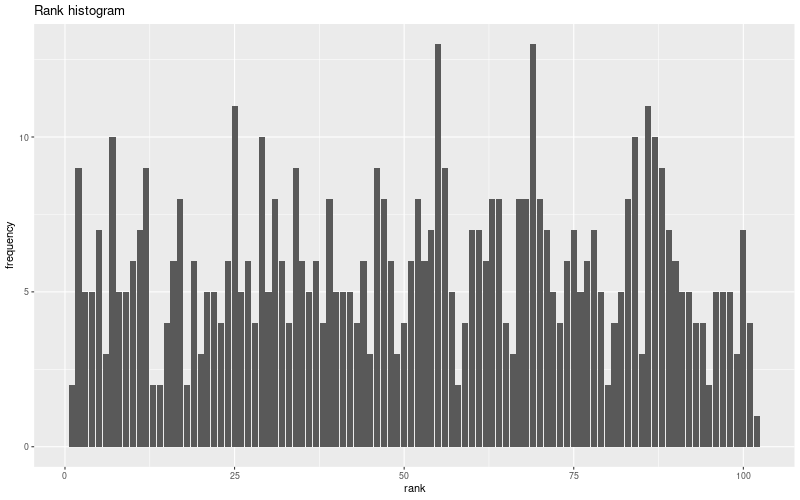
Random forest plots
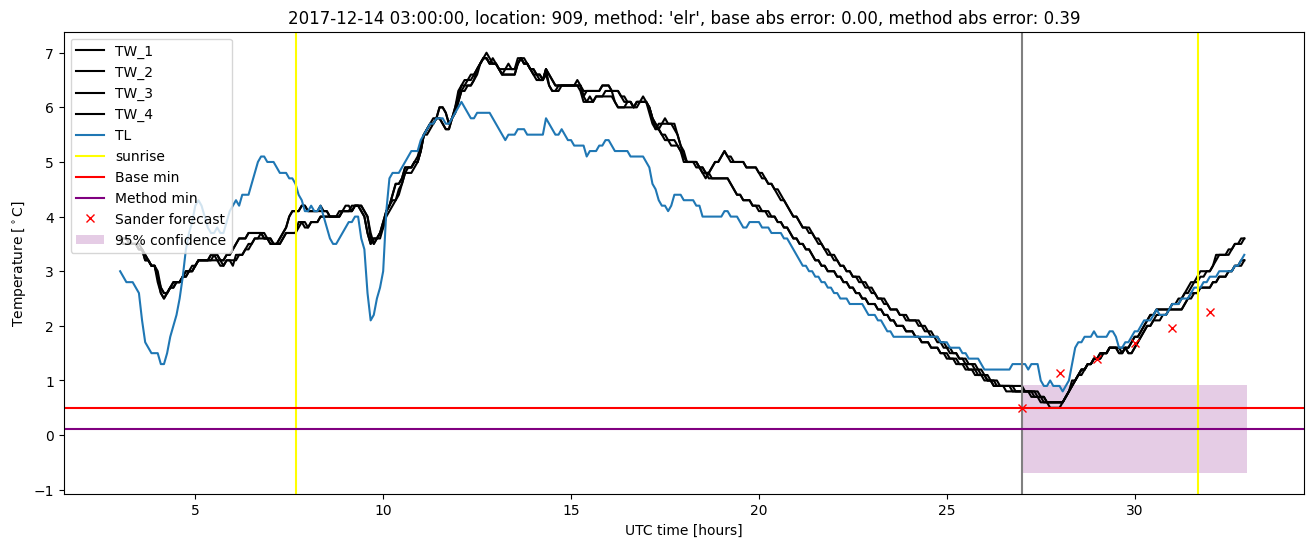
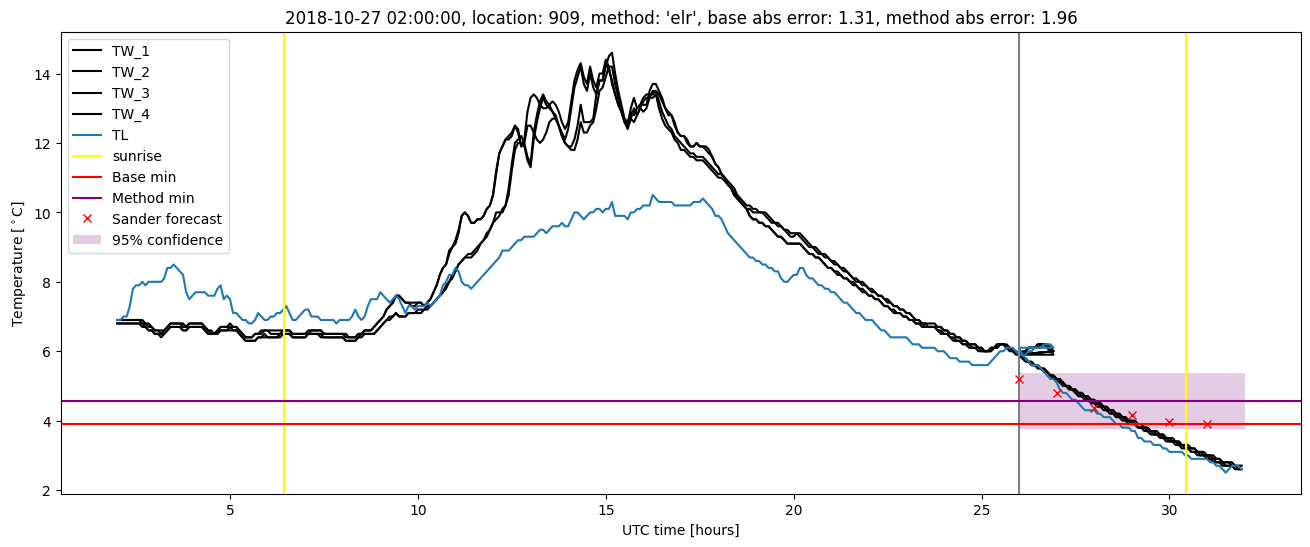
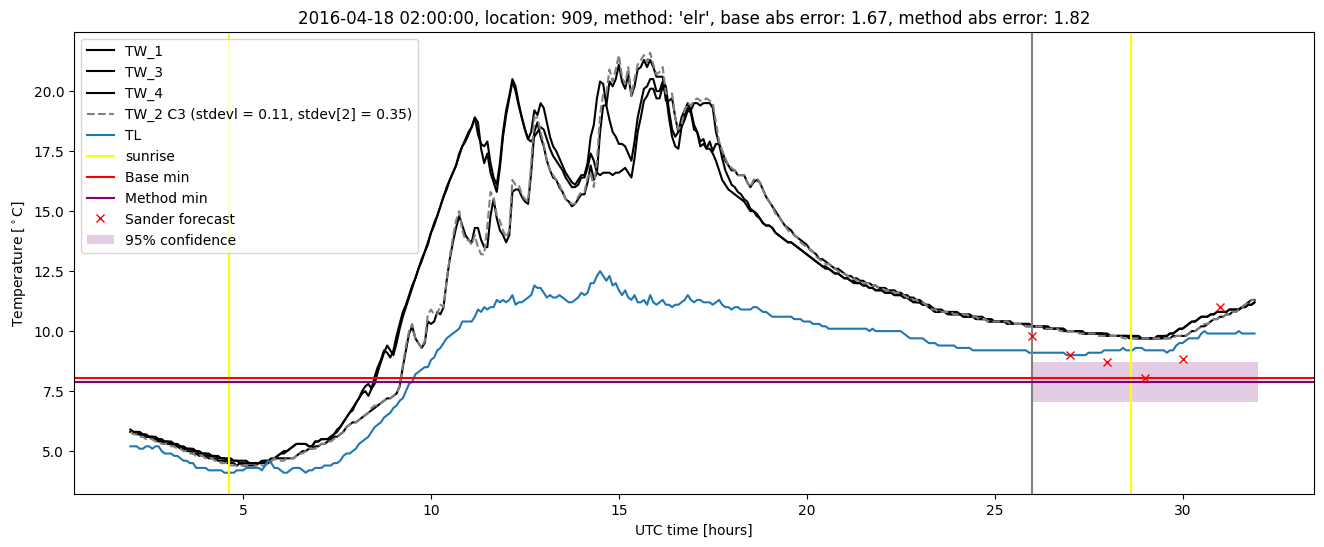
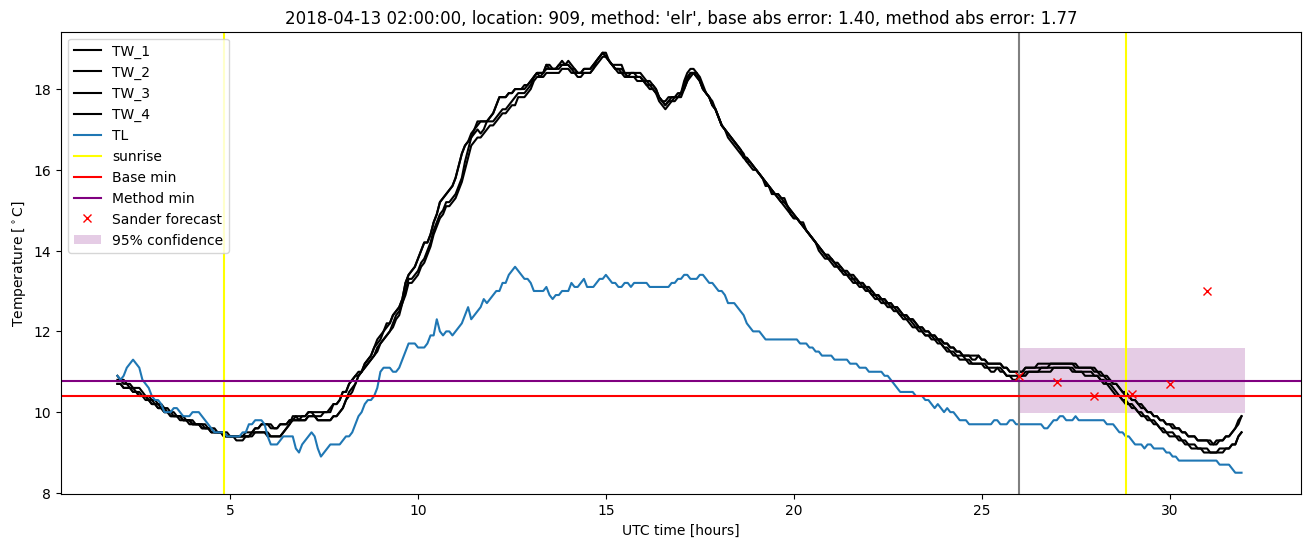
Extended logistic regression results
| names |
period |
power |
significance |
meanSquareError |
absError |
maxError |
CRPS |
IGN |
| baseline |
winter 2016 |
0.979 |
0.000e+00 |
0.338 |
0.450 |
1.669 |
NaN |
NaN |
| elr |
winter 2016 |
0.973 |
0.000e+00 |
0.264 |
0.407 |
1.817 |
0.506 |
4.886 |
| baseline |
winter 2017 |
0.952 |
0.000e+00 |
0.415 |
0.506 |
1.794 |
NaN |
NaN |
| elr |
winter 2017 |
0.960 |
0.000e+00 |
0.310 |
0.426 |
1.625 |
0.461 |
4.371 |
| baseline |
winter 2018 |
0.991 |
0.071 |
0.356 |
0.454 |
1.903 |
NaN |
NaN |
| elr |
winter 2018 |
1.000 |
0.000e+00 |
0.313 |
0.401 |
1.774 |
0.463 |
4.314 |
| baseline |
winter 2019 |
0.992 |
0.000e+00 |
0.278 |
0.383 |
1.654 |
NaN |
NaN |
| elr |
winter 2019 |
0.992 |
0.000e+00 |
0.245 |
0.351 |
1.962 |
0.460 |
3.949 |
| baseline |
all |
0.978 |
0.018 |
0.348 |
0.450 |
1.903 |
NaN |
NaN |
| elr |
all |
0.980 |
0.000e+00 |
0.281 |
0.398 |
1.962 |
0.476 |
4.438 |
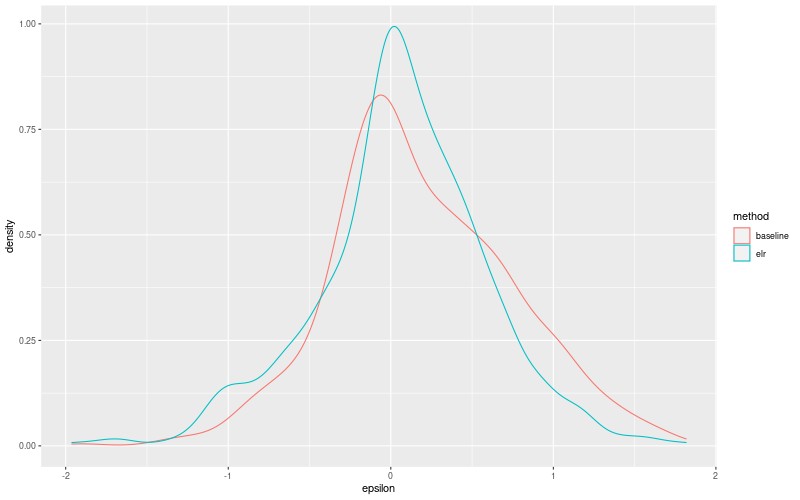
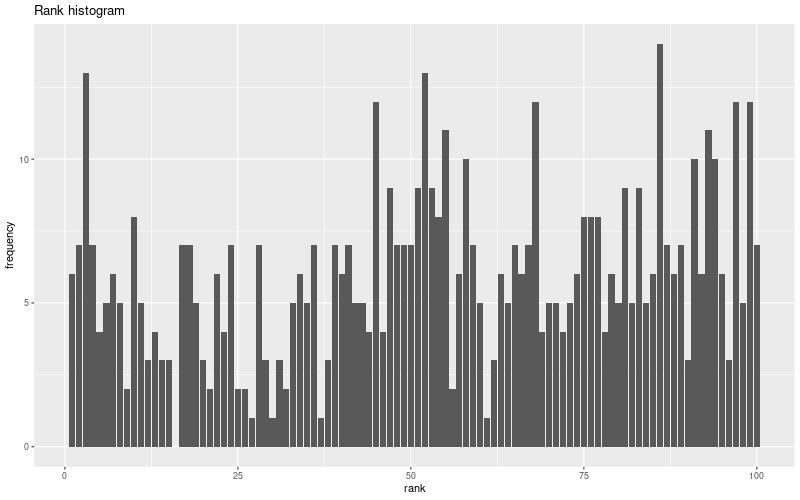
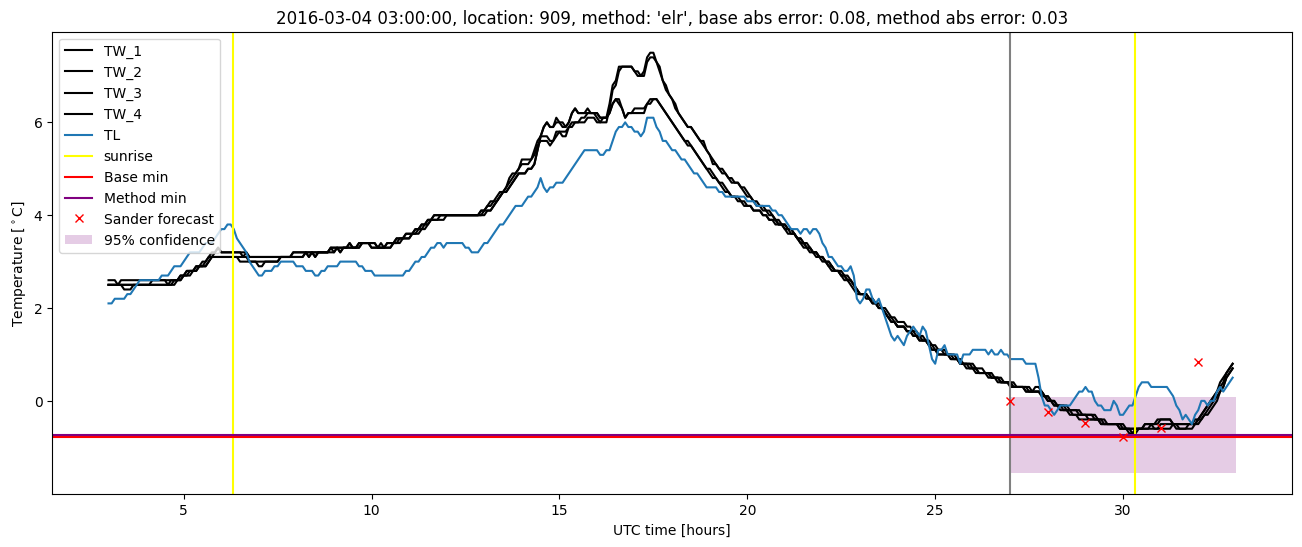
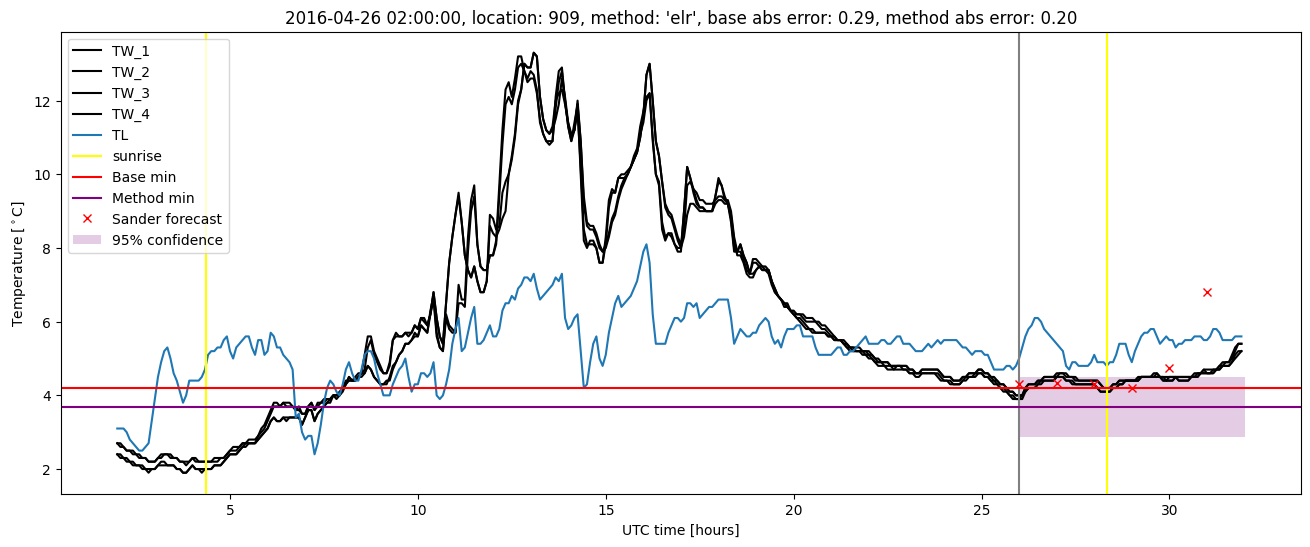
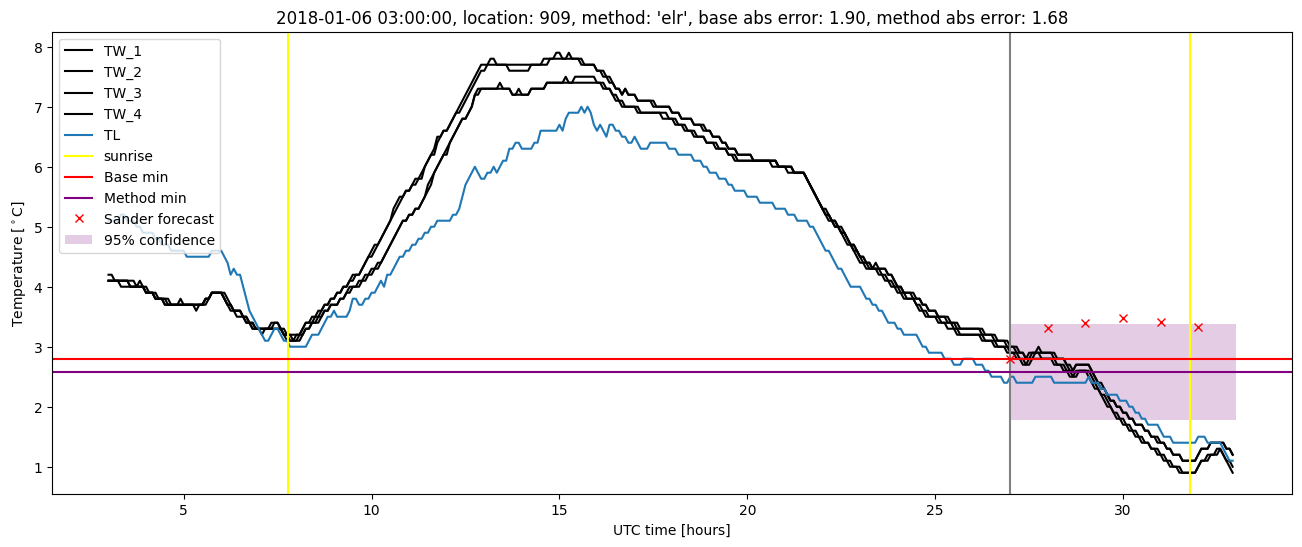
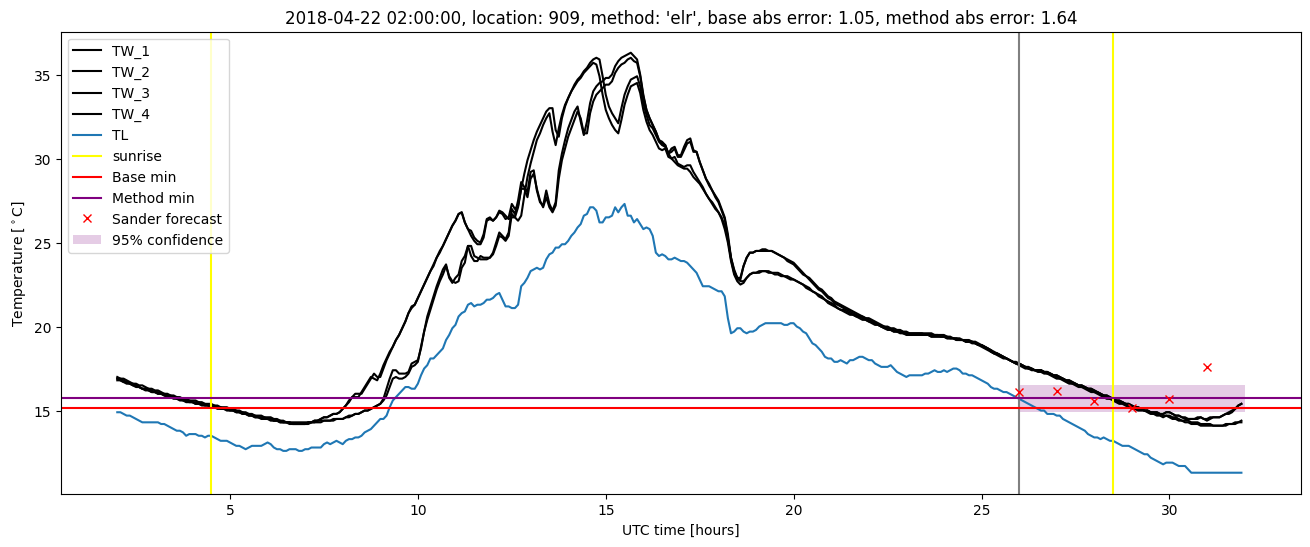
Extended logistic regression plots