GMS location: 908
Random forest results
| names |
period |
power |
significance |
meanSquareError |
absError |
maxError |
CRPS |
IGN |
| baseline |
winter 2016 |
0.976 |
0.053 |
0.397 |
0.446 |
2.798 |
NaN |
NaN |
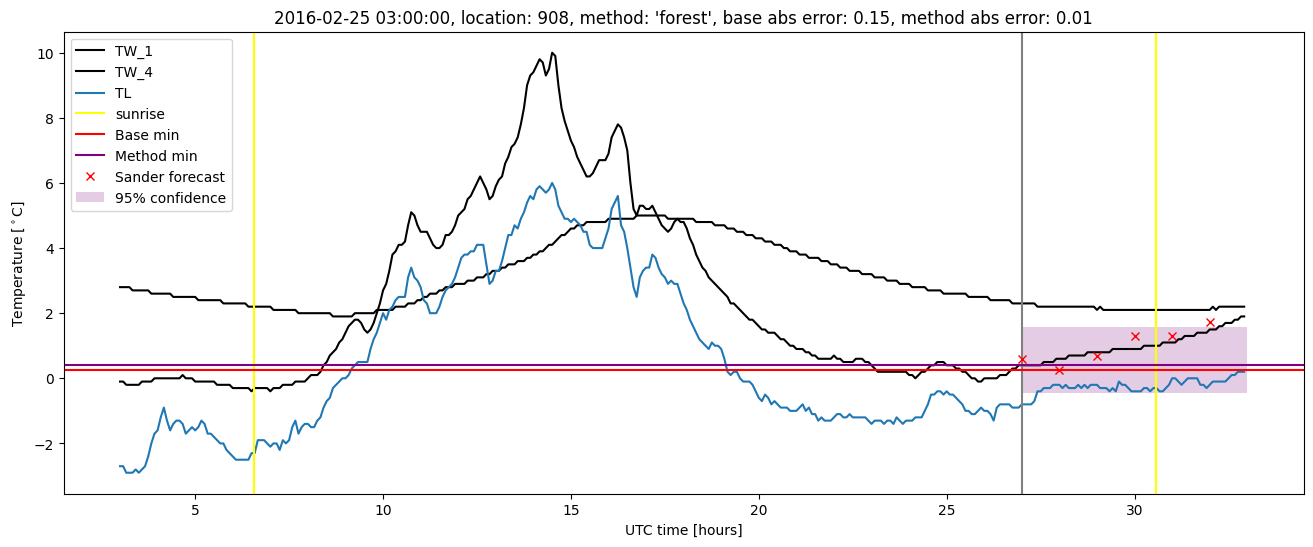
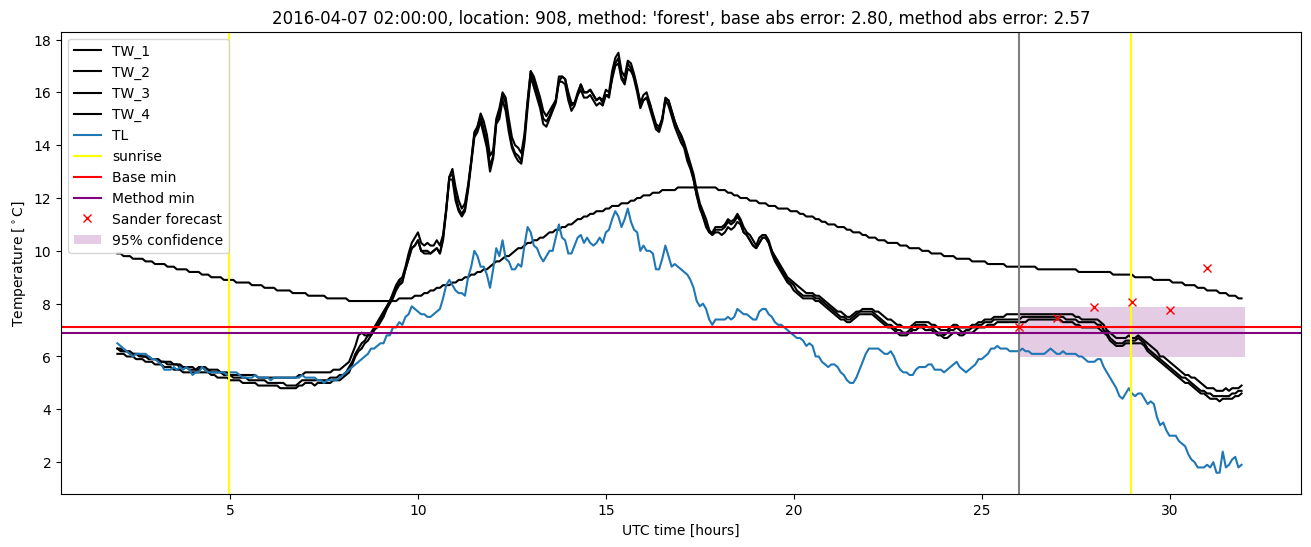
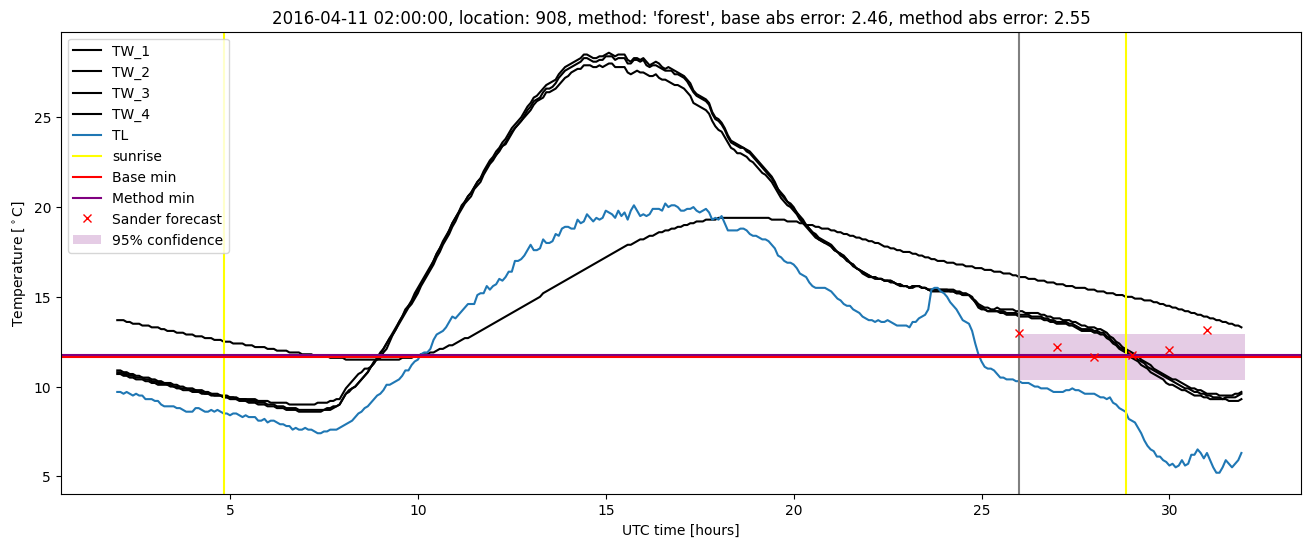
| forest |
winter 2016 |
0.988 |
0.158 |
0.339 |
0.402 |
2.572 |
0.499 |
5.653 |
| baseline |
winter 2017 |
0.963 |
0.075 |
0.445 |
0.451 |
2.700 |
NaN |
NaN |
| forest |
winter 2017 |
0.982 |
0.025 |
0.348 |
0.391 |
2.354 |
0.478 |
4.403 |
| baseline |
winter 2018 |
0.977 |
0.125 |
0.299 |
0.394 |
2.260 |
NaN |
NaN |
| forest |
winter 2018 |
0.962 |
0.062 |
0.245 |
0.369 |
1.900 |
0.488 |
3.727 |
| baseline |
winter 2019 |
0.992 |
0.000e+00 |
0.315 |
0.402 |
2.173 |
NaN |
NaN |
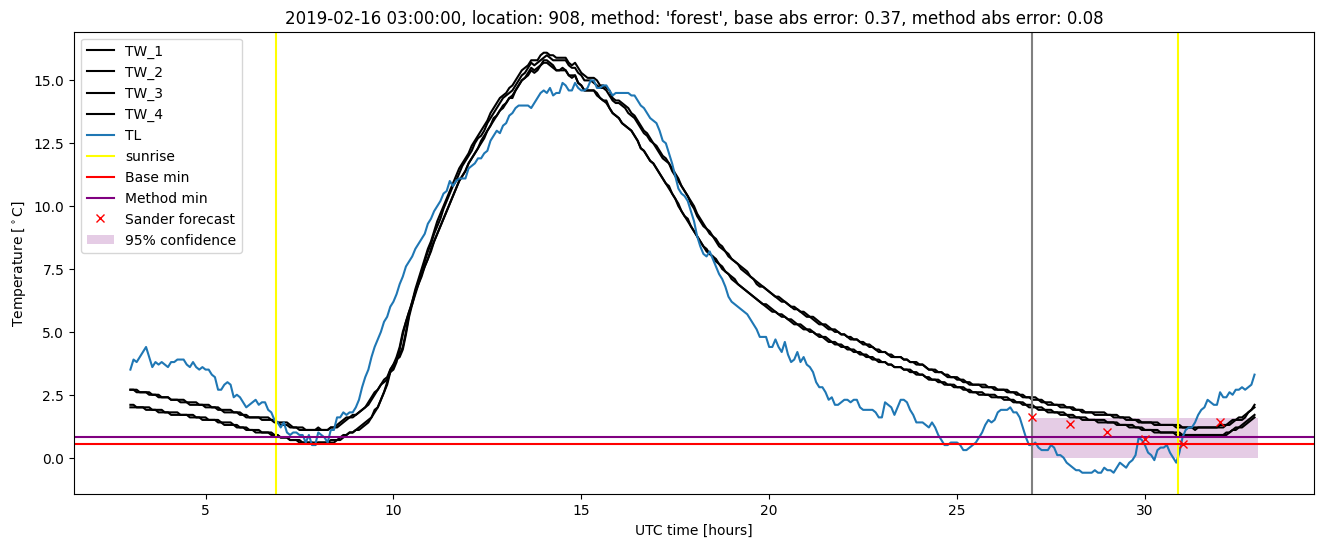
| forest |
winter 2019 |
0.992 |
0.048 |
0.224 |
0.341 |
1.536 |
0.475 |
3.136 |
| baseline |
all |
0.978 |
0.071 |
0.364 |
0.424 |
2.798 |
NaN |
NaN |
| forest |
all |
0.981 |
0.062 |
0.291 |
0.377 |
2.572 |
0.486 |
4.302 |
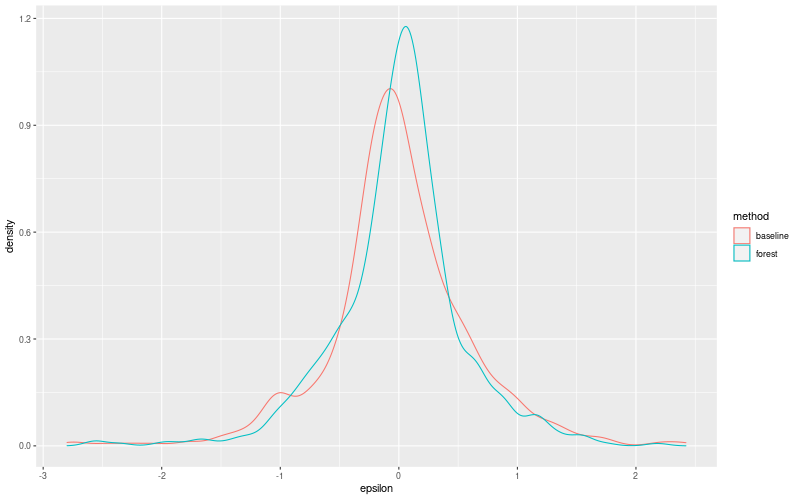
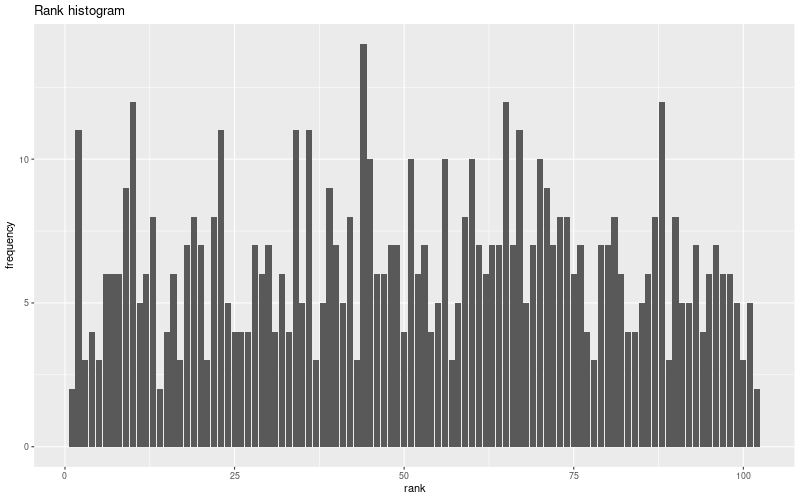
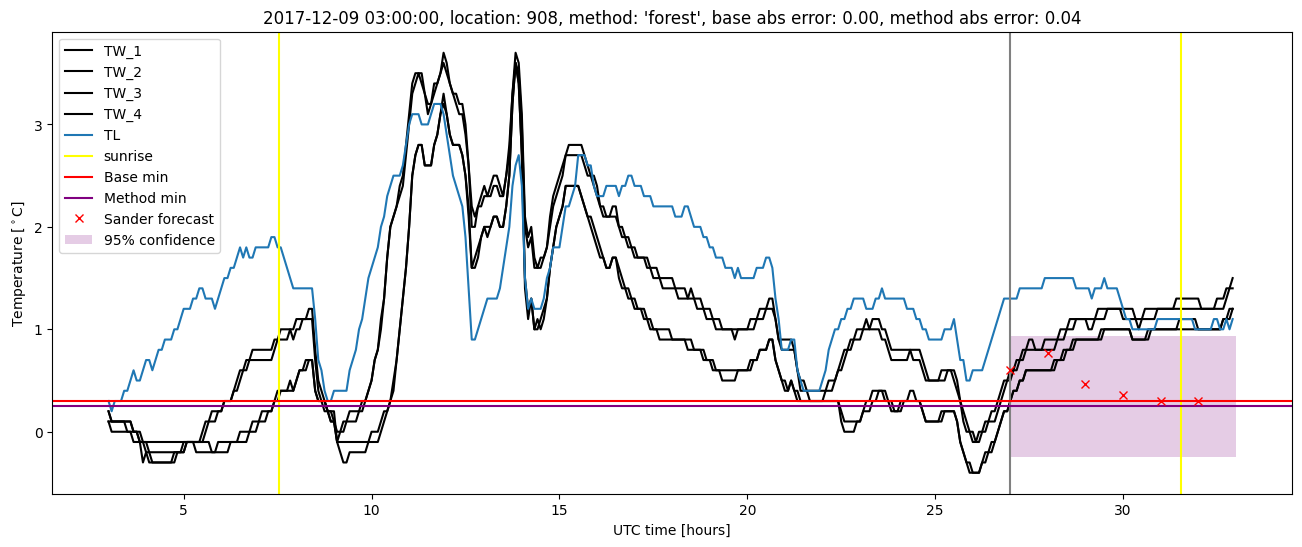
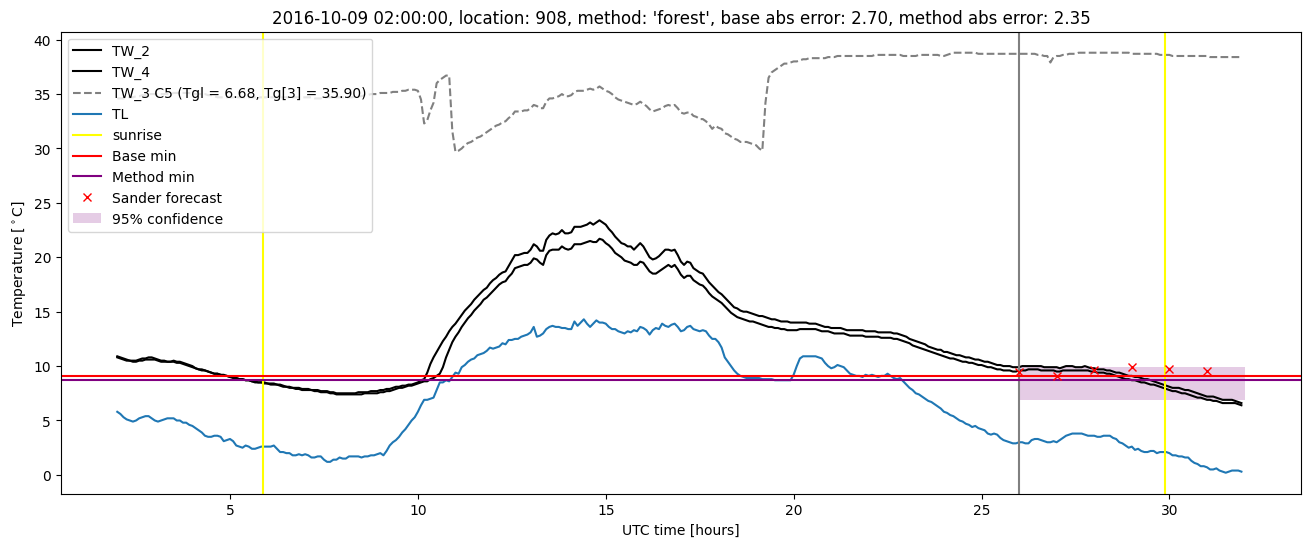
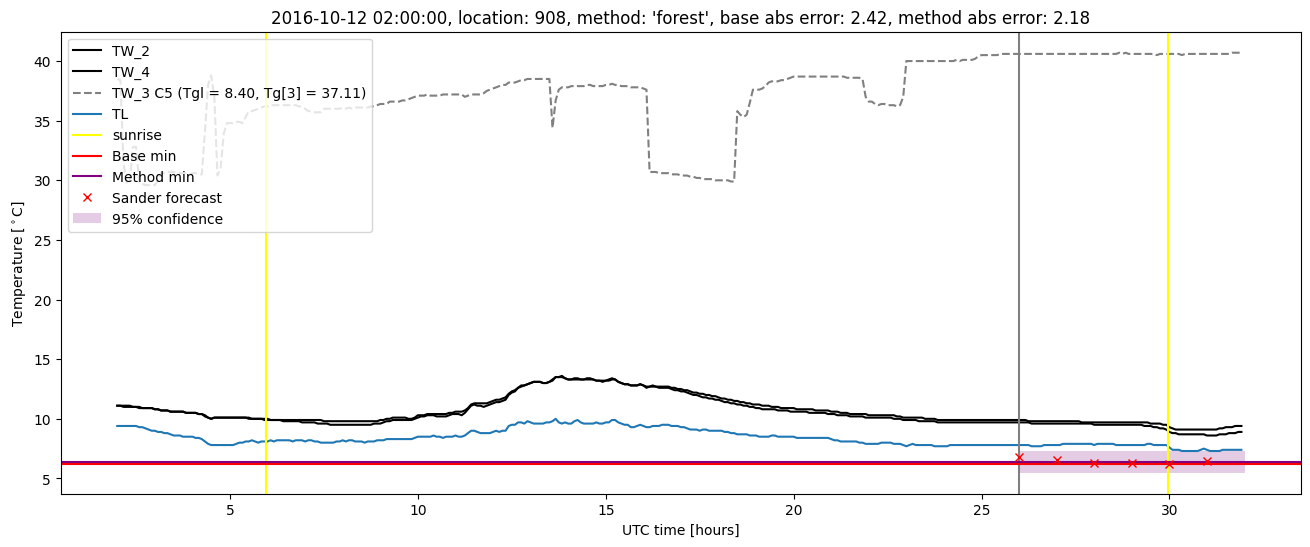
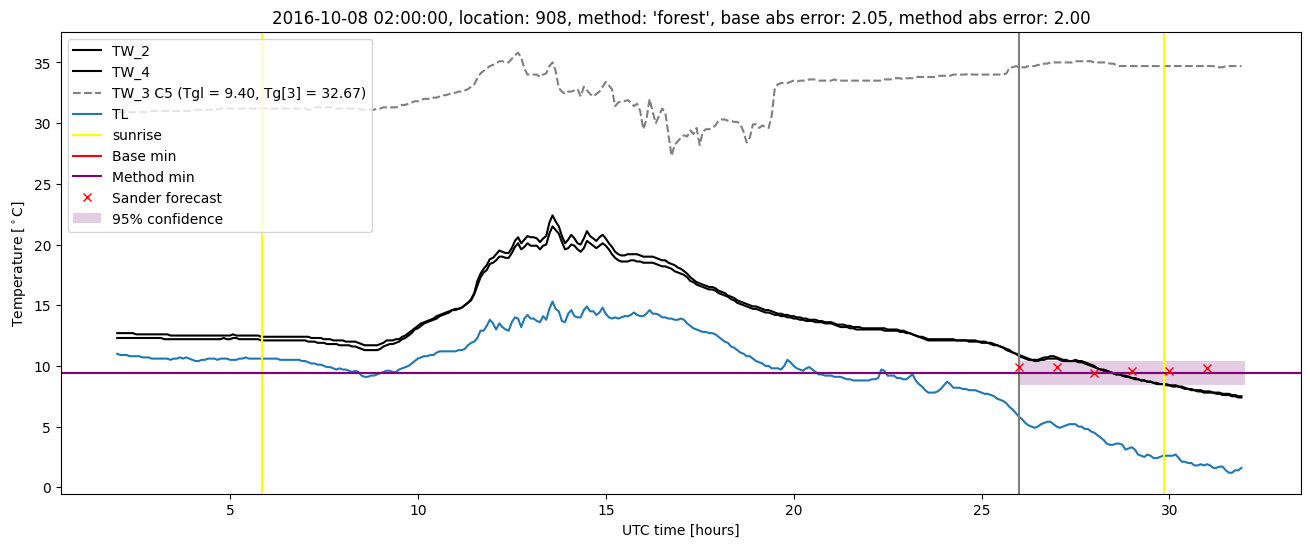
Random forest plots
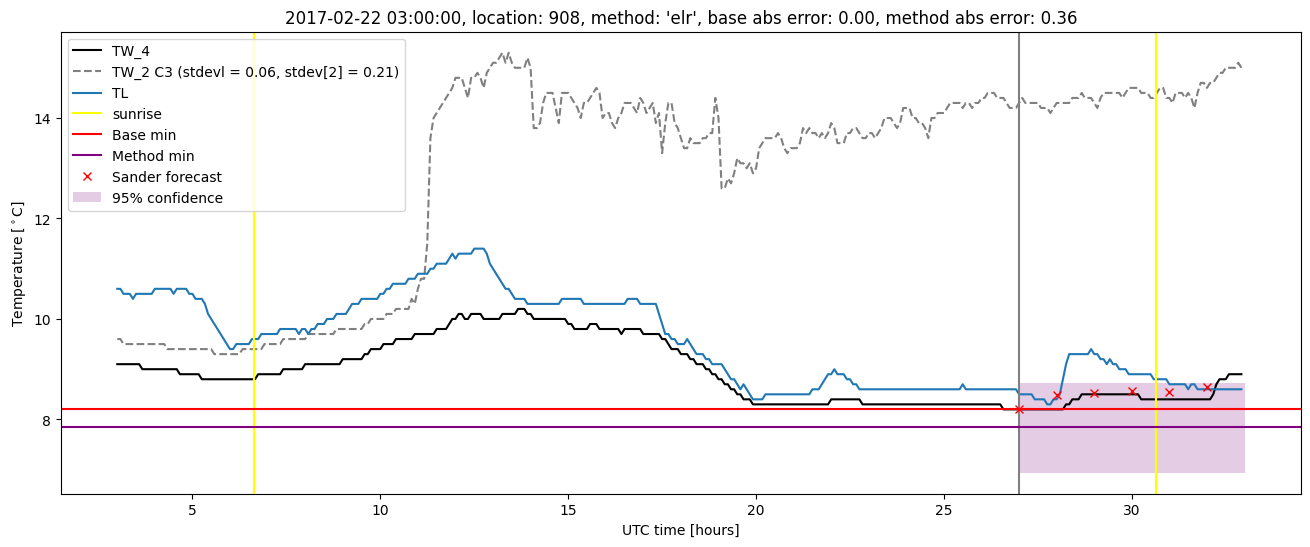
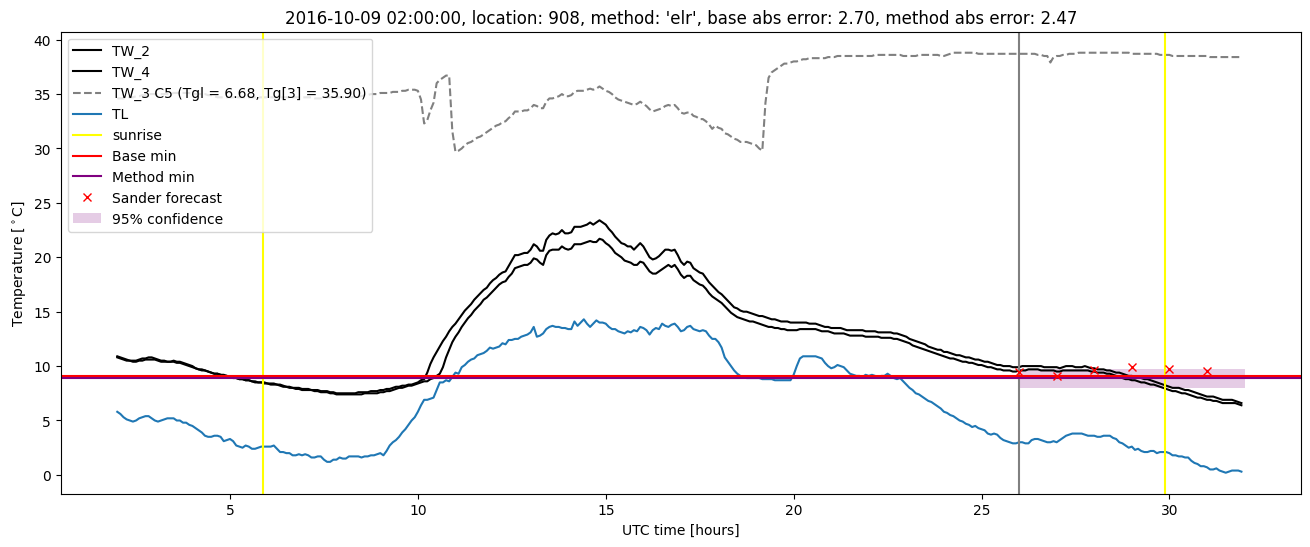
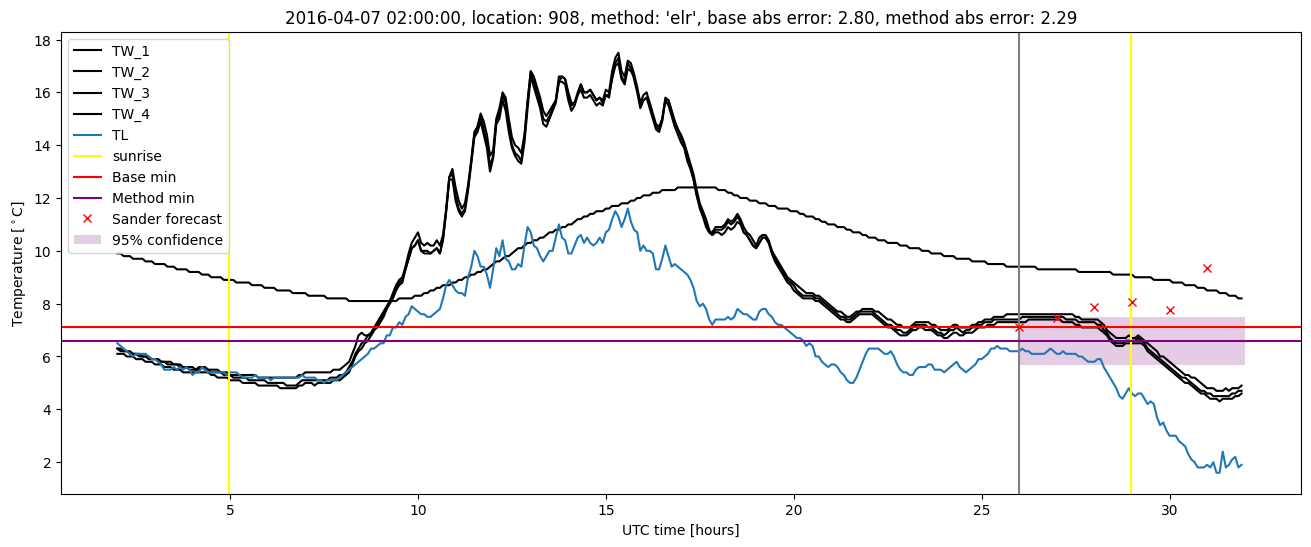
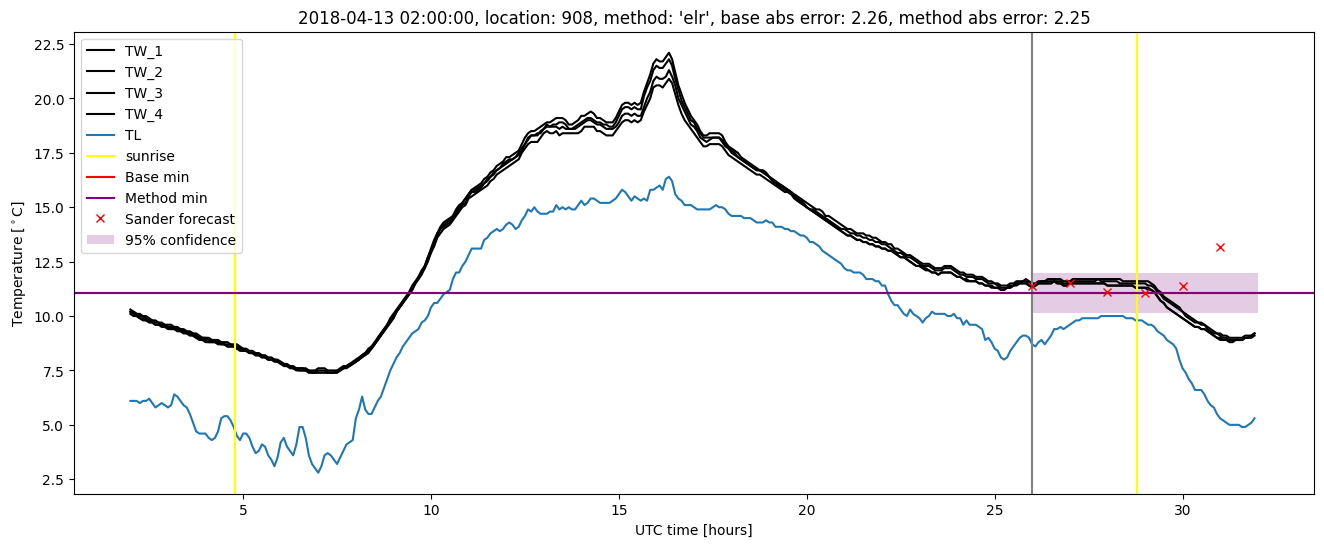
Extended logistic regression results
| names |
period |
power |
significance |
meanSquareError |
absError |
maxError |
CRPS |
IGN |
| baseline |
winter 2016 |
0.976 |
0.053 |
0.397 |
0.446 |
2.798 |
NaN |
NaN |
| elr |
winter 2016 |
0.976 |
0.105 |
0.337 |
0.408 |
2.531 |
0.560 |
4.165 |
| baseline |
winter 2017 |
0.963 |
0.075 |
0.445 |
0.451 |
2.700 |
NaN |
NaN |
| elr |
winter 2017 |
0.982 |
0.050 |
0.374 |
0.418 |
2.467 |
0.524 |
3.783 |
| baseline |
winter 2018 |
0.977 |
0.125 |
0.299 |
0.394 |
2.260 |
NaN |
NaN |
| elr |
winter 2018 |
0.985 |
0.062 |
0.286 |
0.411 |
2.249 |
0.545 |
3.687 |
| baseline |
winter 2019 |
0.992 |
0.000e+00 |
0.315 |
0.402 |
2.173 |
NaN |
NaN |
| elr |
winter 2019 |
0.992 |
0.000e+00 |
0.255 |
0.374 |
1.788 |
0.533 |
3.161 |
| baseline |
all |
0.978 |
0.071 |
0.364 |
0.424 |
2.798 |
NaN |
NaN |
| elr |
all |
0.983 |
0.054 |
0.314 |
0.403 |
2.531 |
0.542 |
3.725 |
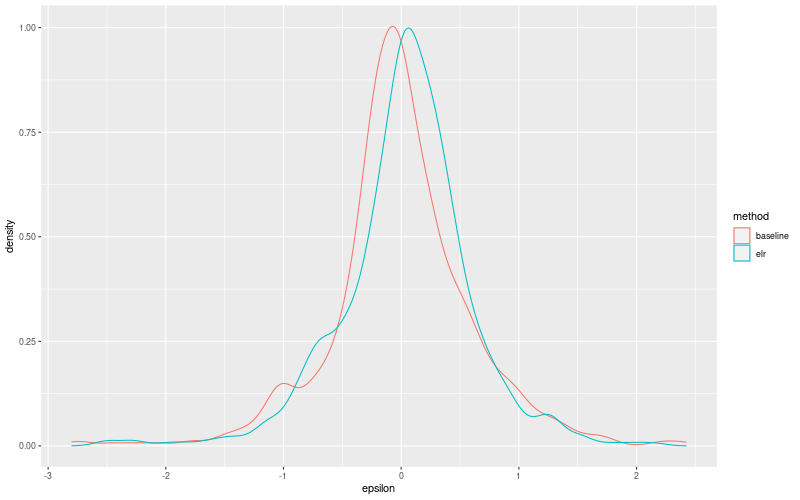
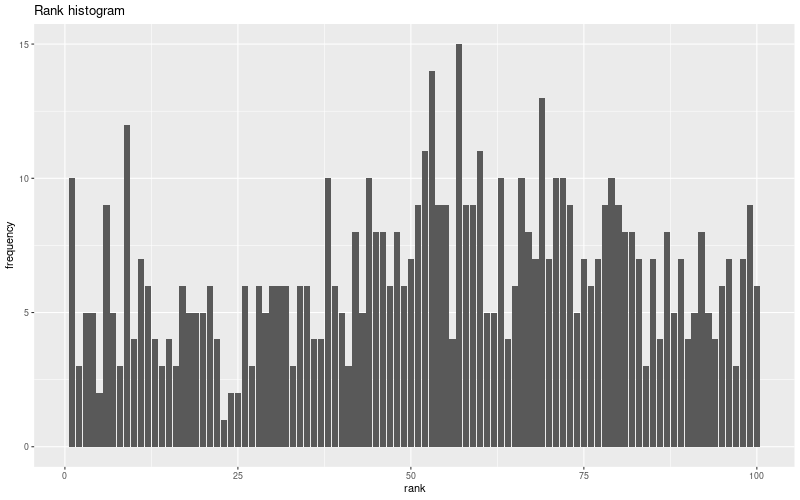
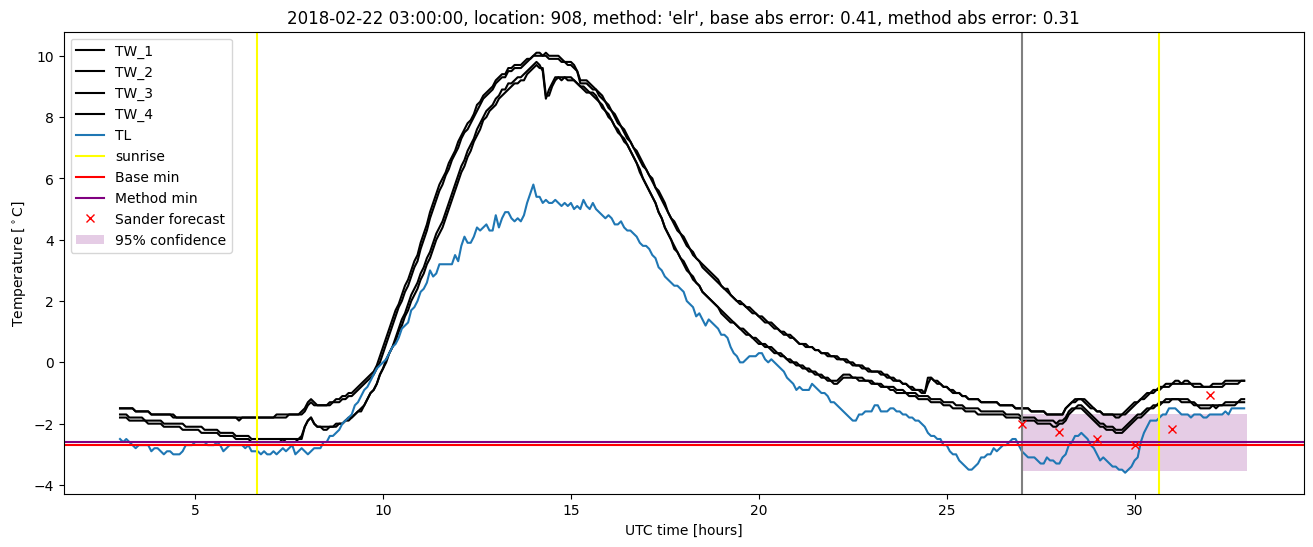
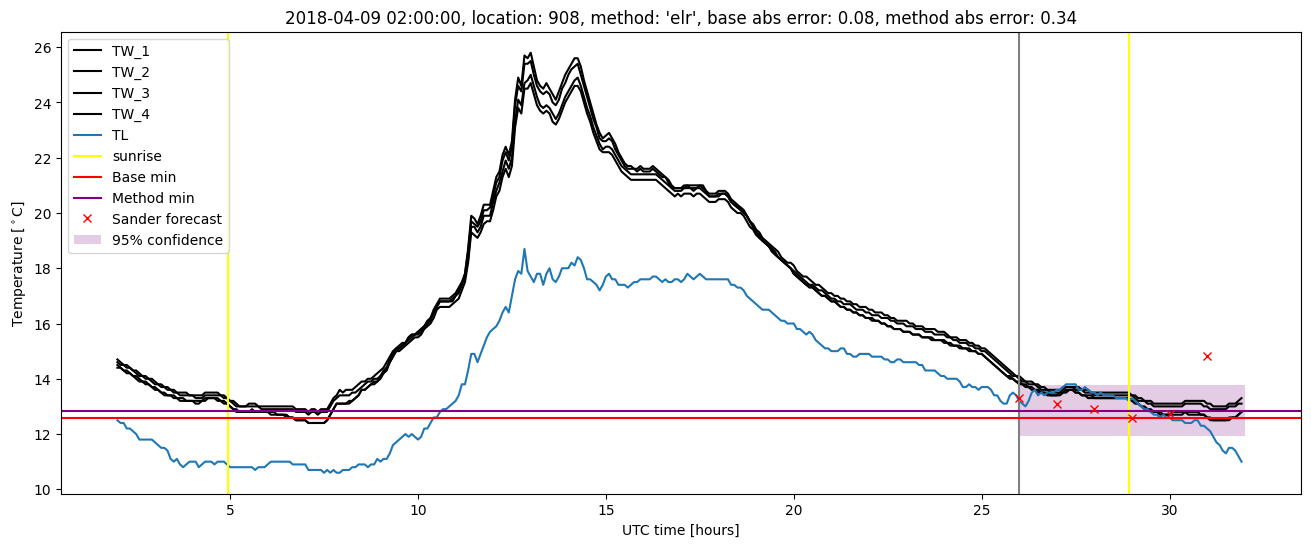
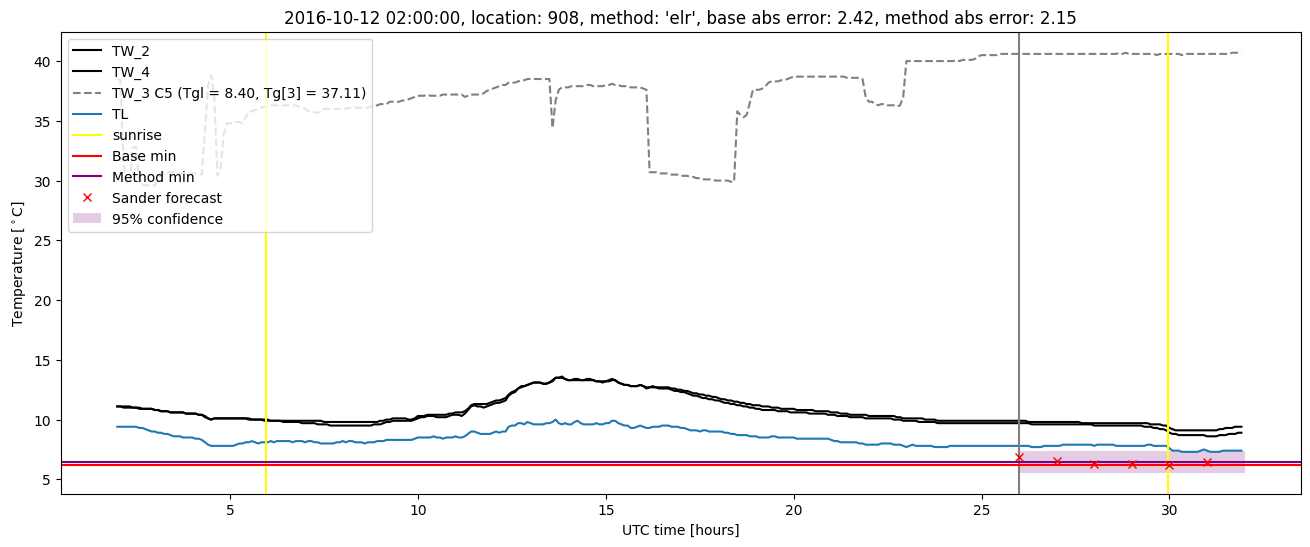
Extended logistic regression plots