GMS location: 906
Random forest results
| names |
period |
power |
significance |
meanSquareError |
absError |
maxError |
CRPS |
IGN |
| baseline |
winter 2016 |
0.979 |
0.000e+00 |
0.348 |
0.444 |
1.883 |
NaN |
NaN |
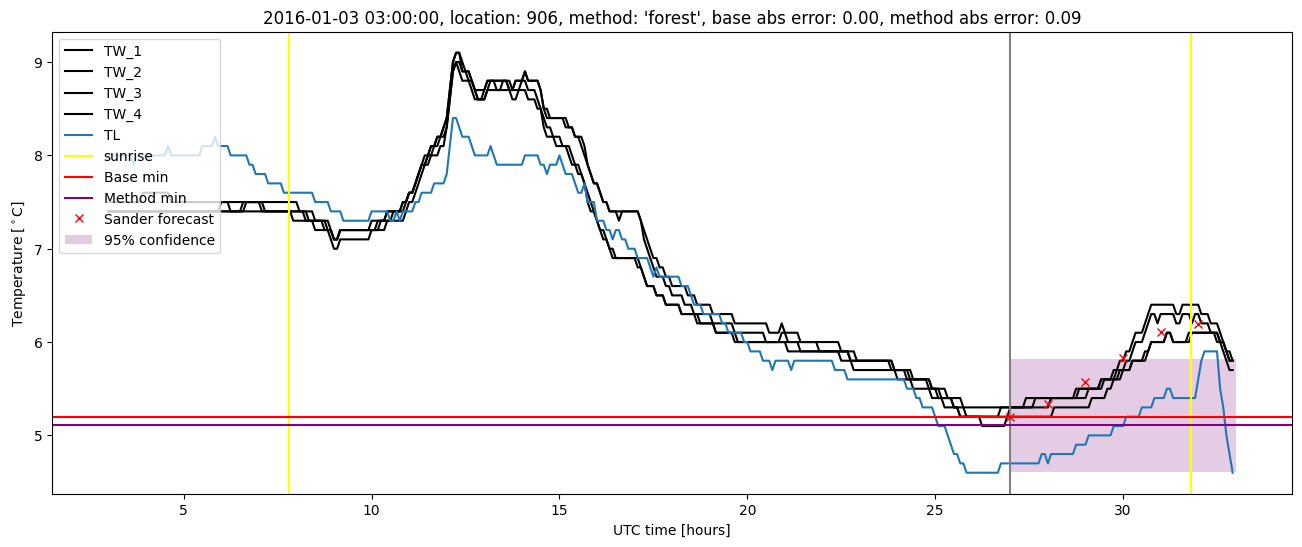
| forest |
winter 2016 |
1.000 |
0.143 |
0.215 |
0.358 |
1.393 |
0.410 |
2.574 |
| baseline |
winter 2017 |
0.954 |
0.083 |
0.446 |
0.501 |
2.353 |
NaN |
NaN |
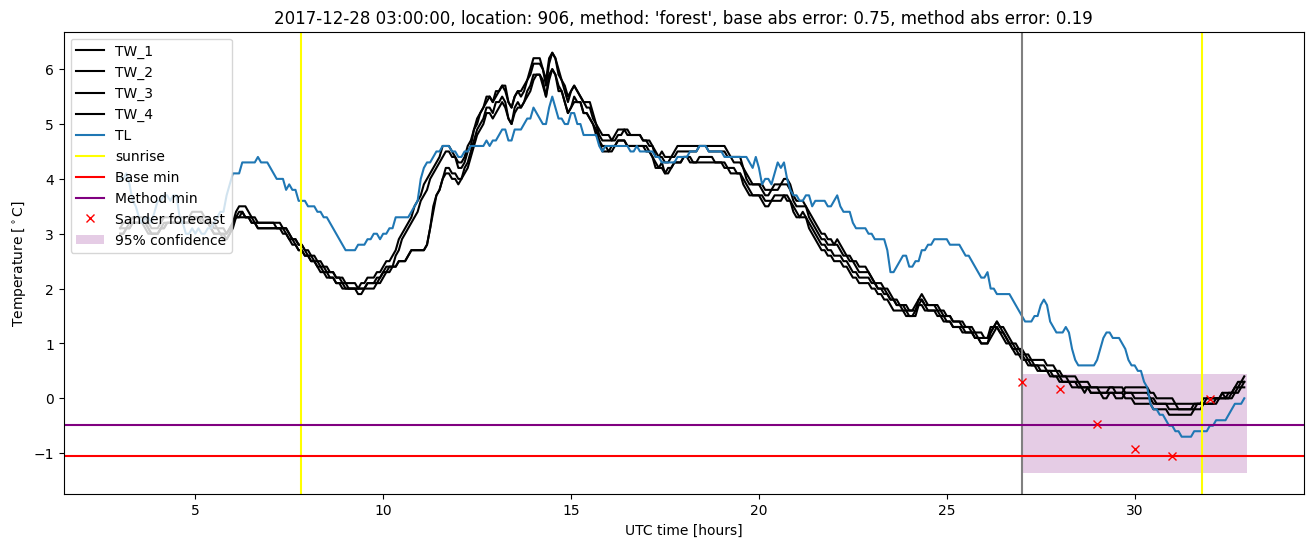
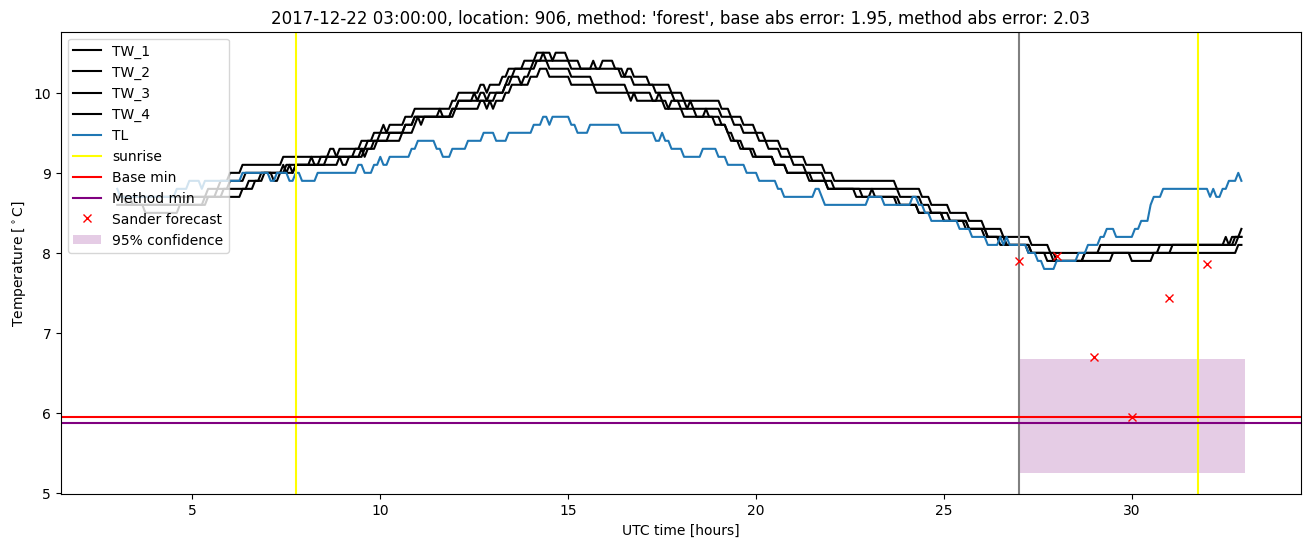
| forest |
winter 2017 |
0.969 |
0.083 |
0.277 |
0.405 |
1.746 |
0.420 |
3.590 |
| baseline |
winter 2018 |
0.987 |
0.095 |
0.355 |
0.460 |
1.946 |
NaN |
NaN |
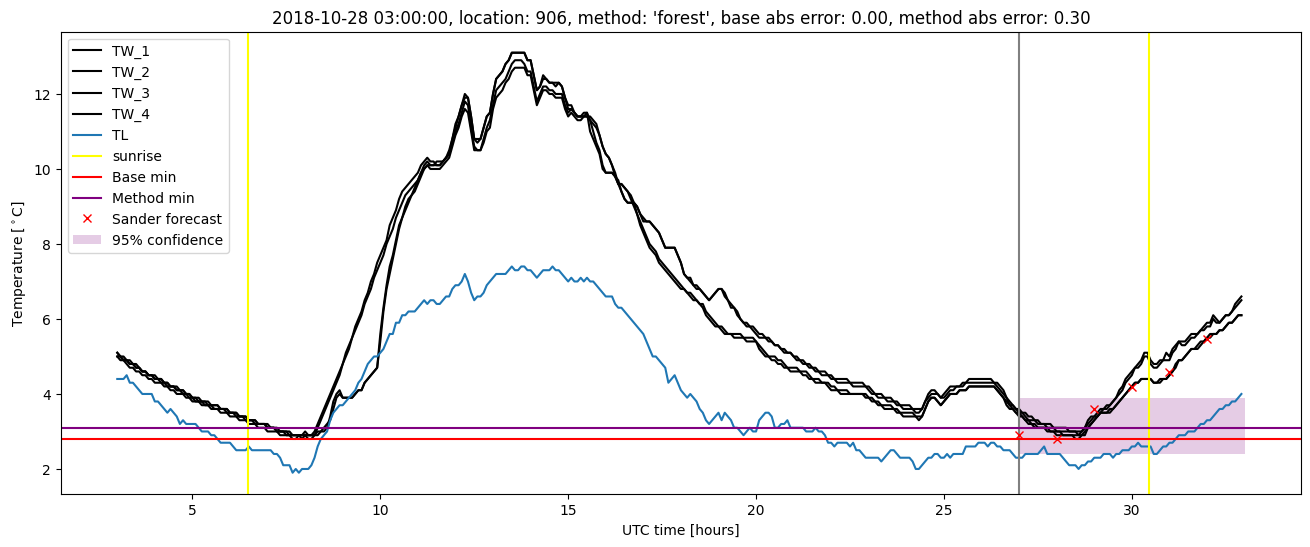
| forest |
winter 2018 |
1.000 |
0.143 |
0.302 |
0.406 |
2.028 |
0.429 |
2.789 |
| baseline |
winter 2019 |
0.977 |
0.000e+00 |
0.346 |
0.446 |
2.180 |
NaN |
NaN |
| forest |
winter 2019 |
0.992 |
0.000e+00 |
0.233 |
0.356 |
1.534 |
0.421 |
2.703 |
| baseline |
all |
0.975 |
0.058 |
0.372 |
0.462 |
2.353 |
NaN |
NaN |
| forest |
all |
0.992 |
0.101 |
0.255 |
0.381 |
2.028 |
0.419 |
2.890 |
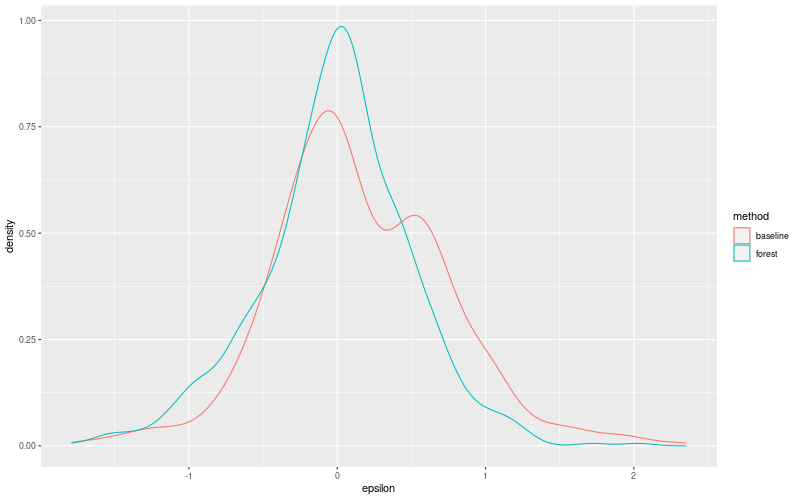
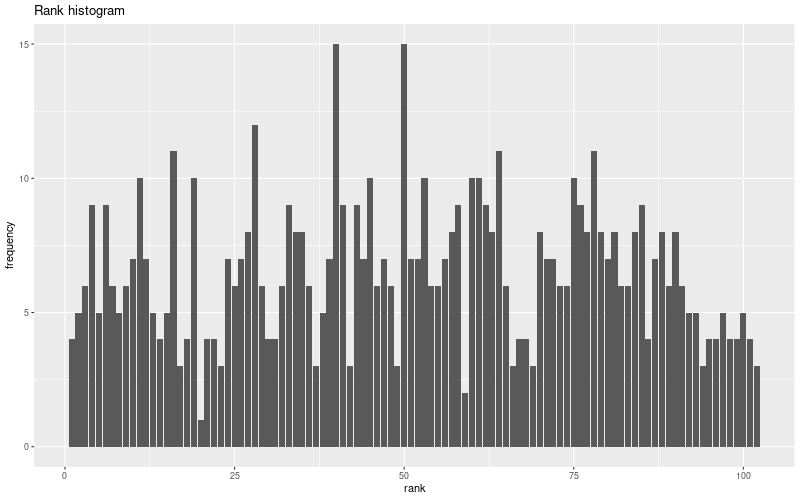
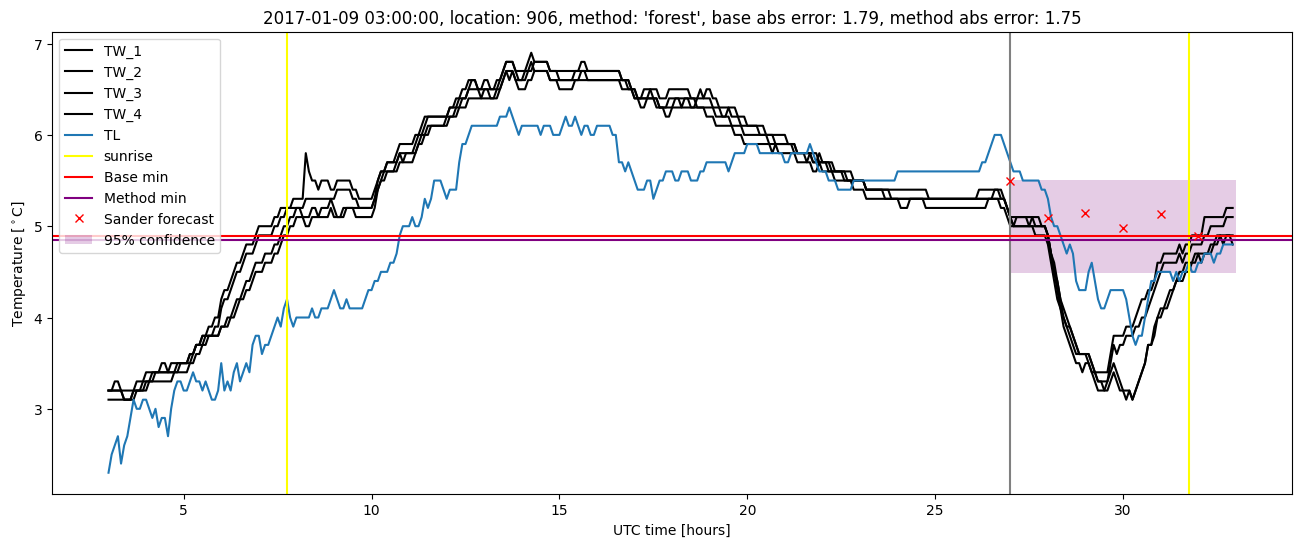
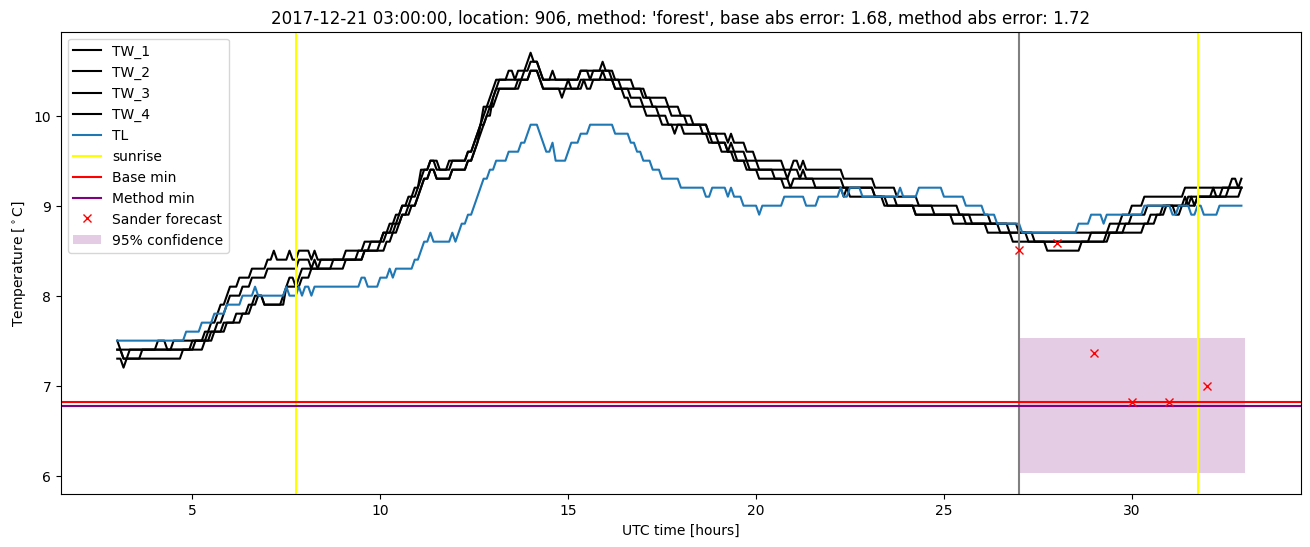
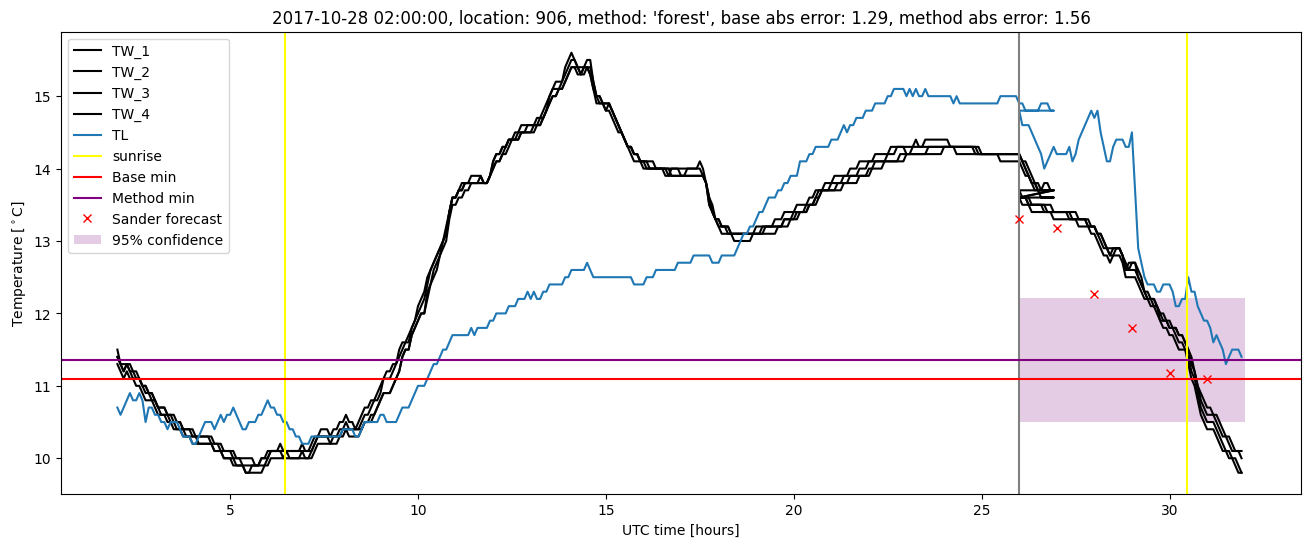
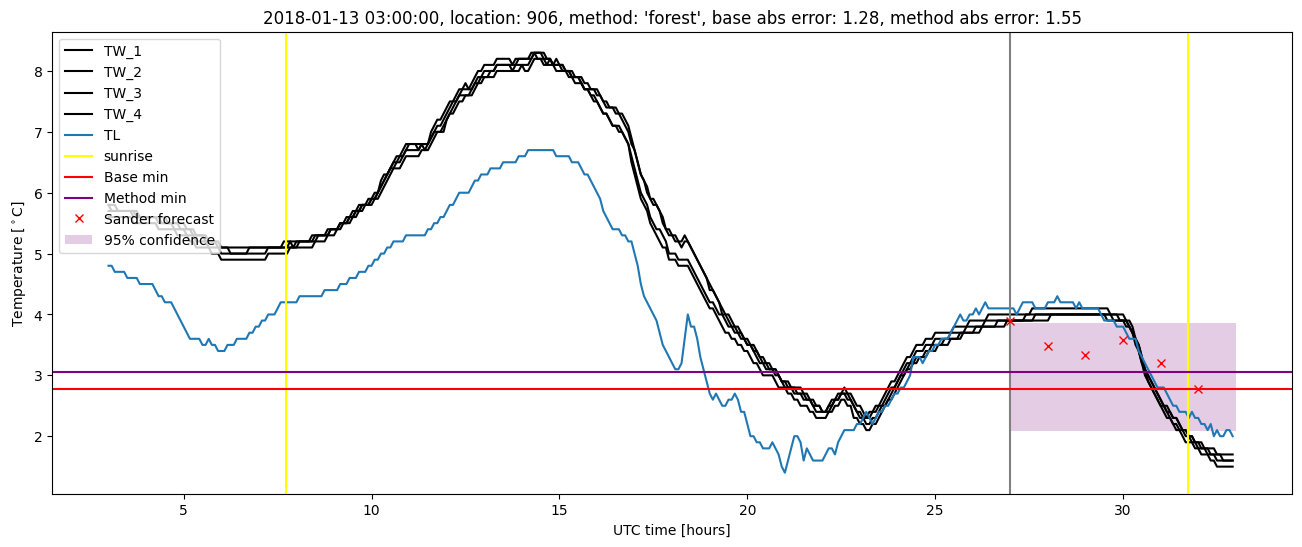
Random forest plots
Extended logistic regression results
| names |
period |
power |
significance |
meanSquareError |
absError |
maxError |
CRPS |
IGN |
| baseline |
winter 2016 |
0.979 |
0.000e+00 |
0.348 |
0.444 |
1.883 |
NaN |
NaN |
| elr |
winter 2016 |
1.000 |
0.143 |
0.250 |
0.389 |
1.734 |
0.458 |
3.232 |
| baseline |
winter 2017 |
0.954 |
0.083 |
0.446 |
0.501 |
2.353 |
NaN |
NaN |
| elr |
winter 2017 |
0.969 |
0.083 |
0.312 |
0.430 |
1.823 |
0.456 |
4.241 |
| baseline |
winter 2018 |
0.987 |
0.095 |
0.355 |
0.460 |
1.946 |
NaN |
NaN |
| elr |
winter 2018 |
1.000 |
0.095 |
0.312 |
0.403 |
1.905 |
0.488 |
4.269 |
| baseline |
winter 2019 |
0.977 |
0.000e+00 |
0.346 |
0.446 |
2.180 |
NaN |
NaN |
| elr |
winter 2019 |
0.977 |
0.000e+00 |
0.240 |
0.359 |
1.851 |
0.474 |
3.908 |
| baseline |
all |
0.975 |
0.058 |
0.372 |
0.462 |
2.353 |
NaN |
NaN |
| elr |
all |
0.988 |
0.087 |
0.278 |
0.395 |
1.905 |
0.469 |
3.874 |
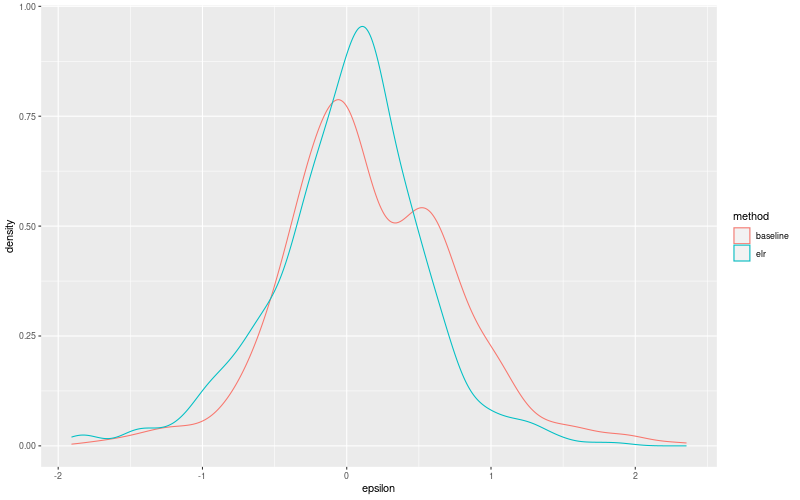
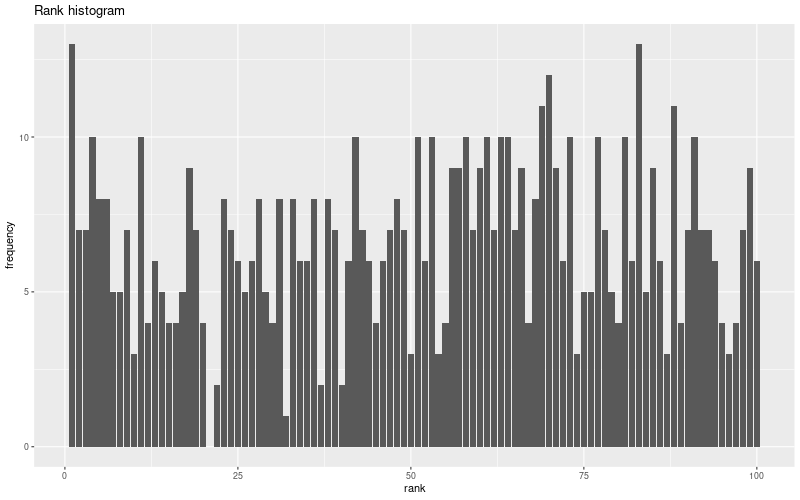
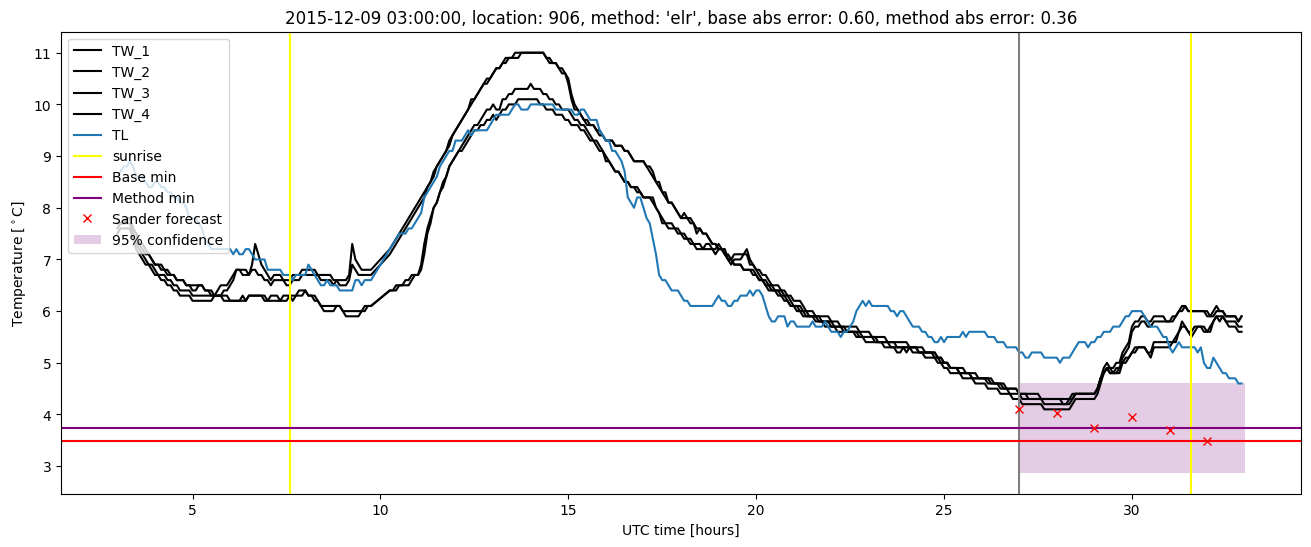
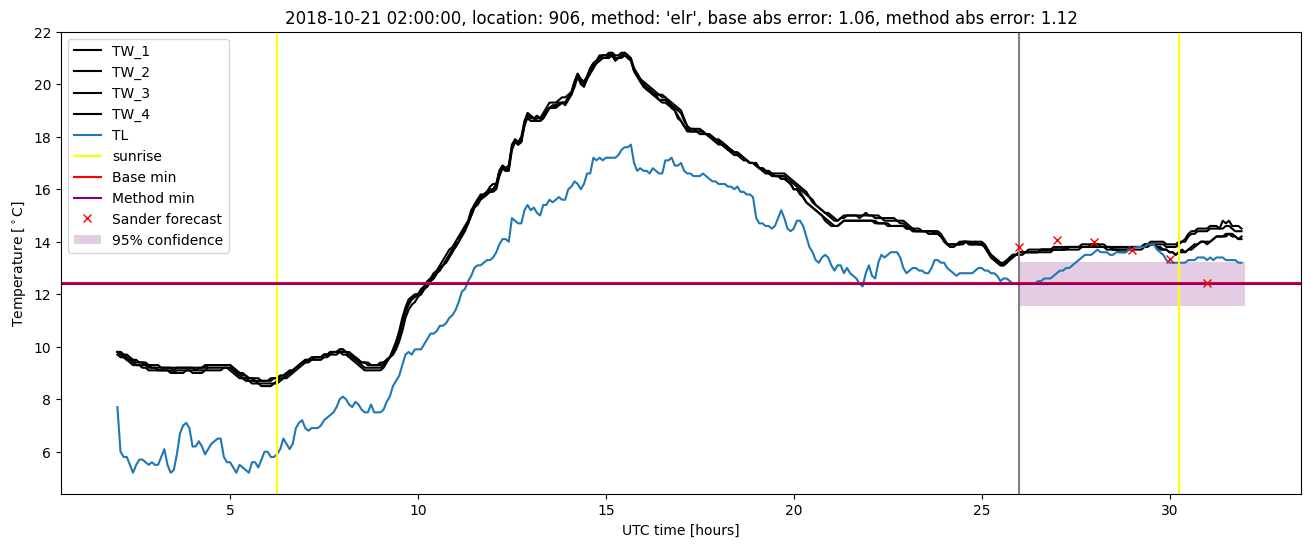
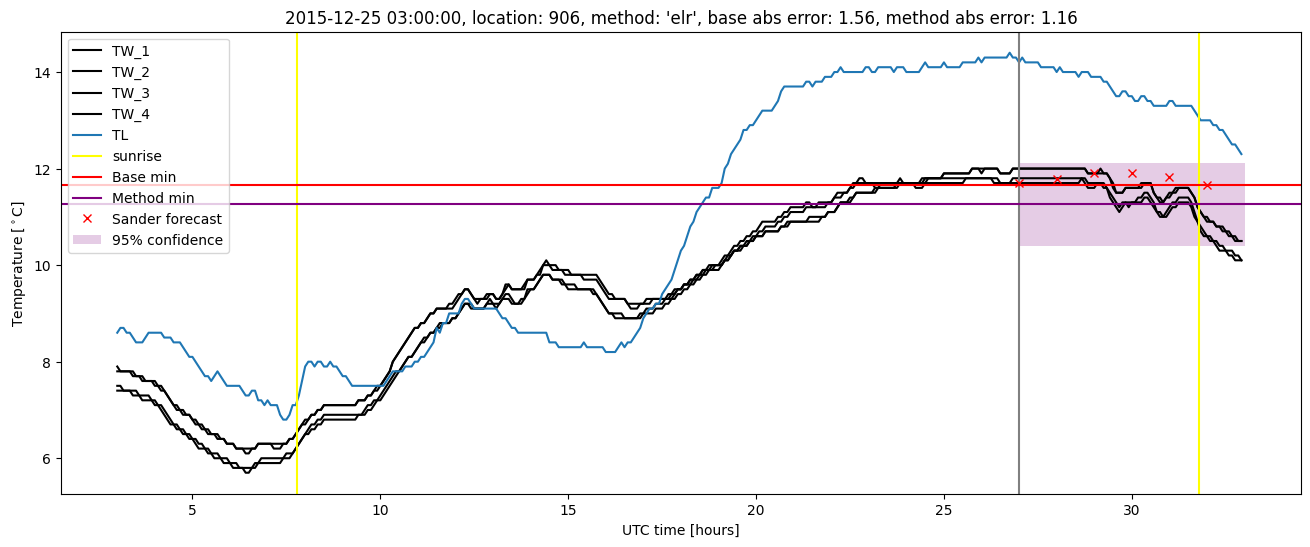
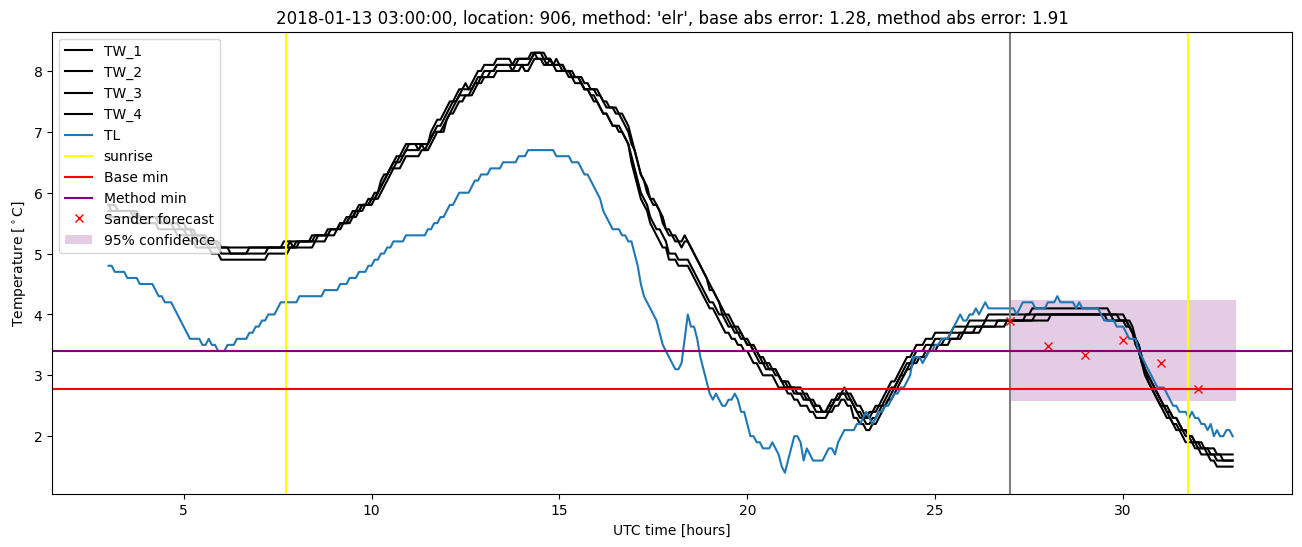
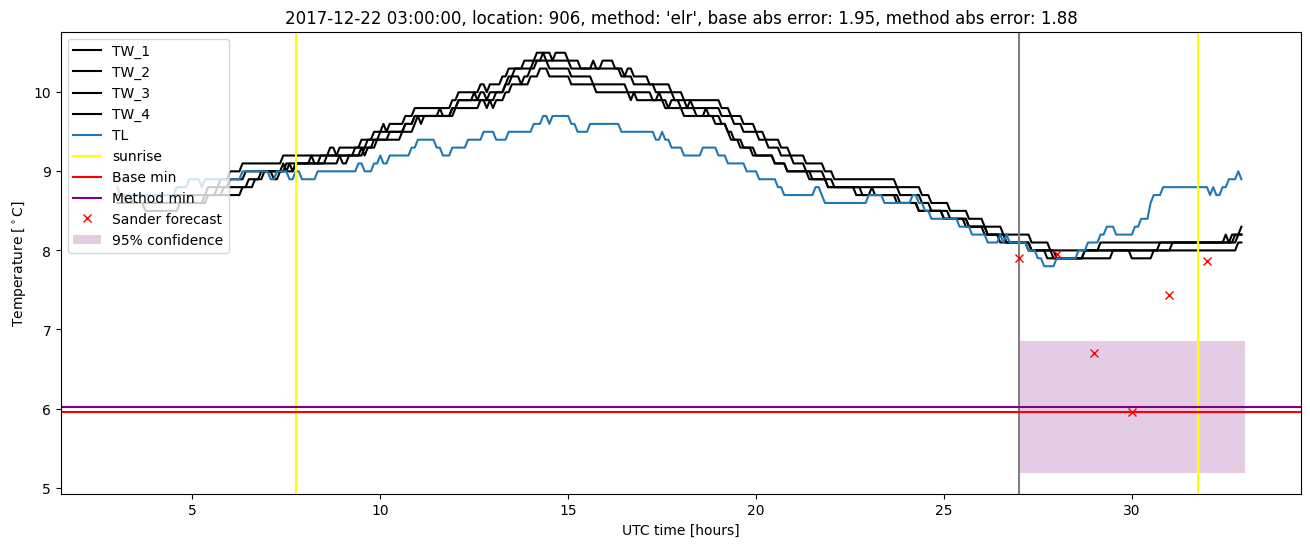
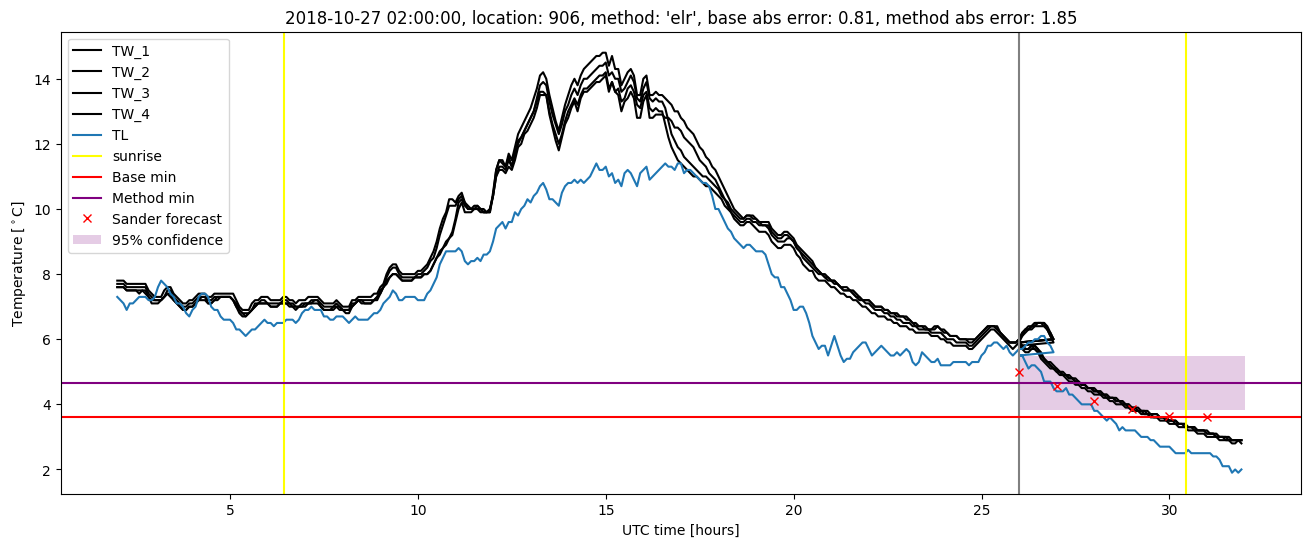
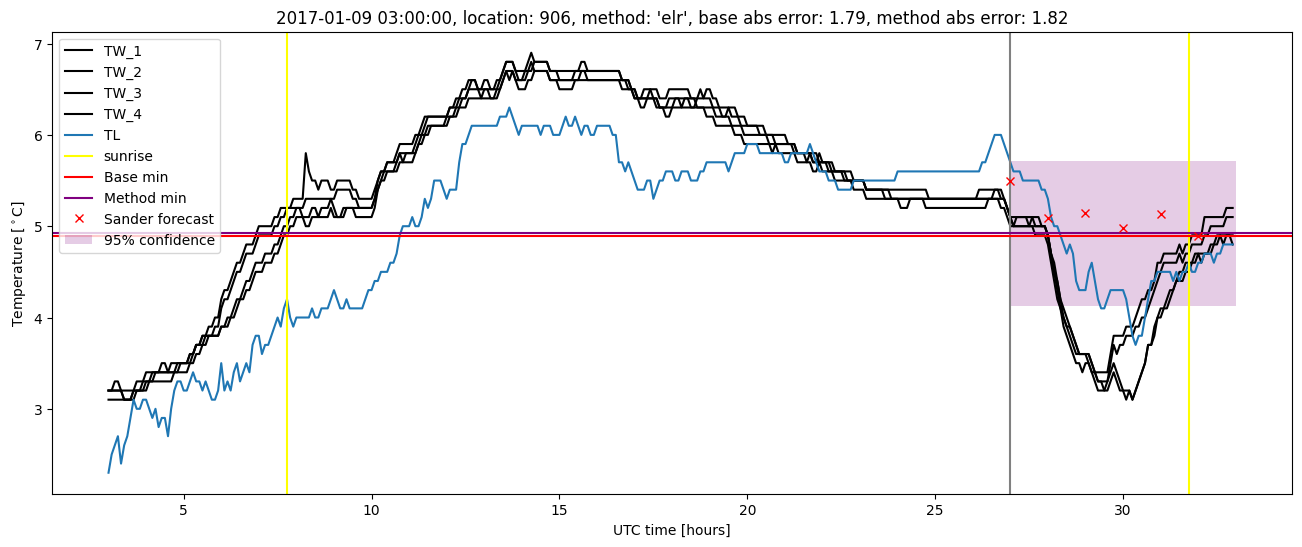
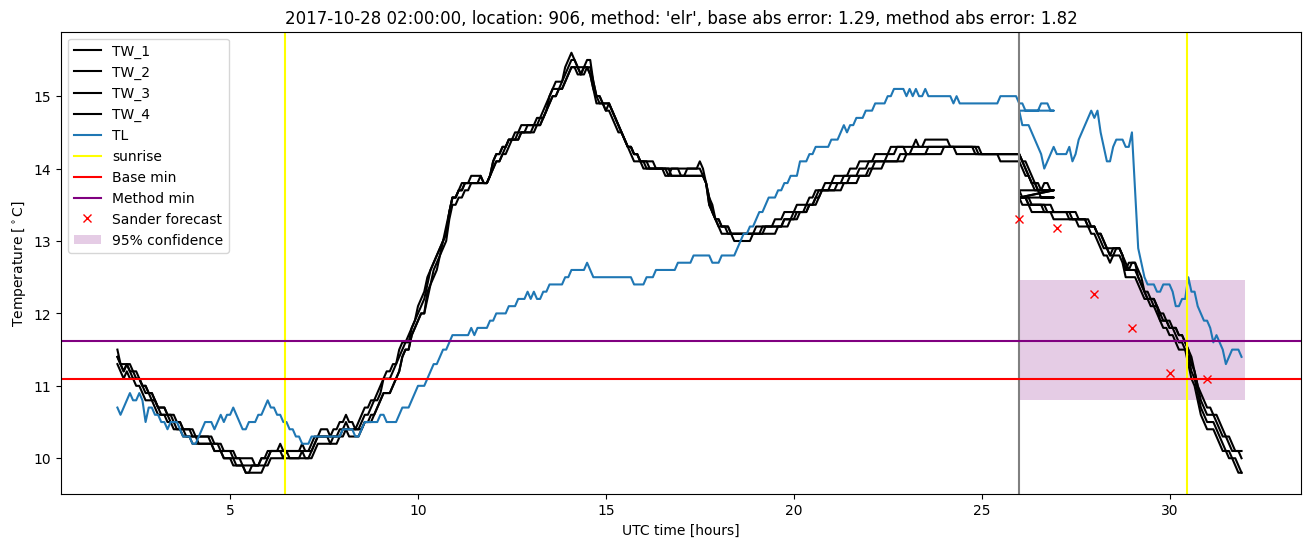
Extended logistic regression plots