GMS location: 904
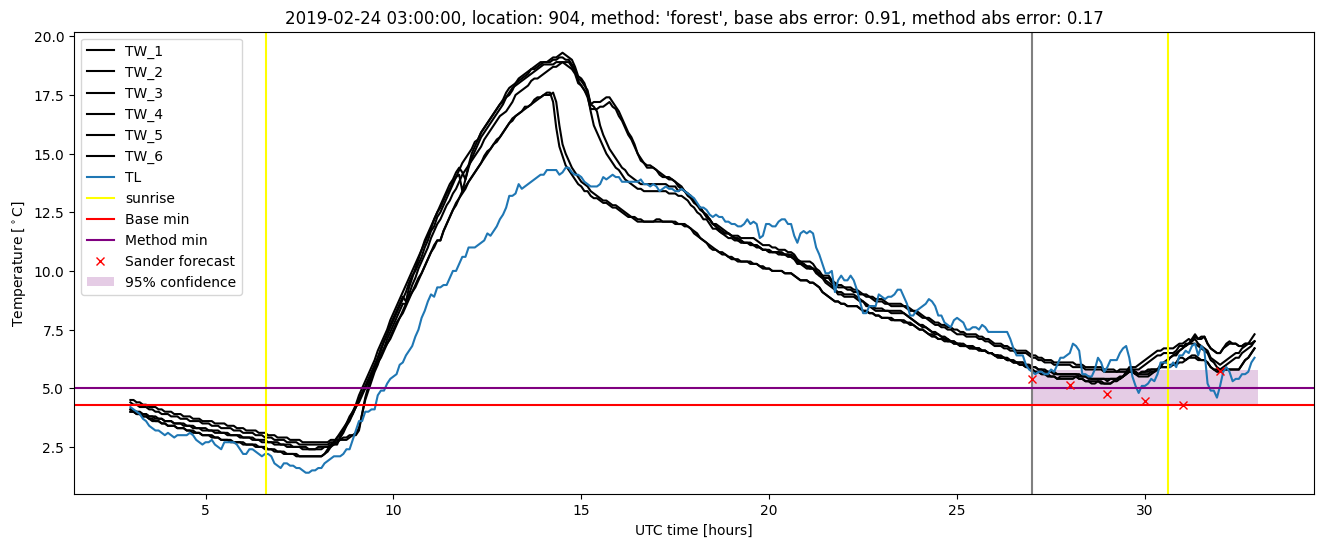
Random forest results
| names |
period |
power |
significance |
meanSquareError |
absError |
maxError |
CRPS |
IGN |
| baseline |
winter 2016 |
0.983 |
0.000e+00 |
0.364 |
0.470 |
1.947 |
NaN |
NaN |
| forest |
winter 2016 |
0.994 |
0.056 |
0.206 |
0.358 |
1.490 |
0.418 |
3.350 |
| baseline |
winter 2017 |
0.966 |
0.069 |
0.375 |
0.464 |
2.372 |
NaN |
NaN |
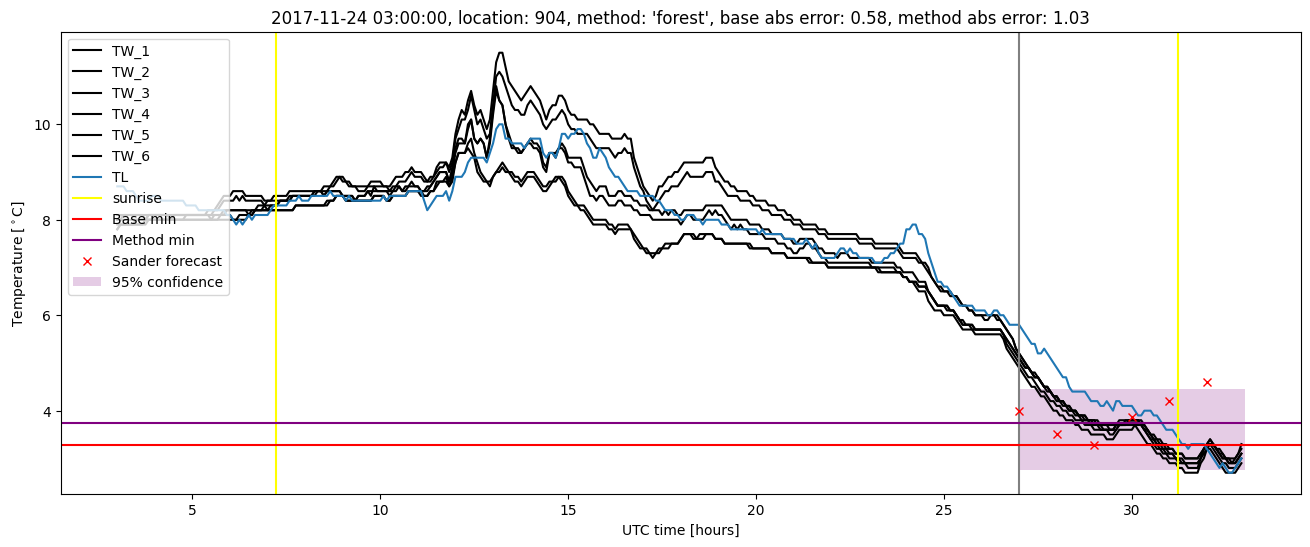
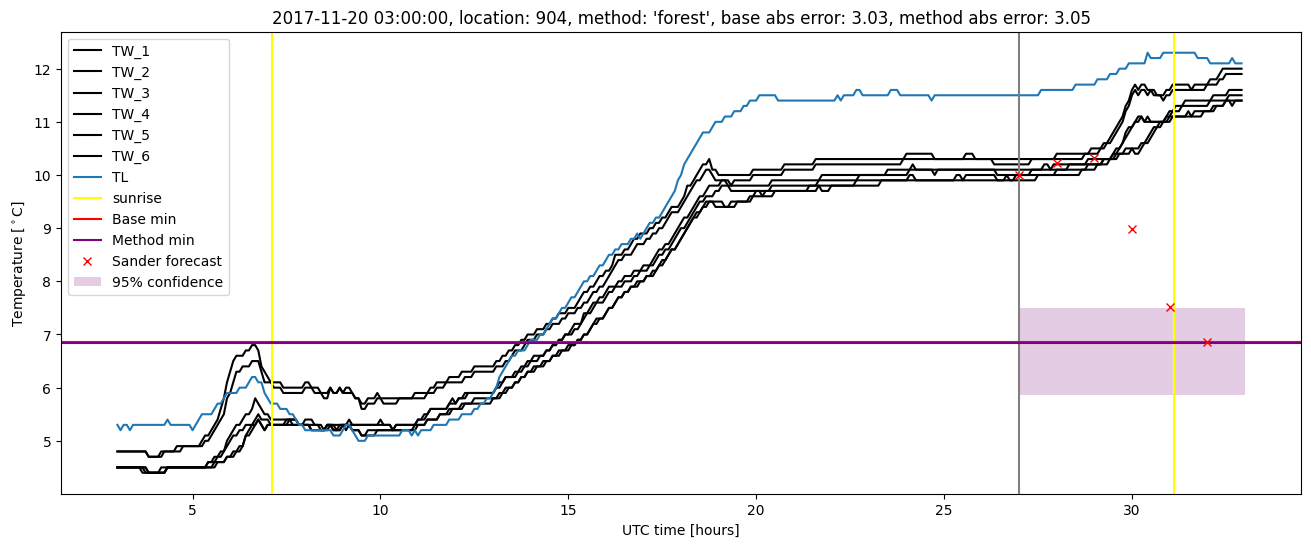
| forest |
winter 2017 |
0.983 |
0.035 |
0.209 |
0.342 |
1.848 |
0.426 |
2.803 |
| baseline |
winter 2018 |
0.968 |
0.160 |
0.455 |
0.486 |
3.034 |
NaN |
NaN |
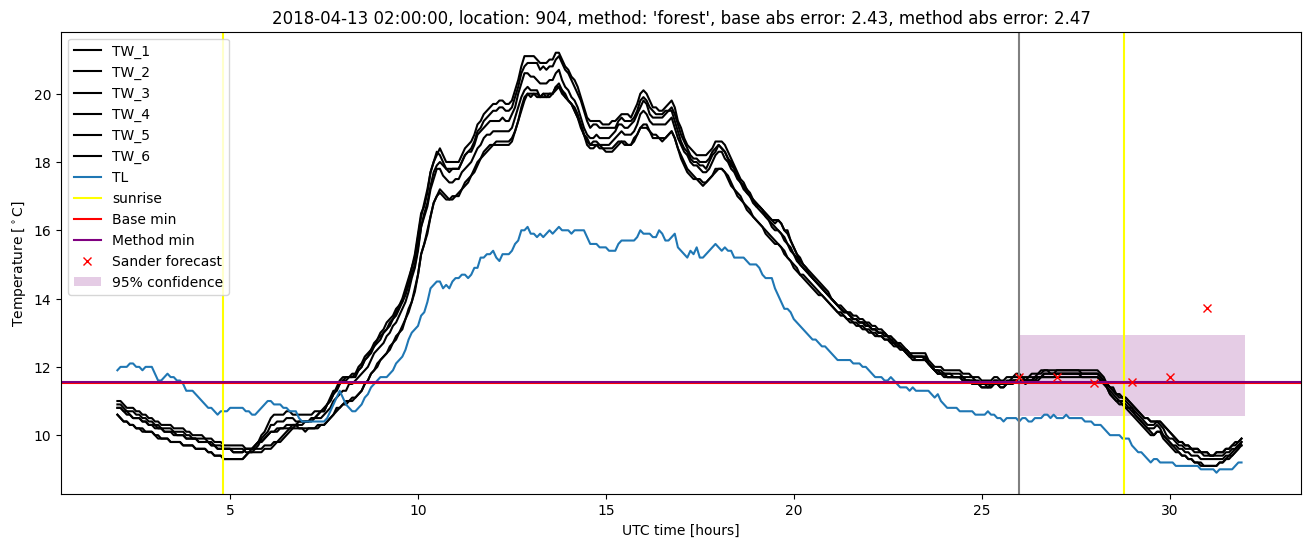
| forest |
winter 2018 |
0.975 |
0.160 |
0.382 |
0.431 |
3.052 |
0.427 |
4.538 |
| baseline |
winter 2019 |
0.991 |
0.000e+00 |
0.304 |
0.415 |
1.754 |
NaN |
NaN |
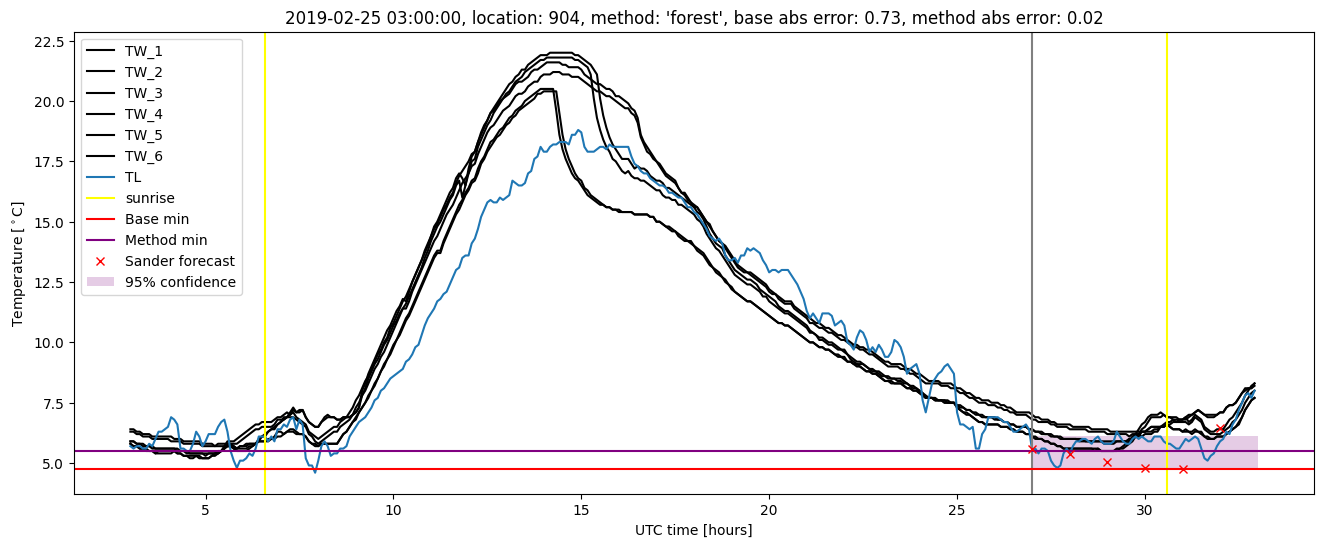
| forest |
winter 2019 |
0.991 |
0.143 |
0.174 |
0.314 |
1.187 |
0.420 |
2.772 |
| baseline |
all |
0.977 |
0.070 |
0.381 |
0.463 |
3.034 |
NaN |
NaN |
| forest |
all |
0.986 |
0.093 |
0.251 |
0.367 |
3.052 |
0.423 |
3.452 |
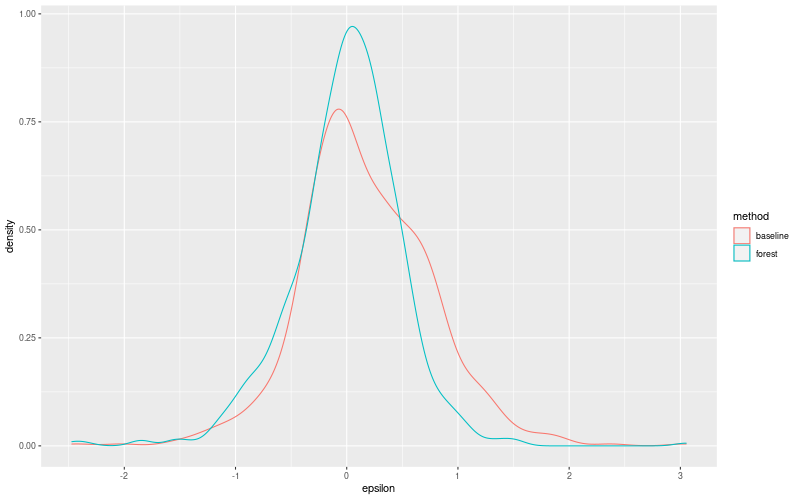
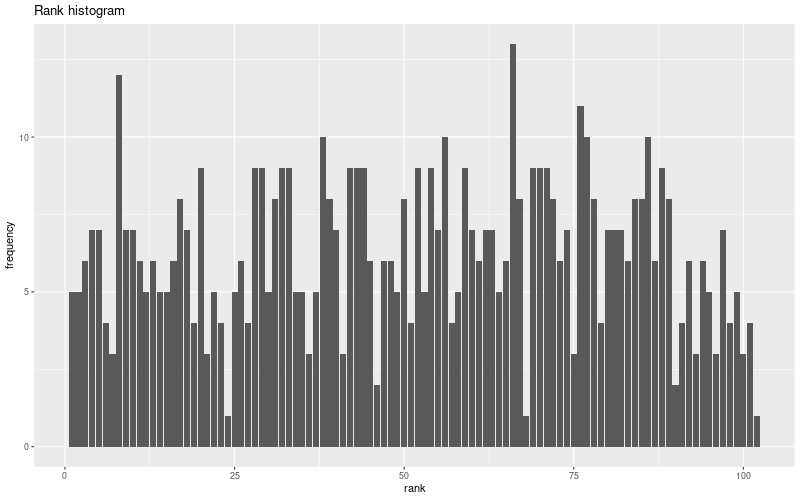
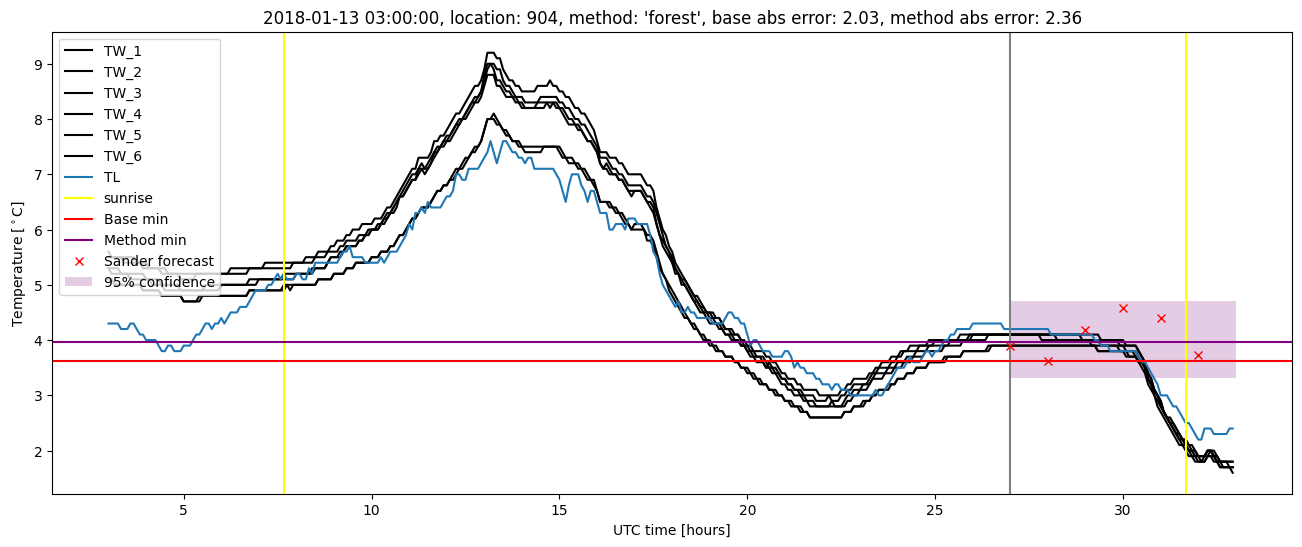
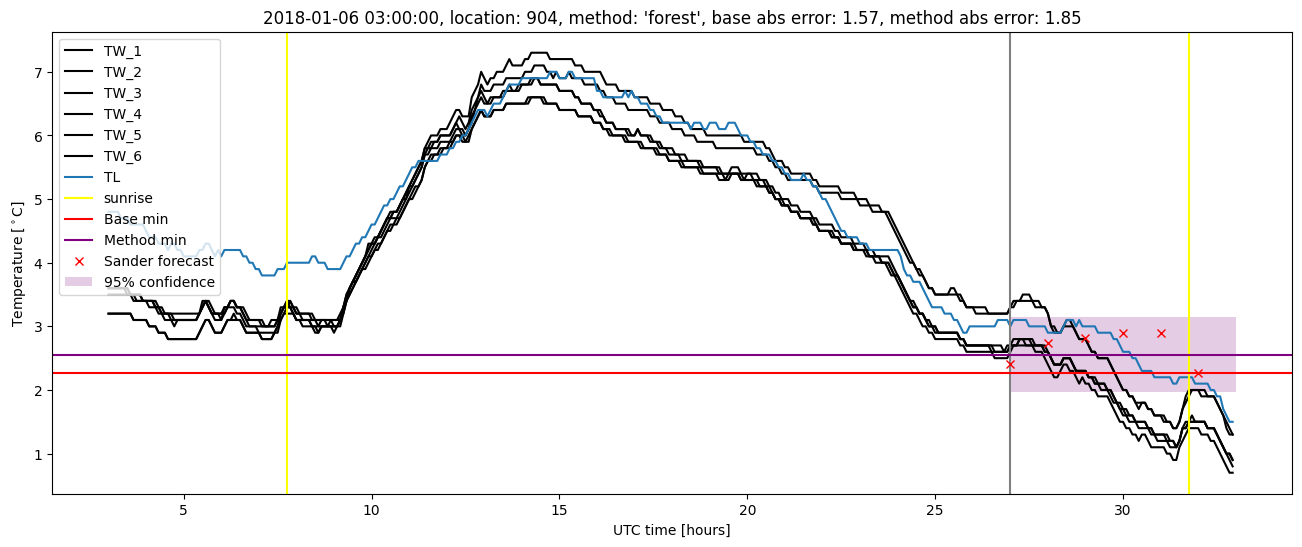
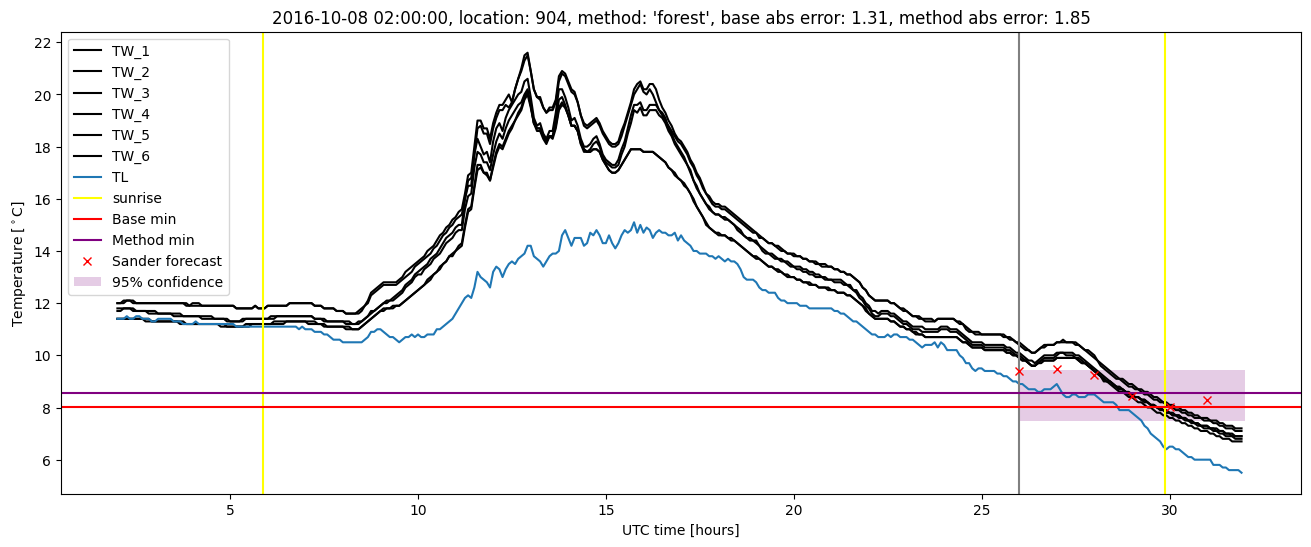
Random forest plots
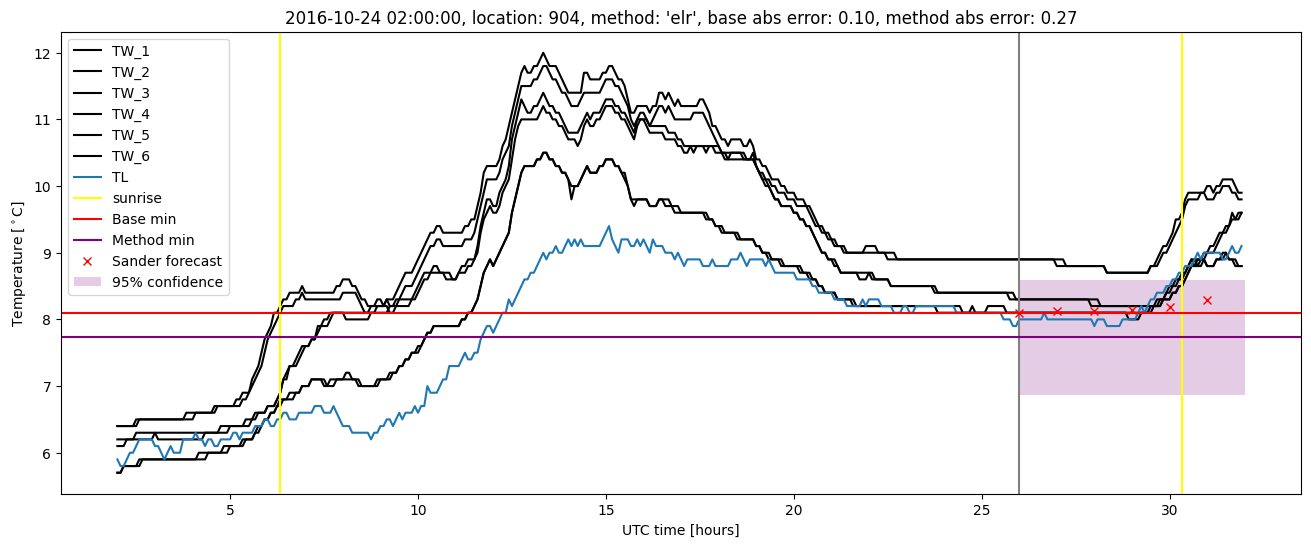
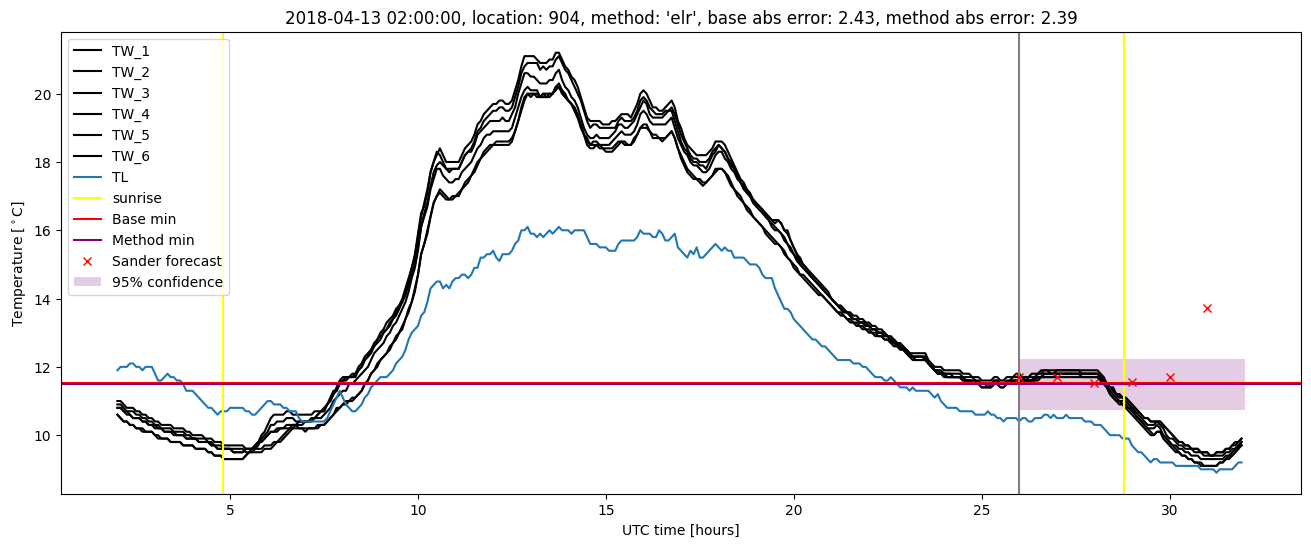
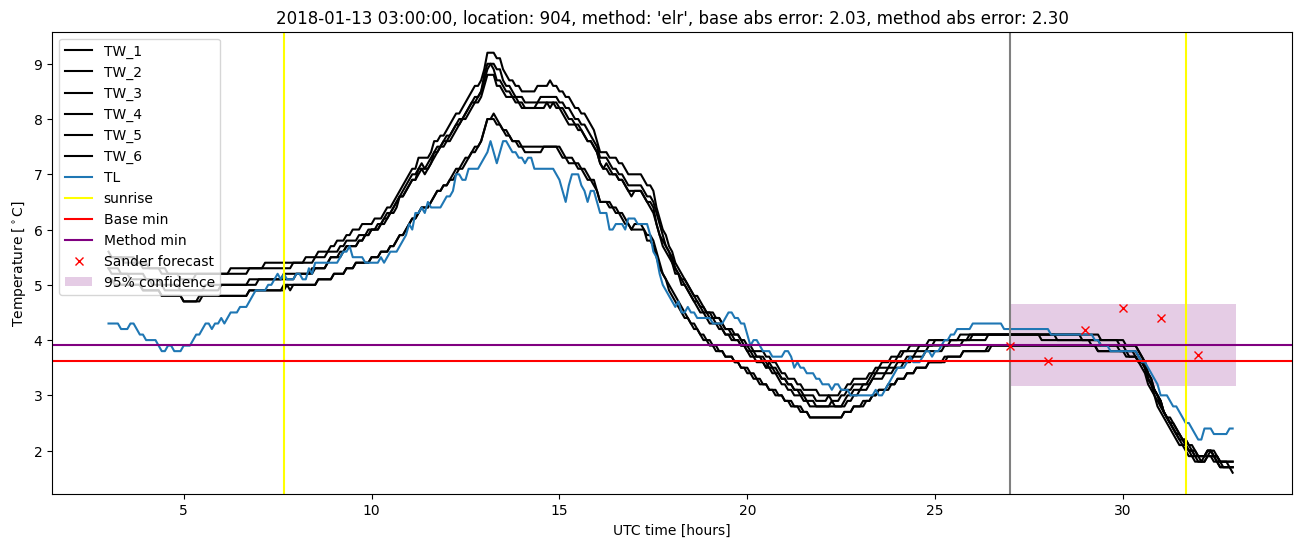
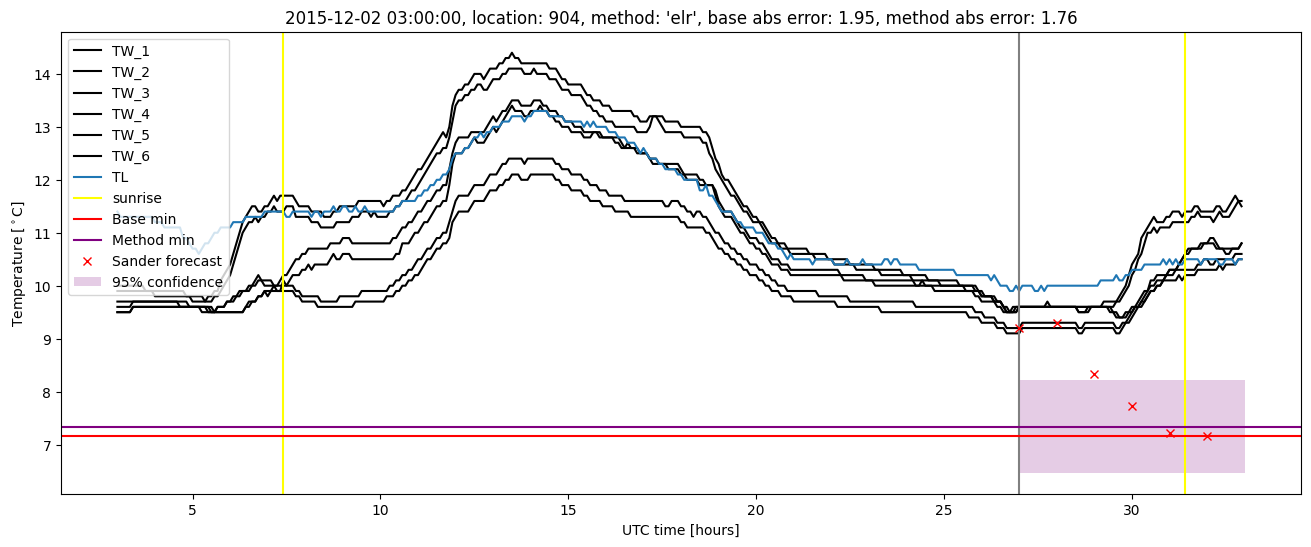
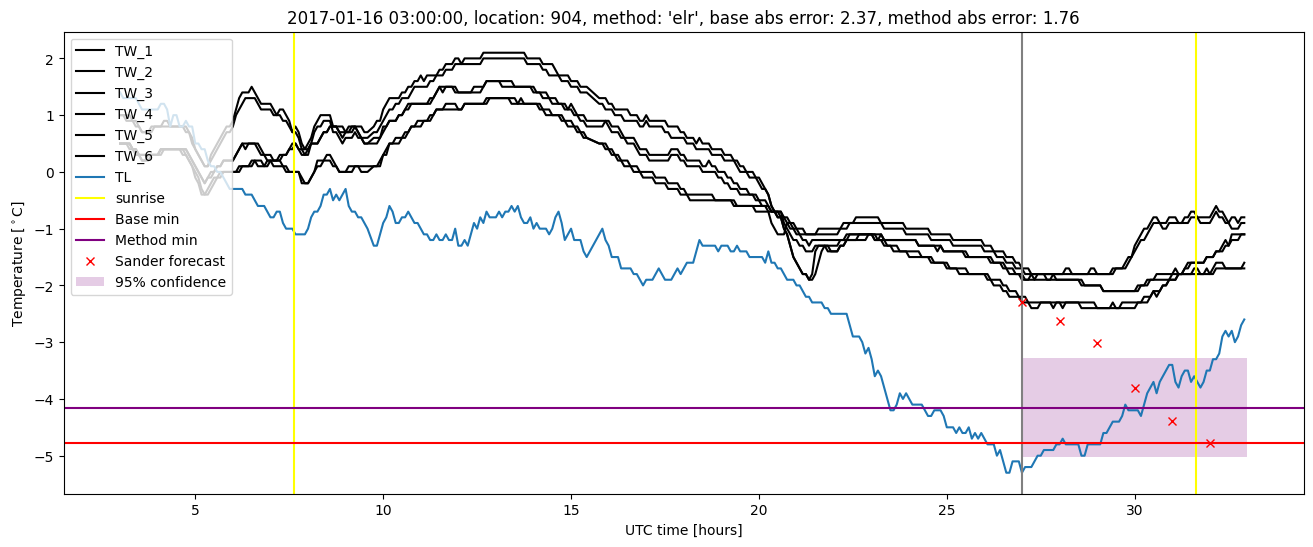
Extended logistic regression results
| names |
period |
power |
significance |
meanSquareError |
absError |
maxError |
CRPS |
IGN |
| baseline |
winter 2016 |
0.983 |
0.000e+00 |
0.364 |
0.470 |
1.947 |
NaN |
NaN |
| elr |
winter 2016 |
0.994 |
0.000e+00 |
0.261 |
0.393 |
1.761 |
0.485 |
3.577 |
| baseline |
winter 2017 |
0.966 |
0.069 |
0.375 |
0.464 |
2.372 |
NaN |
NaN |
| elr |
winter 2017 |
1.000 |
0.035 |
0.235 |
0.370 |
1.756 |
0.488 |
3.669 |
| baseline |
winter 2018 |
0.968 |
0.160 |
0.455 |
0.486 |
3.034 |
NaN |
NaN |
| elr |
winter 2018 |
0.975 |
0.160 |
0.417 |
0.449 |
3.345 |
0.506 |
6.611 |
| baseline |
winter 2019 |
0.991 |
0.000e+00 |
0.304 |
0.415 |
1.754 |
NaN |
NaN |
| elr |
winter 2019 |
0.991 |
0.143 |
0.201 |
0.337 |
1.581 |
0.481 |
3.889 |
| baseline |
all |
0.977 |
0.070 |
0.381 |
0.463 |
3.034 |
NaN |
NaN |
| elr |
all |
0.989 |
0.081 |
0.288 |
0.393 |
3.345 |
0.491 |
4.517 |
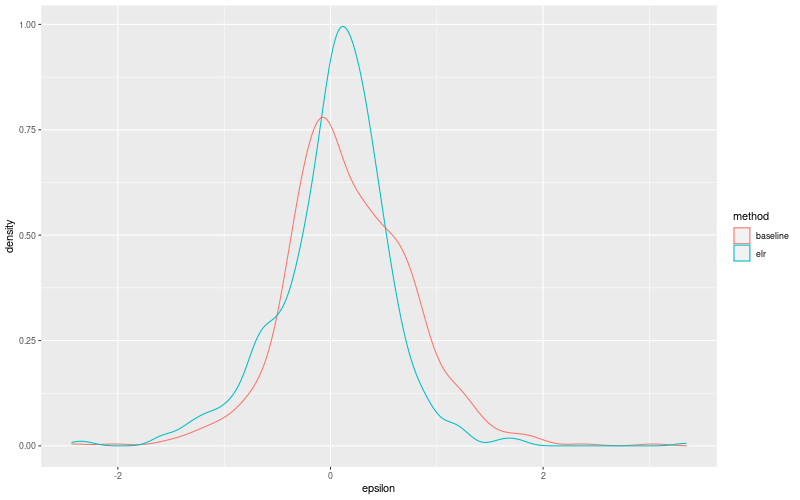
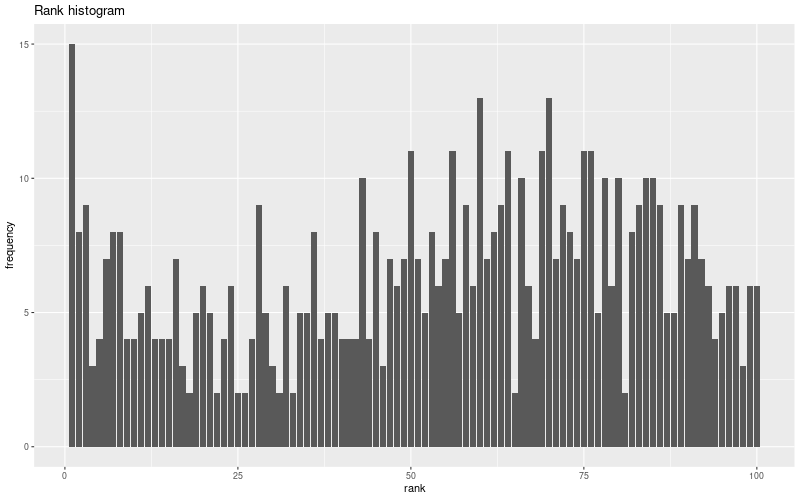
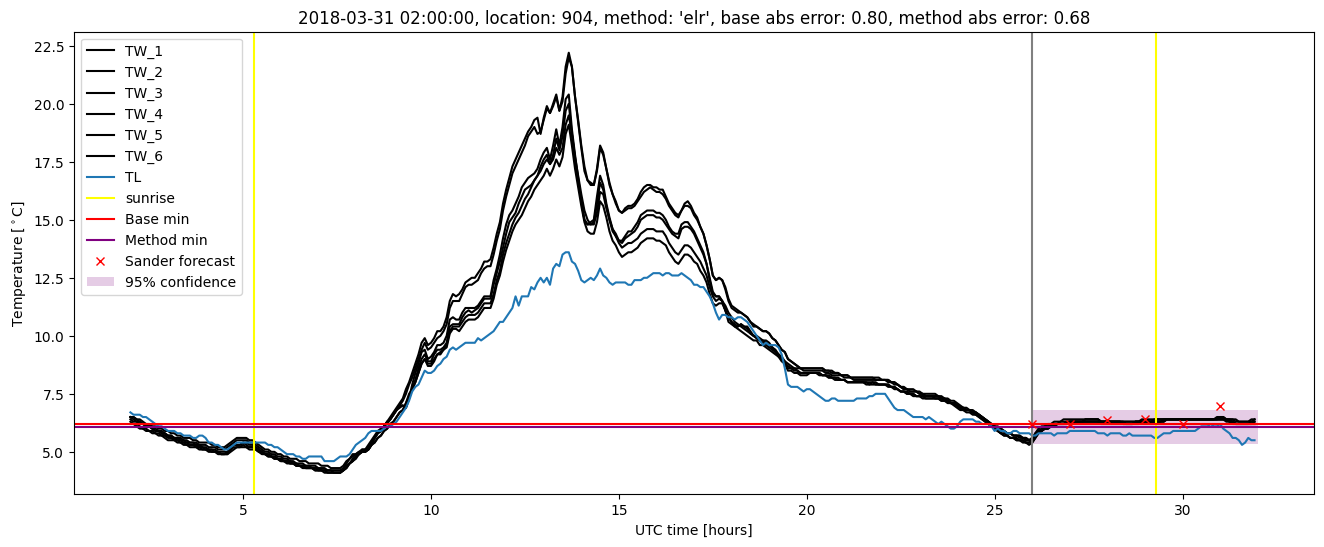
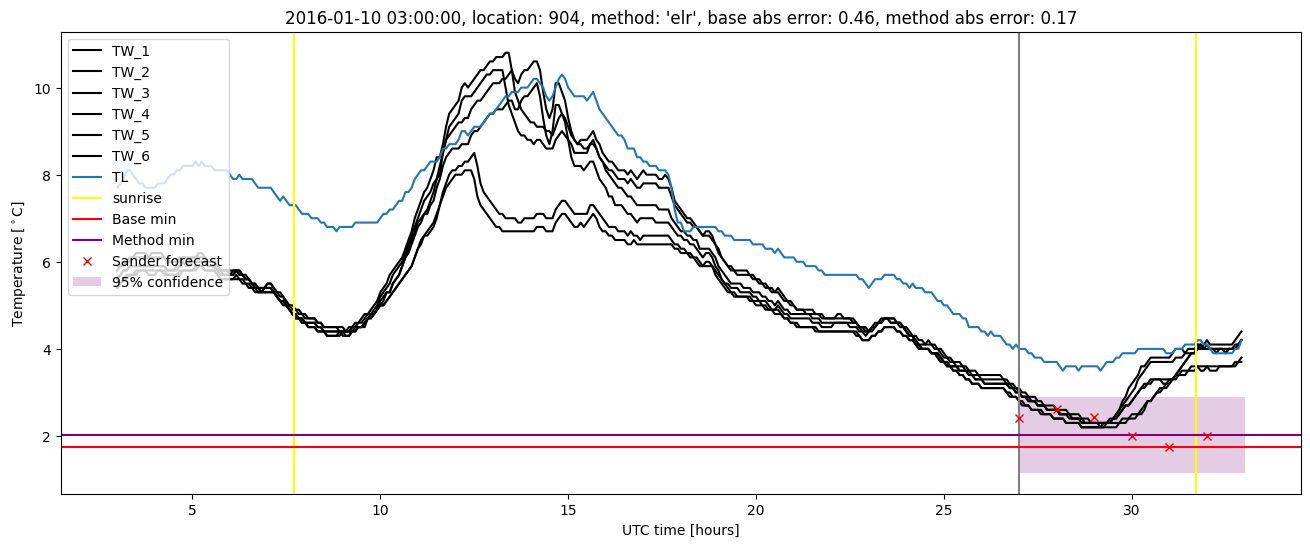
Extended logistic regression plots