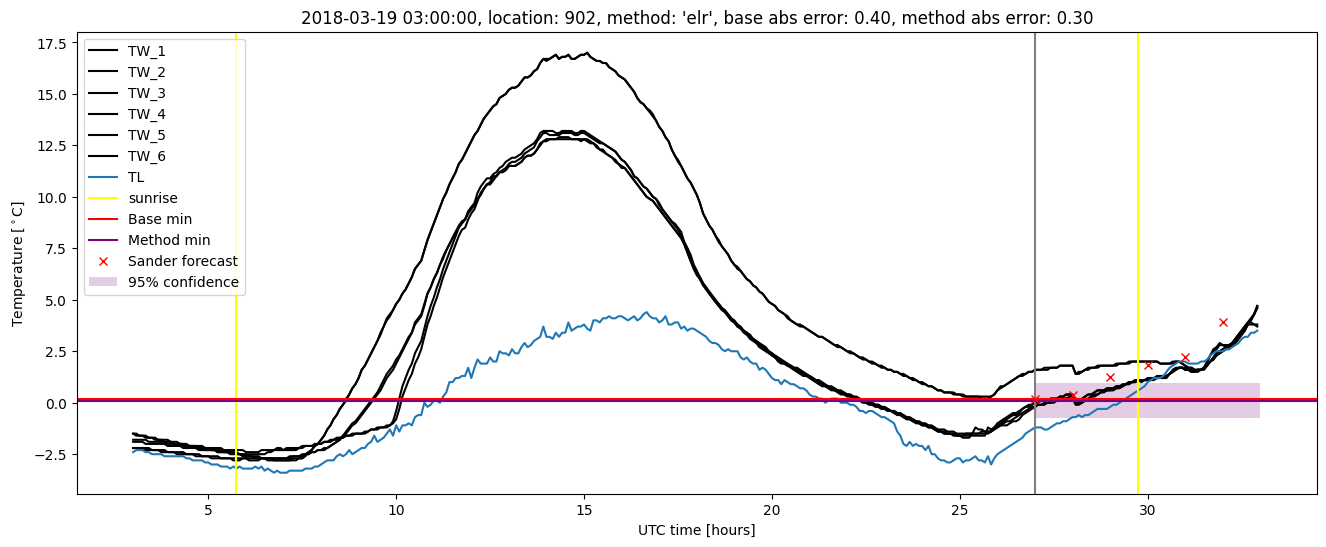
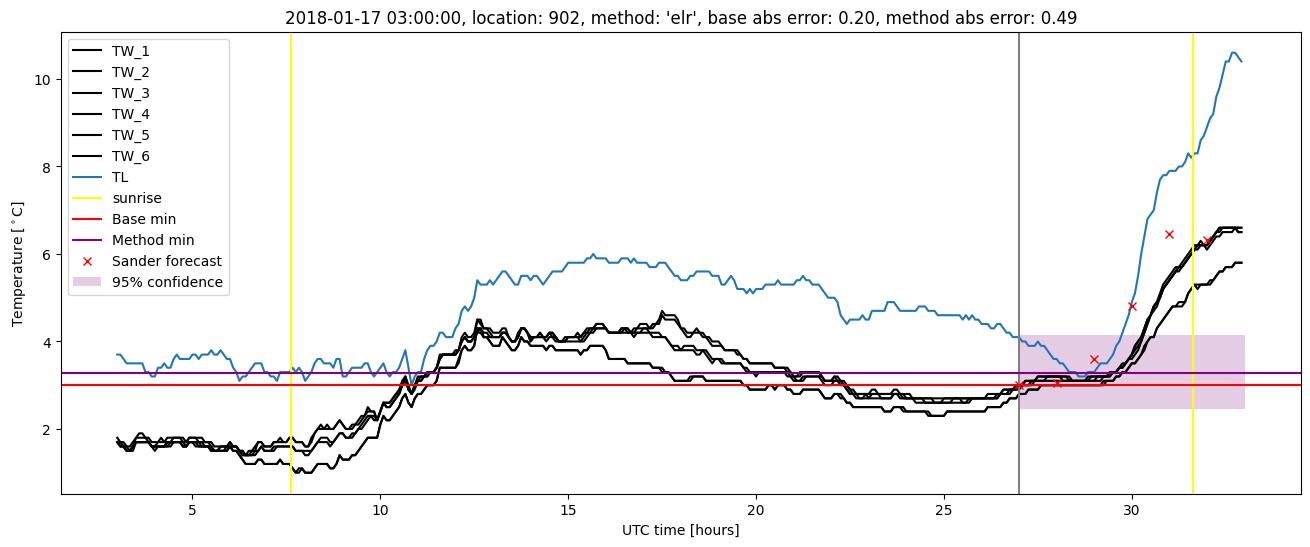
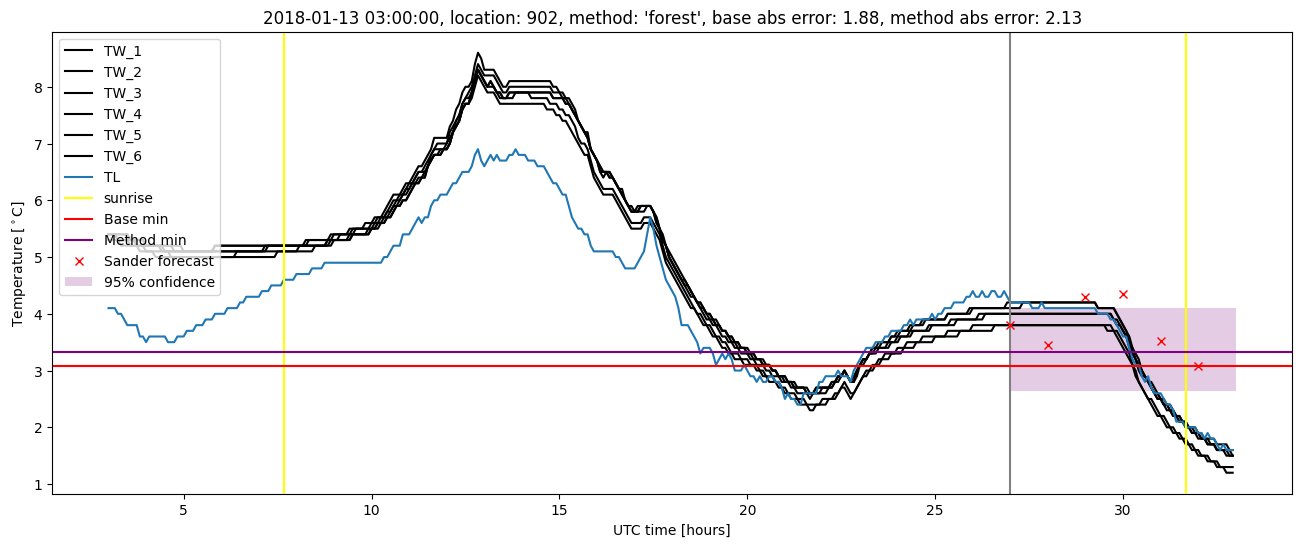
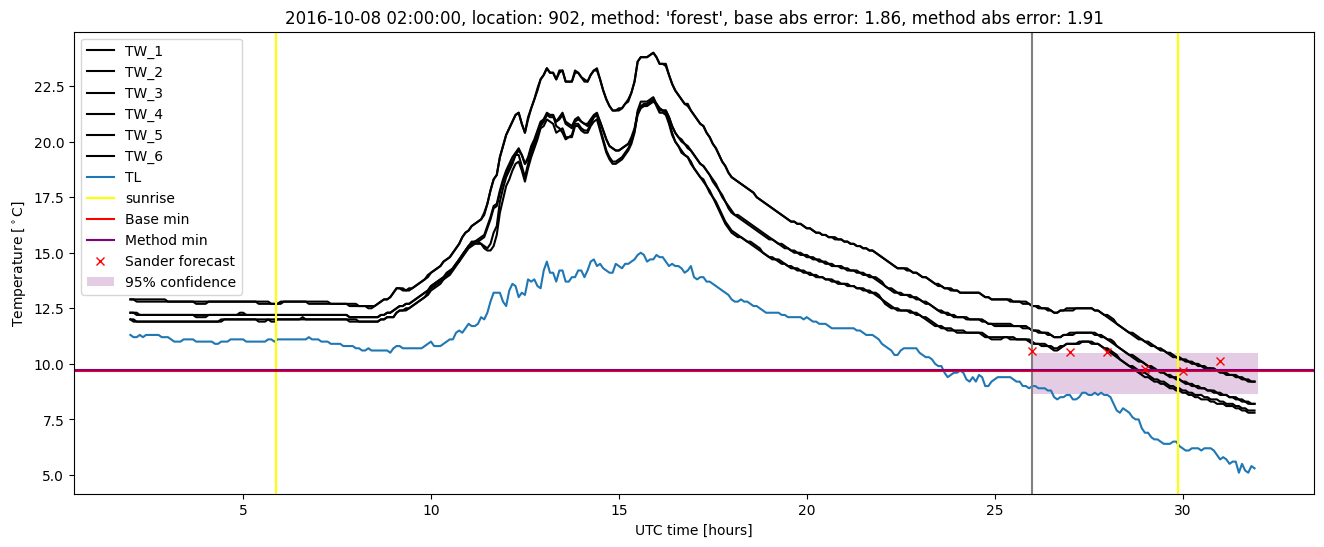
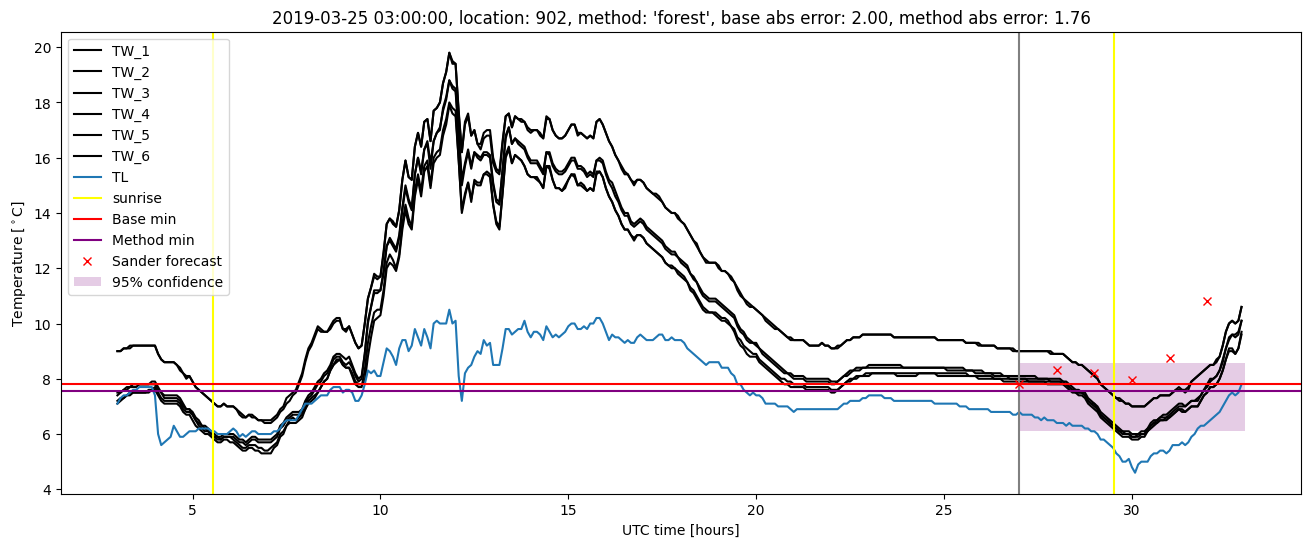
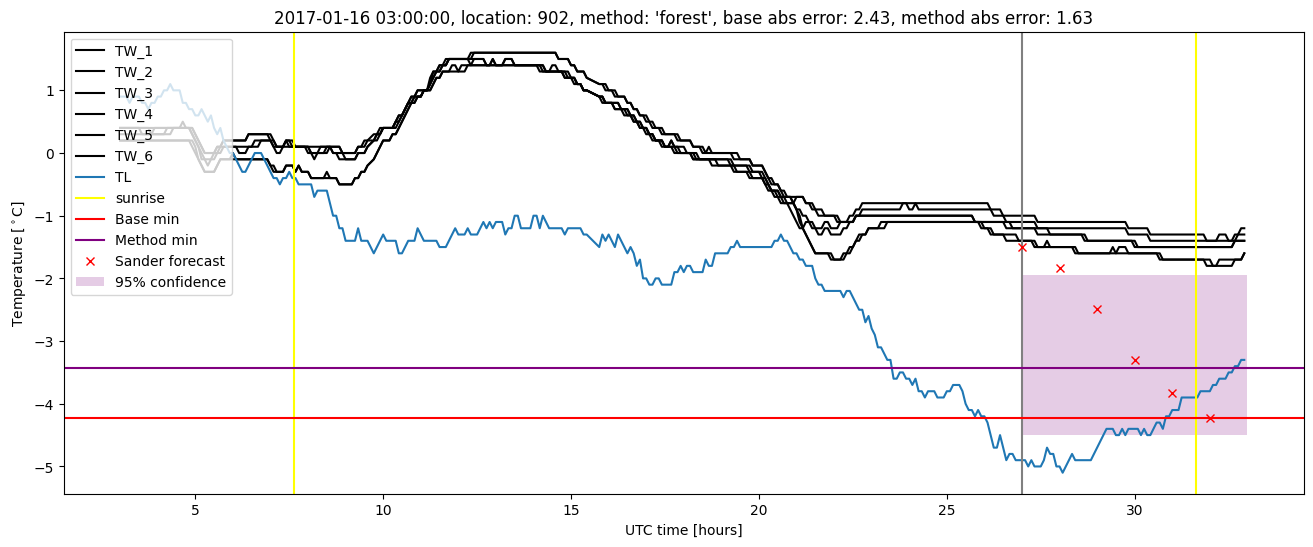
GMS location: 902
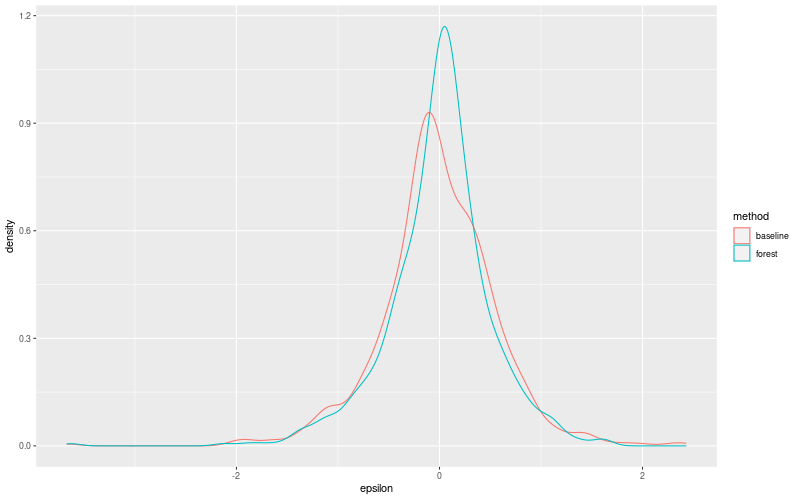
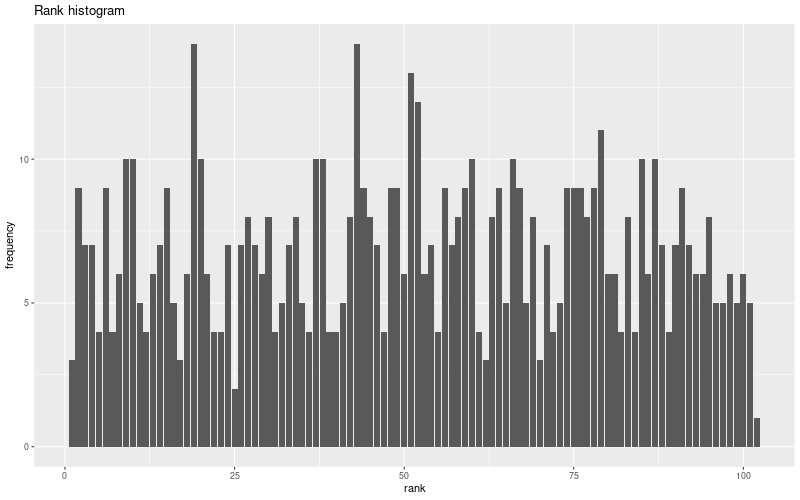
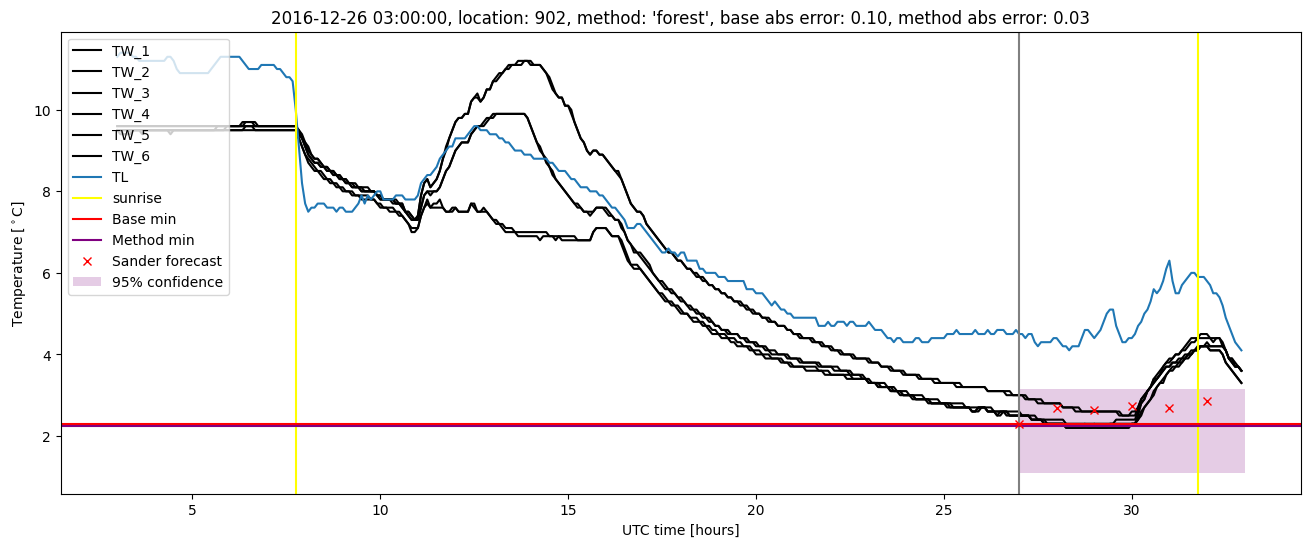
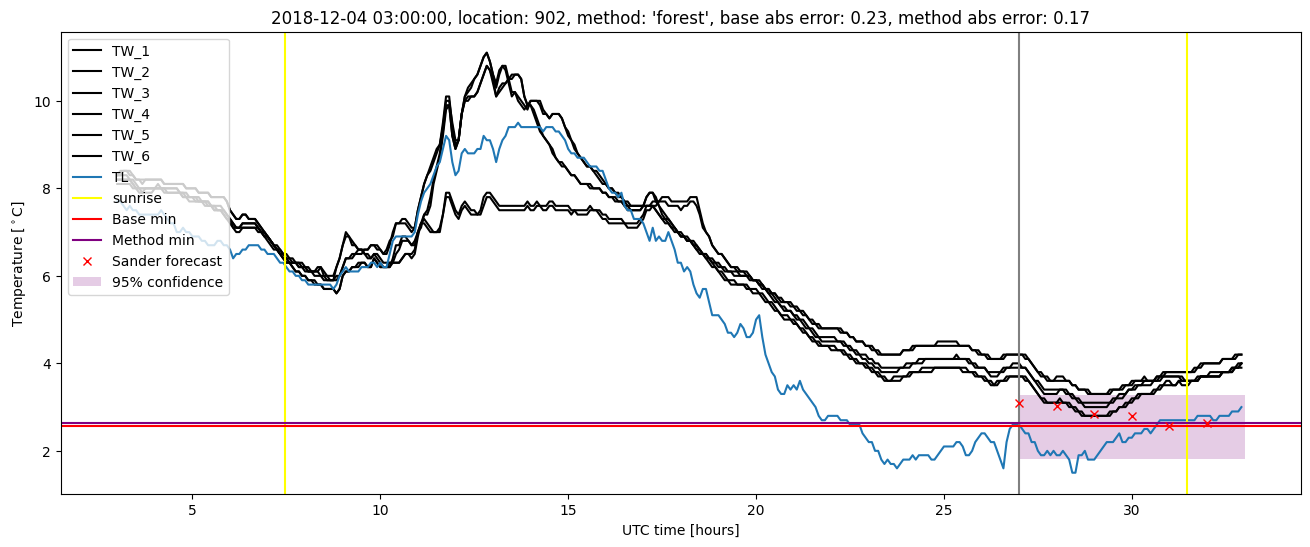
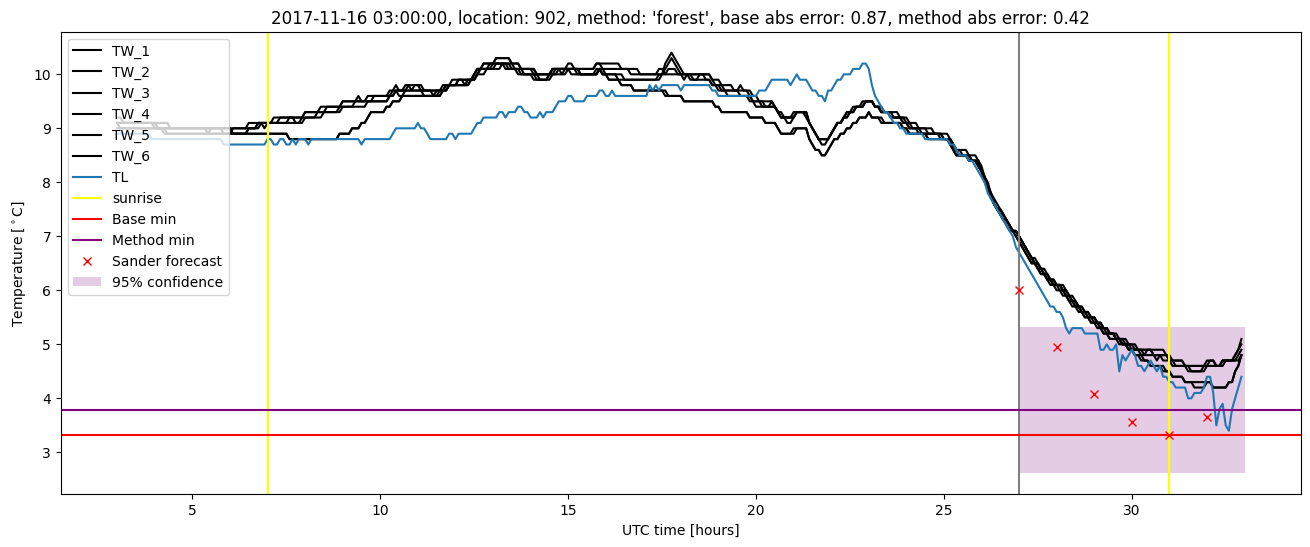
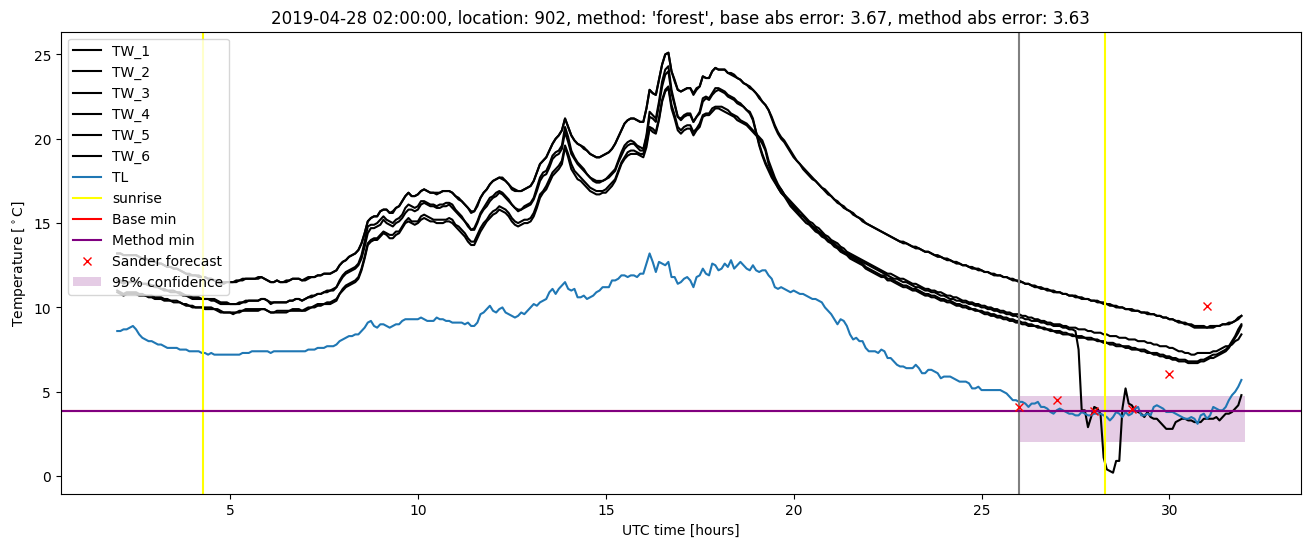
Random forest results
| names |
period |
power |
significance |
meanSquareError |
absError |
maxError |
CRPS |
IGN |
| baseline |
winter 2016 |
0.984 |
0.000e+00 |
0.275 |
0.402 |
1.682 |
NaN |
NaN |
| forest |
winter 2016 |
0.989 |
0.000e+00 |
0.221 |
0.352 |
1.446 |
0.502 |
5.814 |
| baseline |
winter 2017 |
0.958 |
0.091 |
0.335 |
0.424 |
2.427 |
NaN |
NaN |
| forest |
winter 2017 |
0.975 |
0.091 |
0.269 |
0.373 |
1.910 |
0.481 |
5.199 |
| baseline |
winter 2018 |
0.980 |
0.103 |
0.327 |
0.433 |
2.002 |
NaN |
NaN |
| forest |
winter 2018 |
0.993 |
0.103 |
0.279 |
0.382 |
2.130 |
0.496 |
4.919 |
| baseline |
winter 2019 |
0.974 |
0.071 |
0.389 |
0.408 |
3.668 |
NaN |
NaN |
| forest |
winter 2019 |
0.987 |
0.071 |
0.294 |
0.346 |
3.631 |
0.487 |
4.504 |
| baseline |
all |
0.975 |
0.077 |
0.328 |
0.416 |
3.668 |
NaN |
NaN |
| forest |
all |
0.987 |
0.077 |
0.264 |
0.362 |
3.631 |
0.492 |
5.141 |
Random forest plots
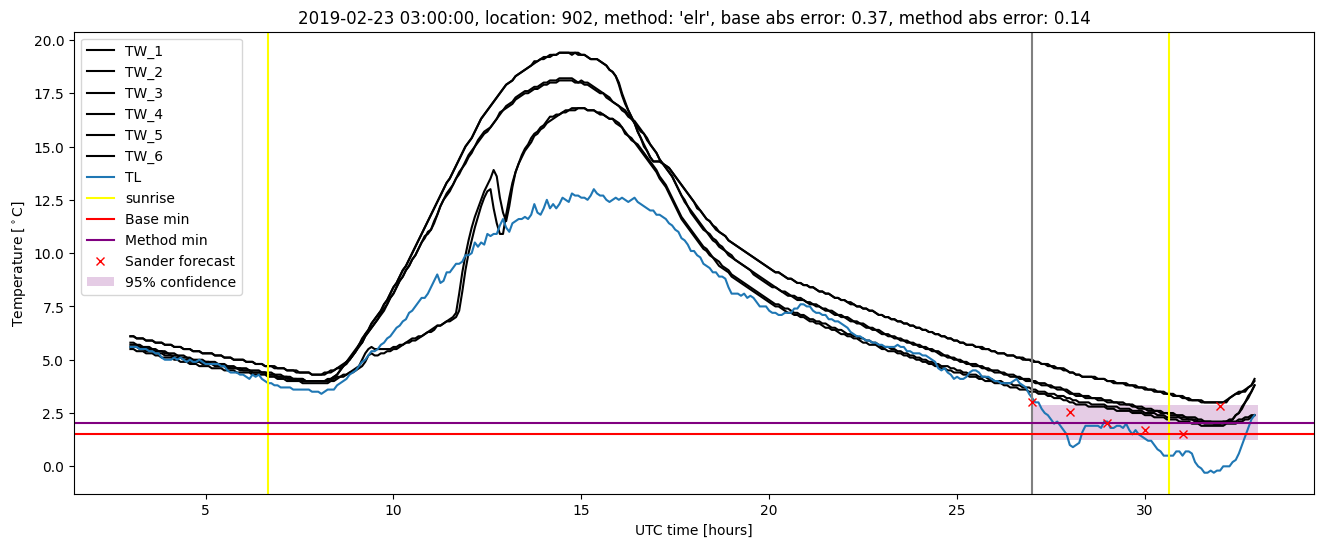
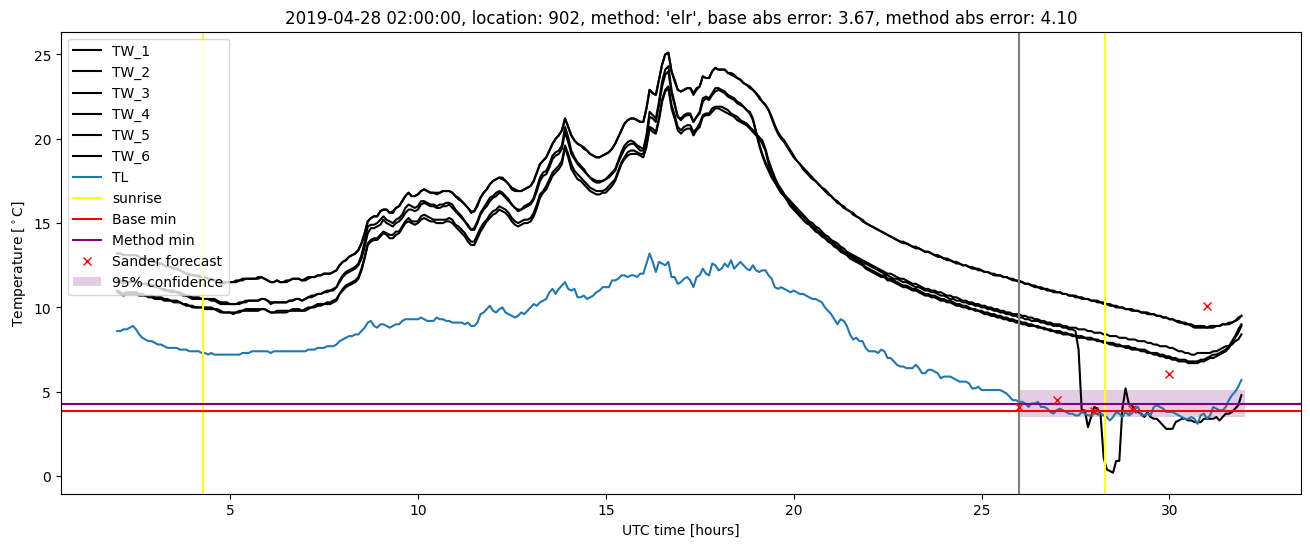
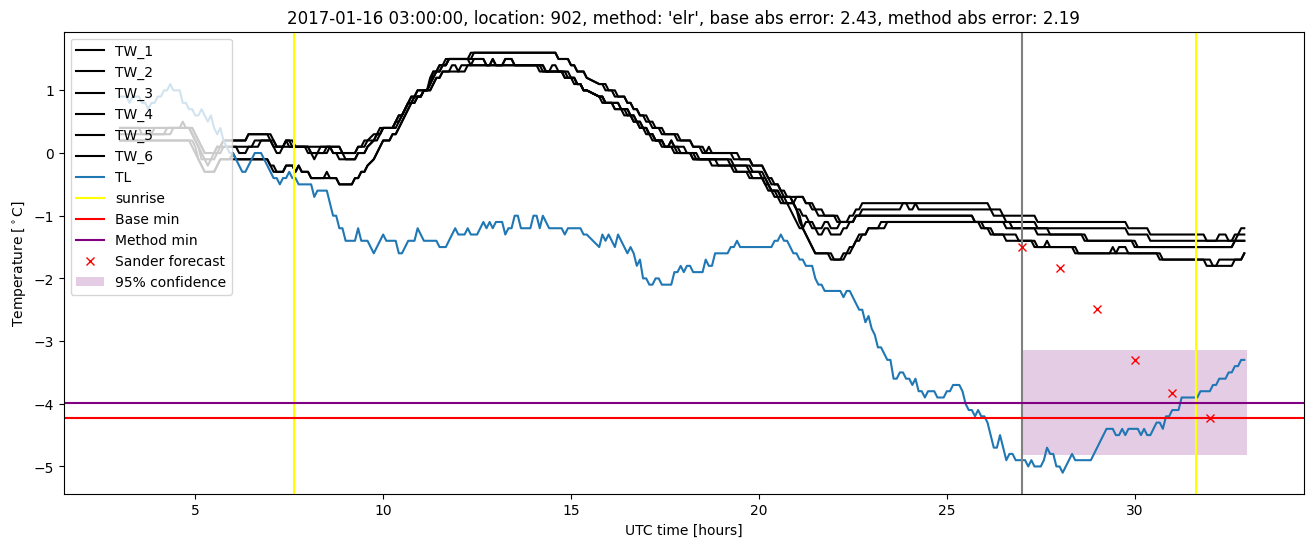
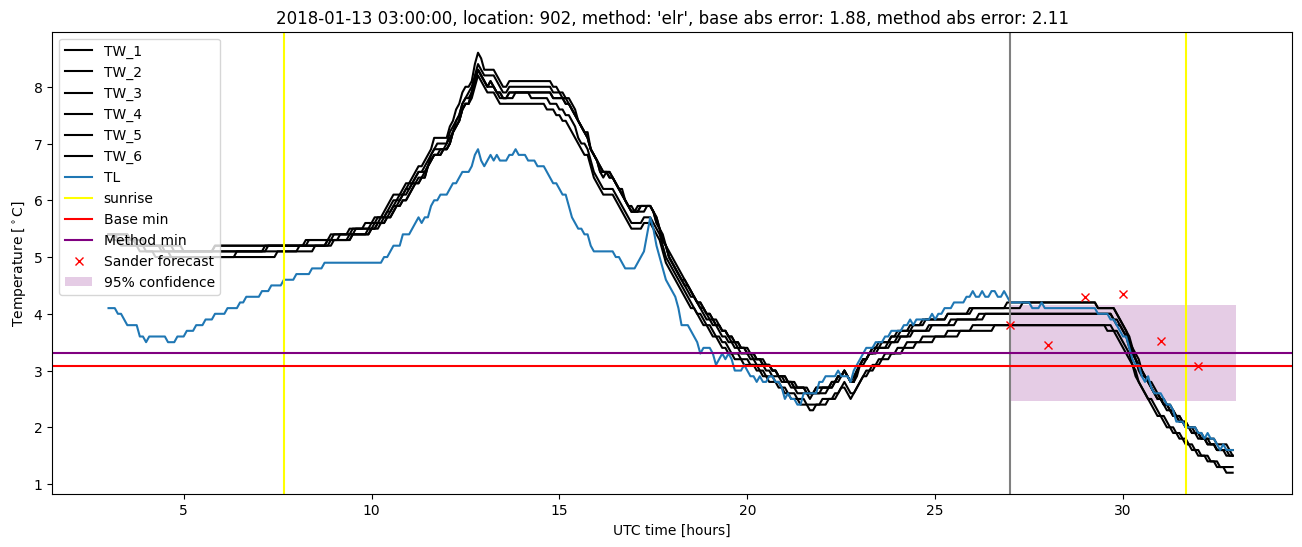
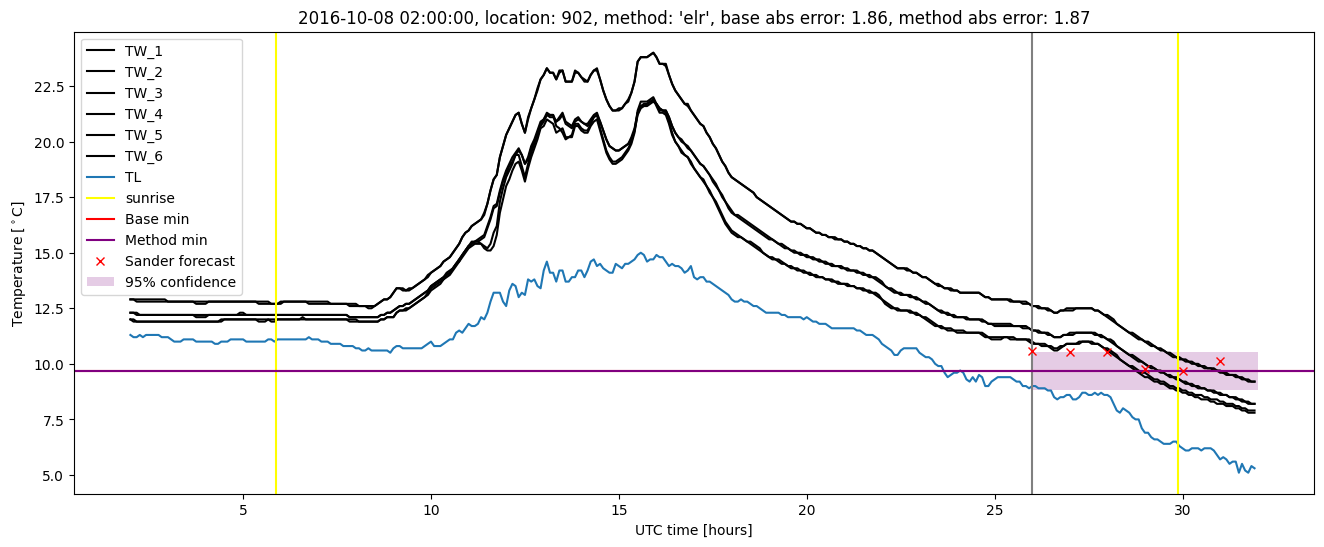
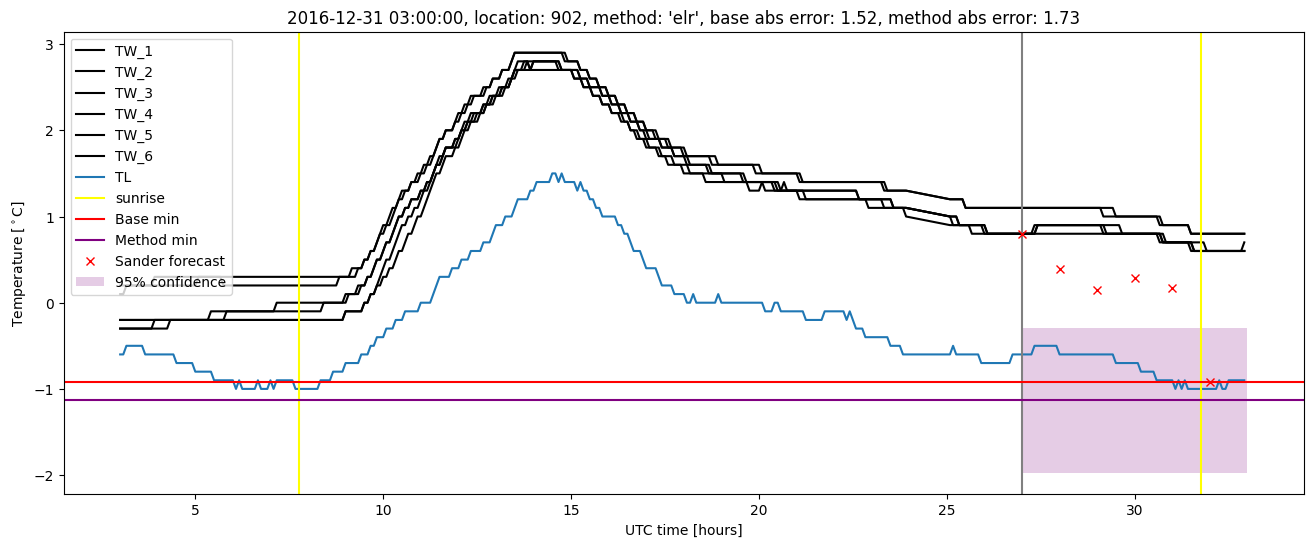
Extended logistic regression results
| names |
period |
power |
significance |
meanSquareError |
absError |
maxError |
CRPS |
IGN |
| baseline |
winter 2016 |
0.984 |
0.000e+00 |
0.275 |
0.402 |
1.682 |
NaN |
NaN |
| elr |
winter 2016 |
0.979 |
0.000e+00 |
0.261 |
0.392 |
1.370 |
0.581 |
5.663 |
| baseline |
winter 2017 |
0.958 |
0.091 |
0.335 |
0.424 |
2.427 |
NaN |
NaN |
| elr |
winter 2017 |
0.983 |
0.121 |
0.282 |
0.384 |
2.186 |
0.531 |
4.898 |
| baseline |
winter 2018 |
0.980 |
0.103 |
0.327 |
0.433 |
2.002 |
NaN |
NaN |
| elr |
winter 2018 |
0.993 |
0.138 |
0.291 |
0.398 |
2.115 |
0.560 |
5.202 |
| baseline |
winter 2019 |
0.974 |
0.071 |
0.389 |
0.408 |
3.668 |
NaN |
NaN |
| elr |
winter 2019 |
0.987 |
0.071 |
0.344 |
0.395 |
4.096 |
0.550 |
5.702 |
| baseline |
all |
0.975 |
0.077 |
0.328 |
0.416 |
3.668 |
NaN |
NaN |
| elr |
all |
0.985 |
0.099 |
0.293 |
0.392 |
4.096 |
0.557 |
5.389 |
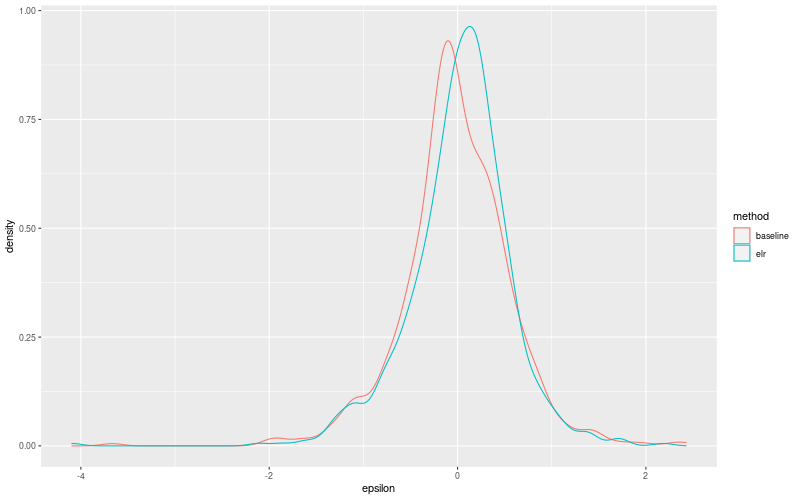
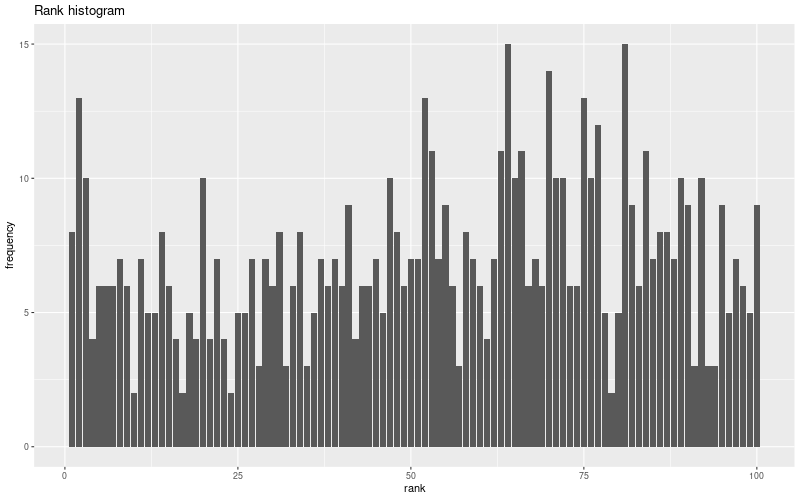
Extended logistic regression plots