GMS location: 901
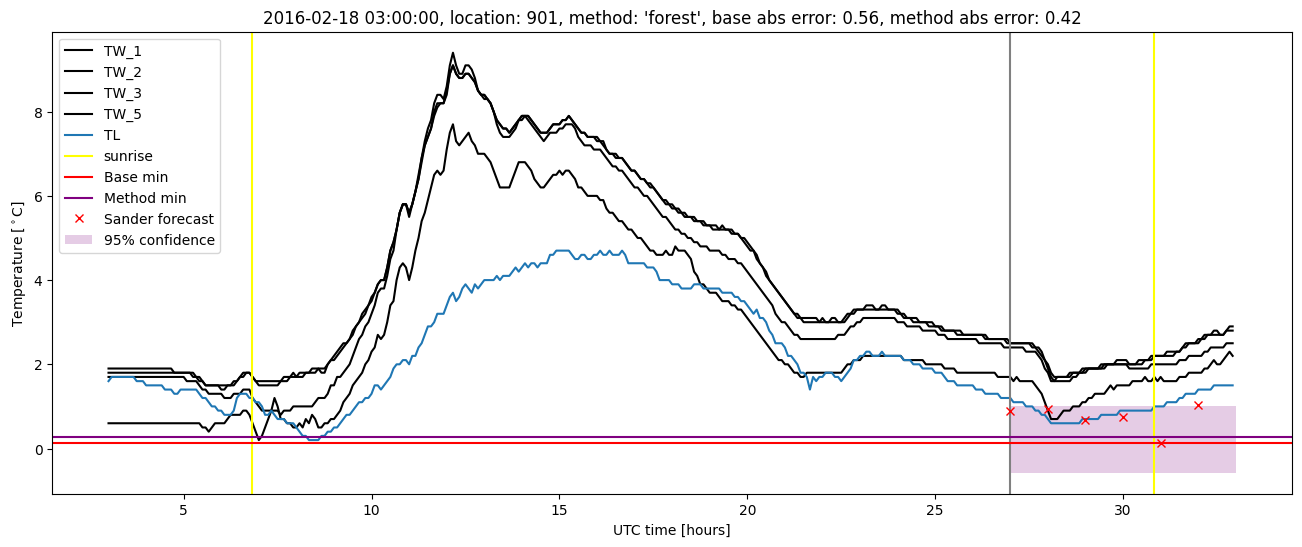
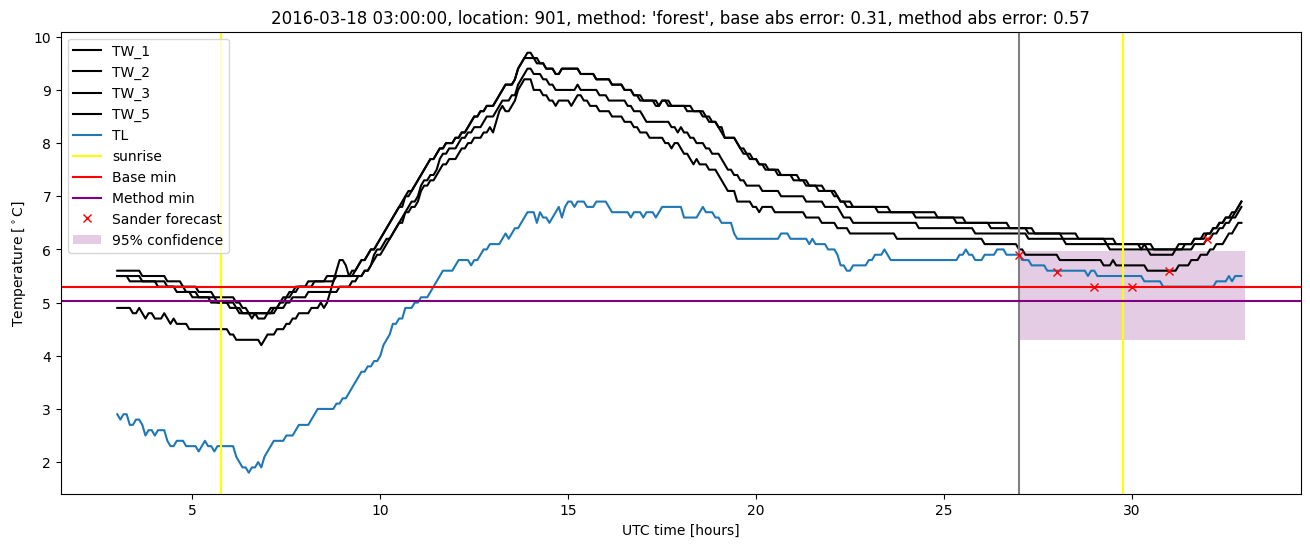
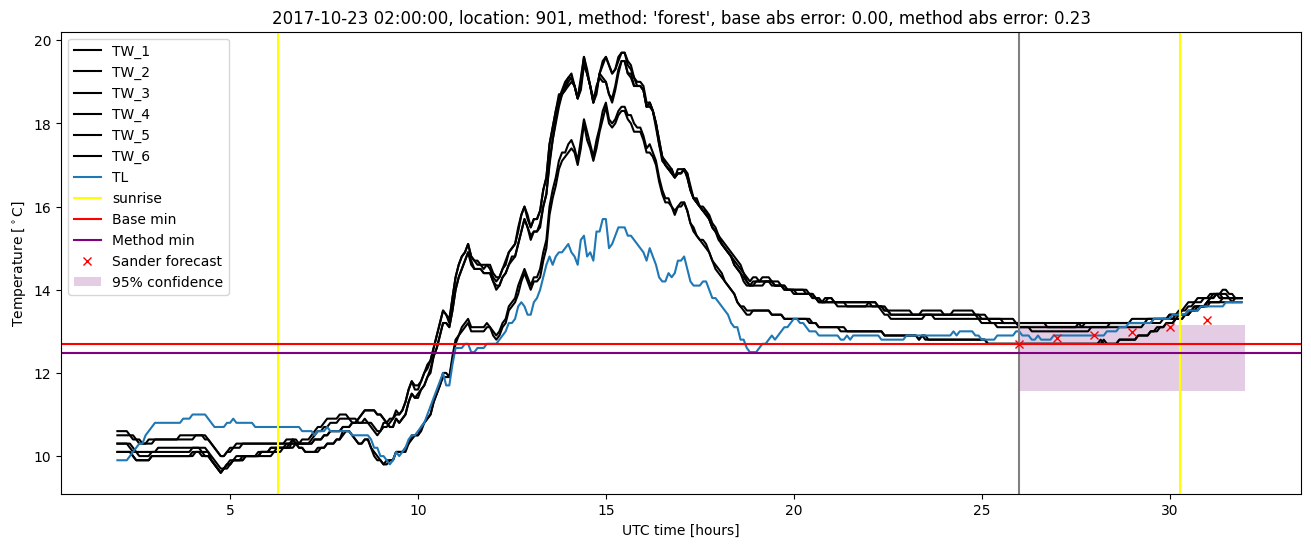
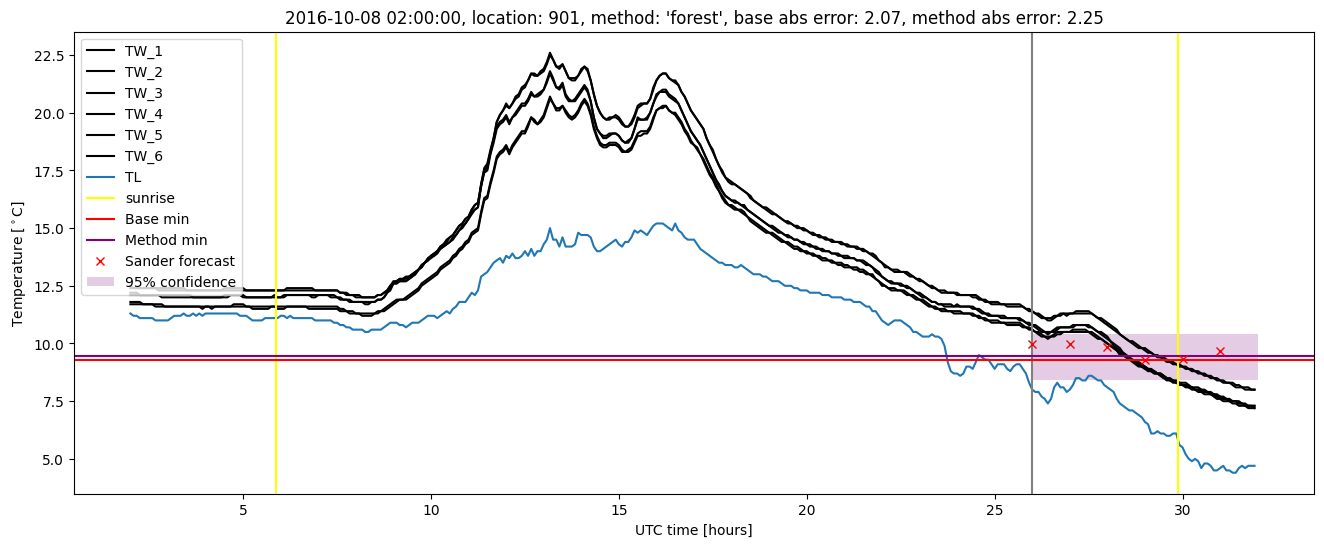
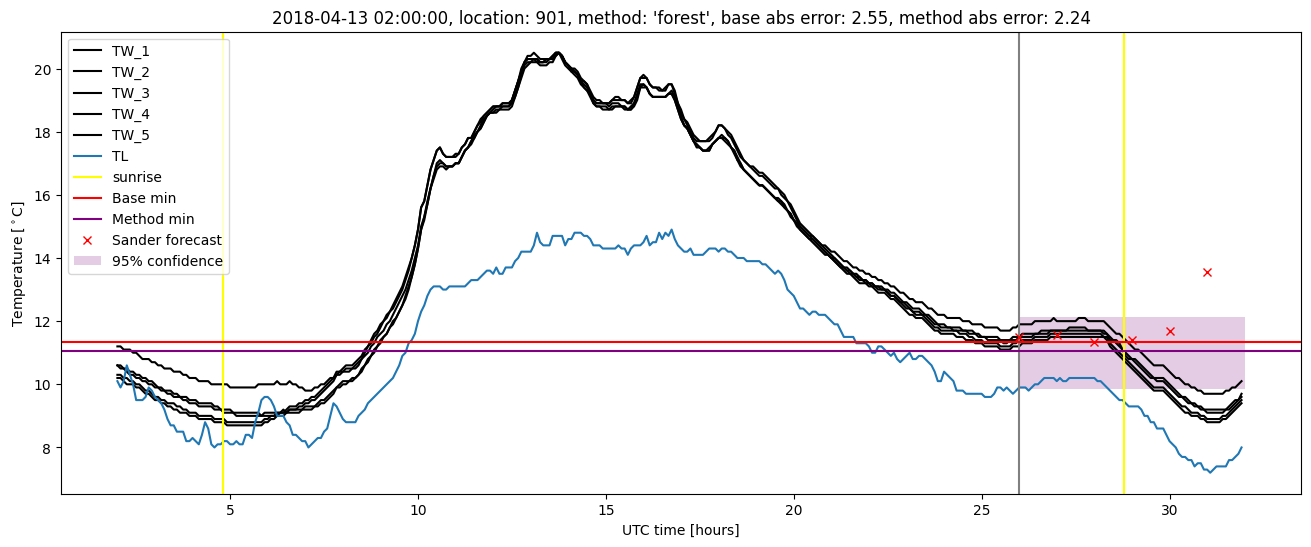
Random forest results
| names |
period |
power |
significance |
meanSquareError |
absError |
maxError |
CRPS |
IGN |
| baseline |
winter 2016 |
0.973 |
0.053 |
0.332 |
0.443 |
1.712 |
NaN |
NaN |
| forest |
winter 2016 |
0.978 |
0.105 |
0.234 |
0.370 |
1.752 |
0.464 |
5.218 |
| baseline |
winter 2017 |
0.950 |
0.121 |
0.369 |
0.441 |
2.654 |
NaN |
NaN |
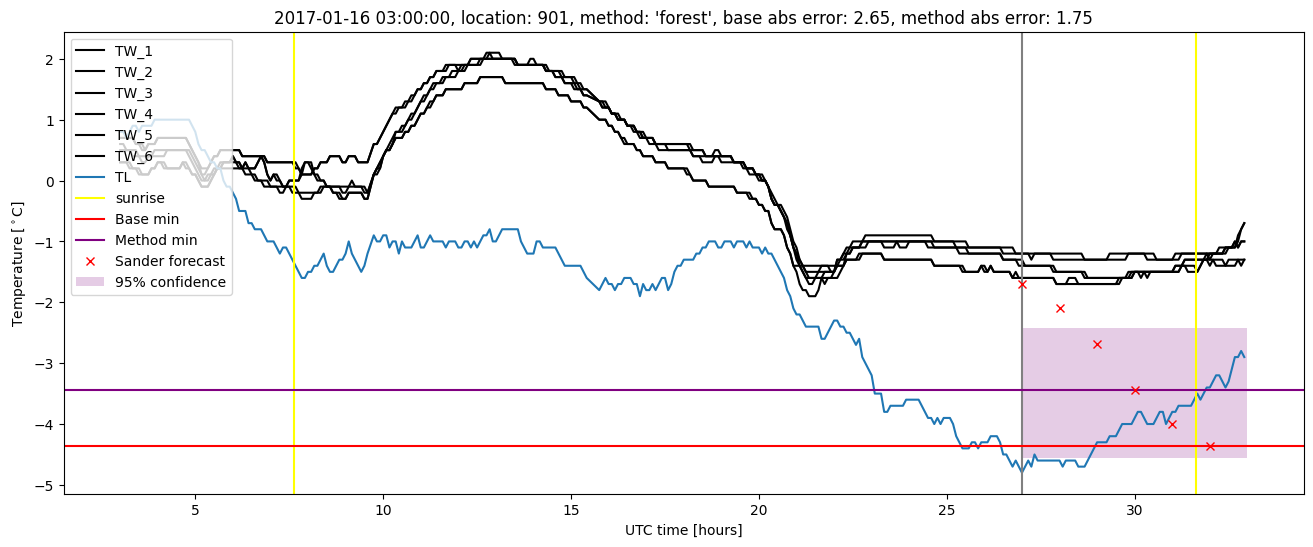
| forest |
winter 2017 |
0.950 |
0.151 |
0.254 |
0.368 |
2.253 |
0.467 |
3.988 |
| baseline |
winter 2018 |
0.973 |
0.103 |
0.315 |
0.419 |
2.553 |
NaN |
NaN |
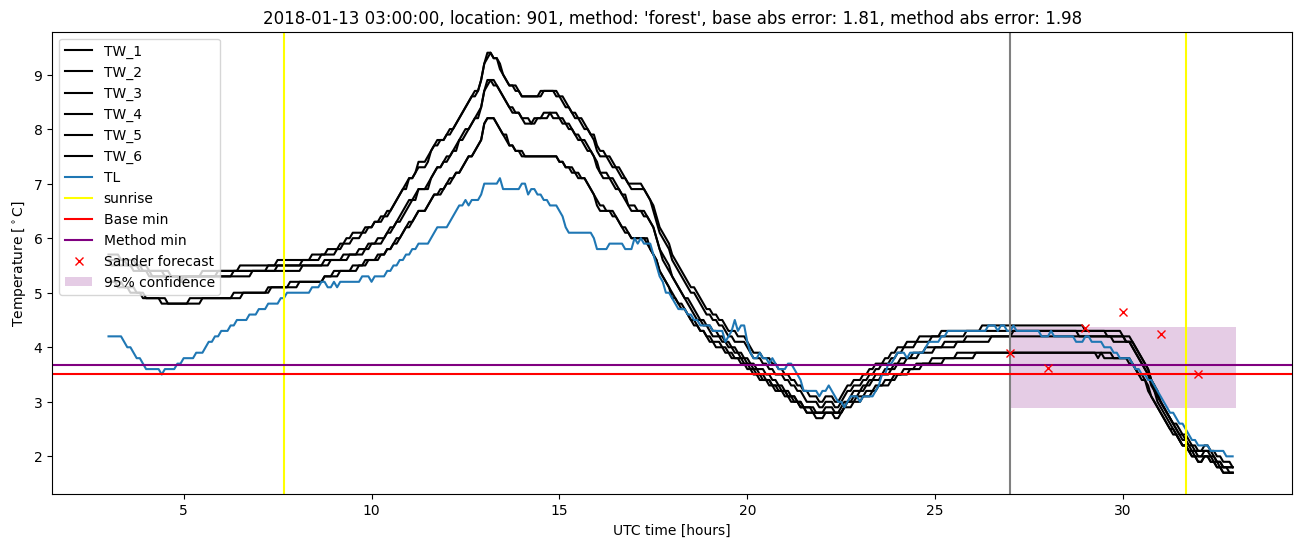
| forest |
winter 2018 |
0.973 |
0.172 |
0.259 |
0.377 |
2.243 |
0.472 |
4.041 |
| baseline |
winter 2019 |
0.987 |
0.077 |
0.324 |
0.432 |
1.939 |
NaN |
NaN |
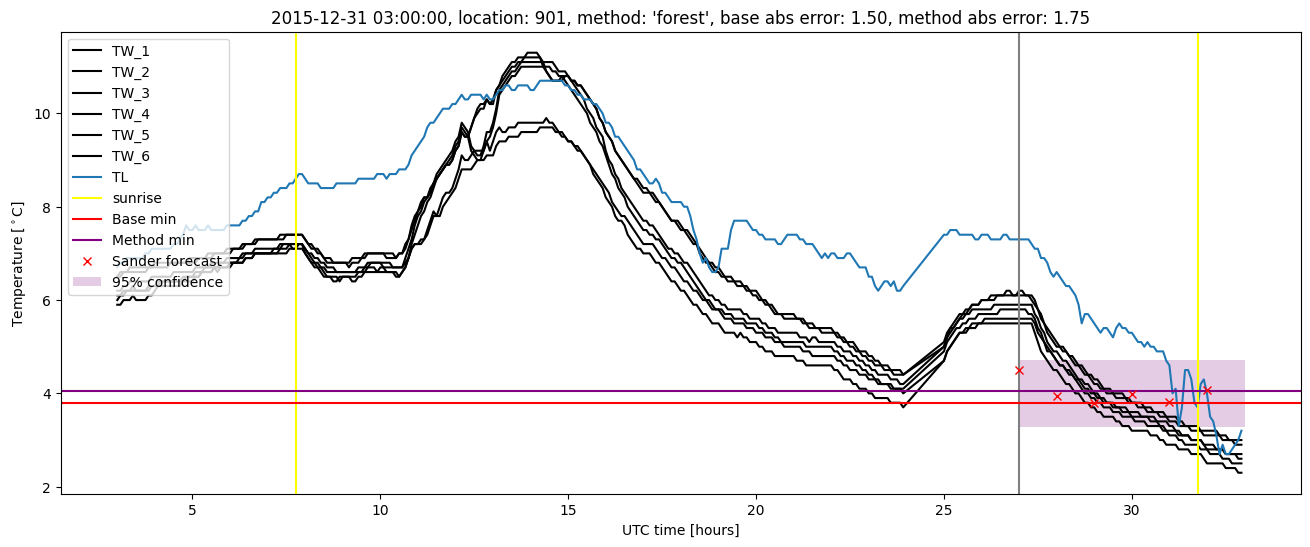
| forest |
winter 2019 |
0.993 |
0.154 |
0.208 |
0.343 |
1.521 |
0.465 |
4.069 |
| baseline |
all |
0.972 |
0.096 |
0.334 |
0.434 |
2.654 |
NaN |
NaN |
| forest |
all |
0.975 |
0.149 |
0.239 |
0.365 |
2.253 |
0.467 |
4.377 |
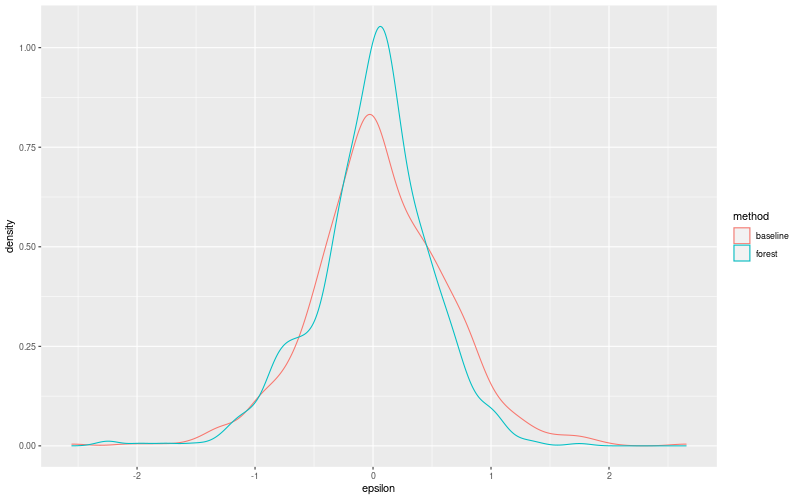
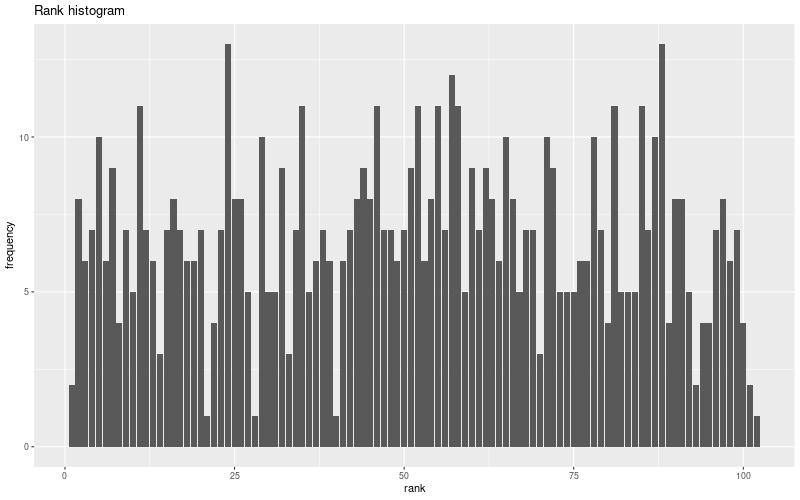
Random forest plots
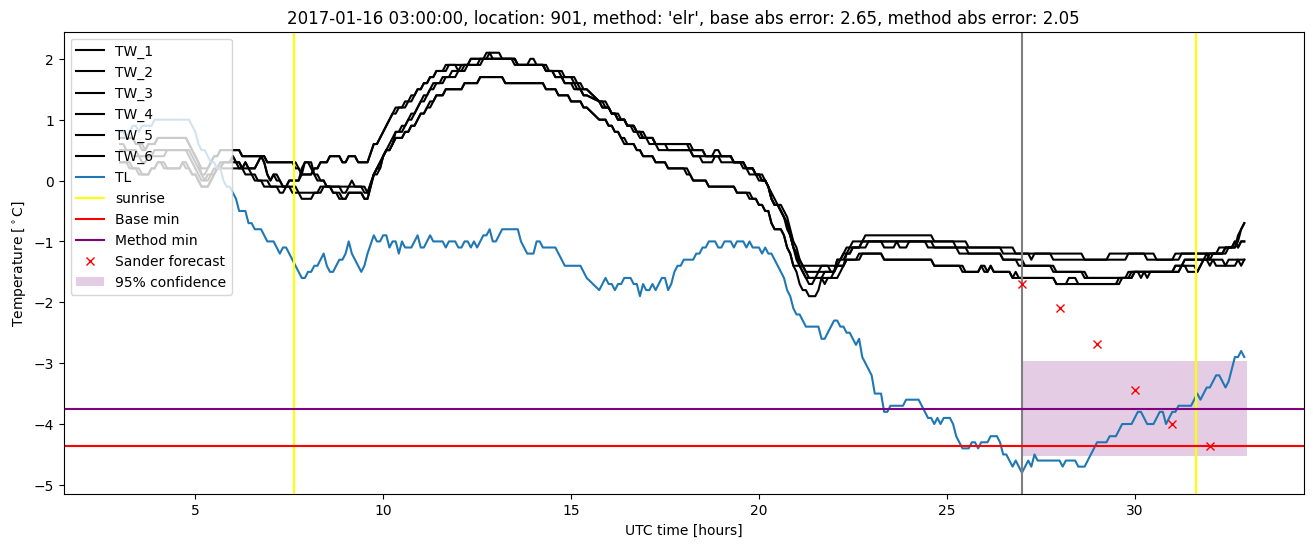
Extended logistic regression results
| names |
period |
power |
significance |
meanSquareError |
absError |
maxError |
CRPS |
IGN |
| baseline |
winter 2016 |
0.973 |
0.053 |
0.332 |
0.443 |
1.712 |
NaN |
NaN |
| elr |
winter 2016 |
0.973 |
0.105 |
0.265 |
0.402 |
1.902 |
0.558 |
7.440 |
| baseline |
winter 2017 |
0.950 |
0.121 |
0.369 |
0.441 |
2.654 |
NaN |
NaN |
| elr |
winter 2017 |
0.967 |
0.121 |
0.249 |
0.365 |
2.110 |
0.526 |
6.113 |
| baseline |
winter 2018 |
0.973 |
0.103 |
0.315 |
0.419 |
2.553 |
NaN |
NaN |
| elr |
winter 2018 |
0.980 |
0.207 |
0.305 |
0.428 |
2.183 |
0.553 |
7.743 |
| baseline |
winter 2019 |
0.987 |
0.077 |
0.324 |
0.432 |
1.939 |
NaN |
NaN |
| elr |
winter 2019 |
0.993 |
0.154 |
0.212 |
0.356 |
1.329 |
0.505 |
5.516 |
| baseline |
all |
0.972 |
0.096 |
0.334 |
0.434 |
2.654 |
NaN |
NaN |
| elr |
all |
0.978 |
0.149 |
0.260 |
0.390 |
2.183 |
0.537 |
6.778 |
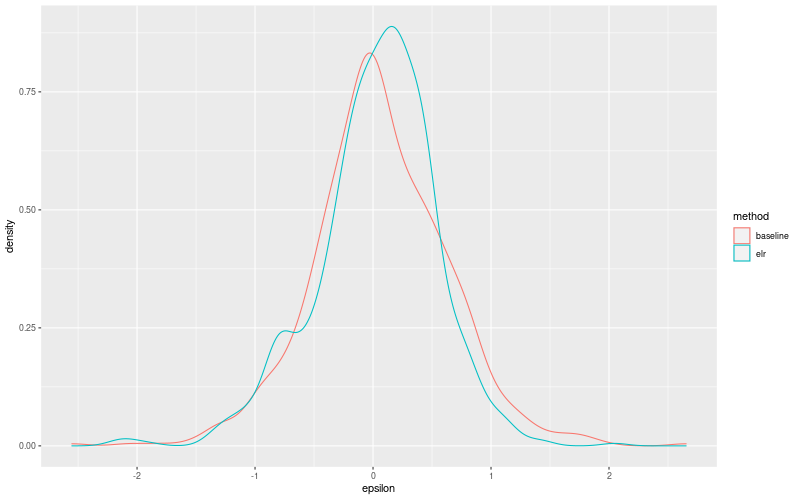
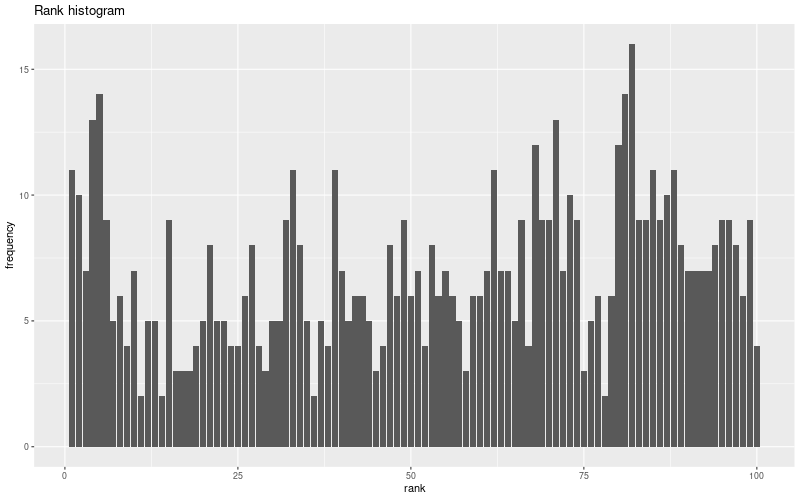
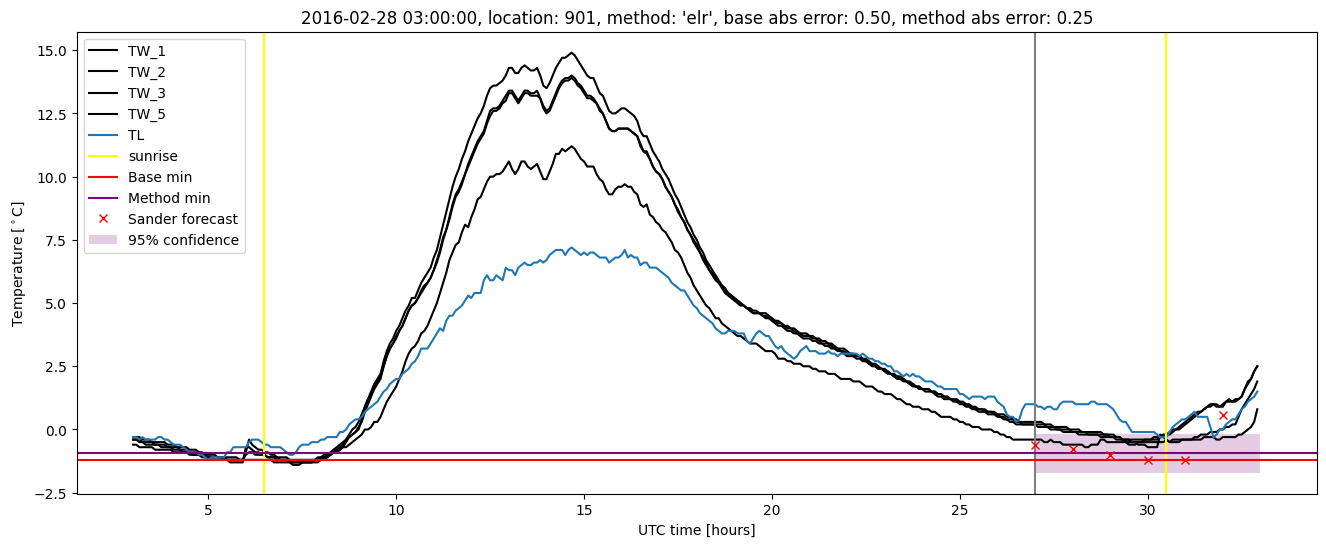
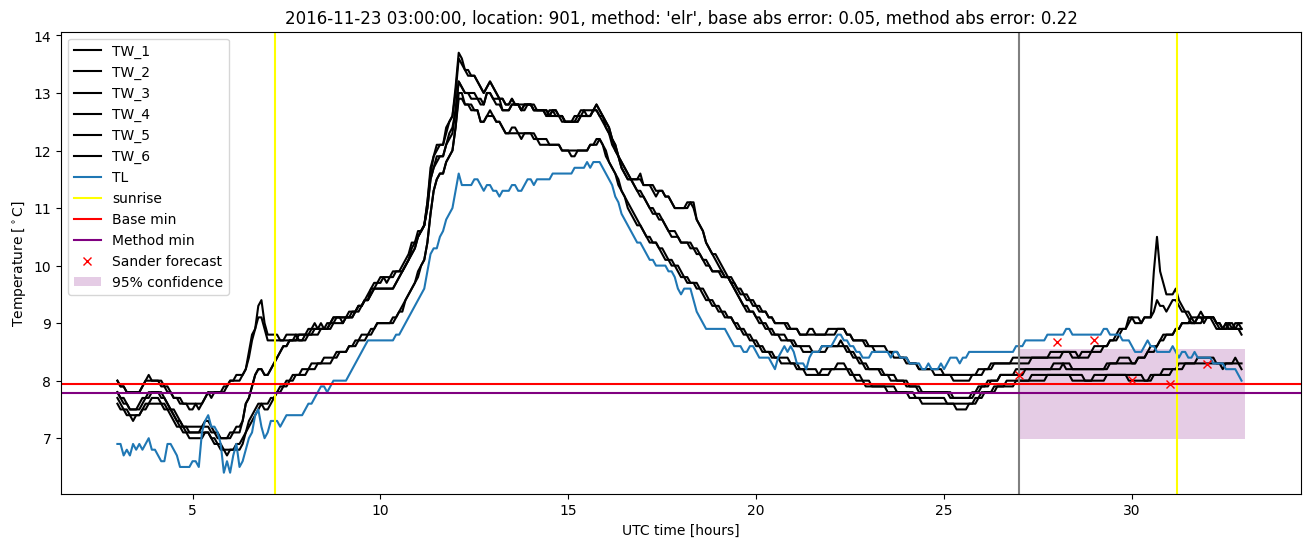
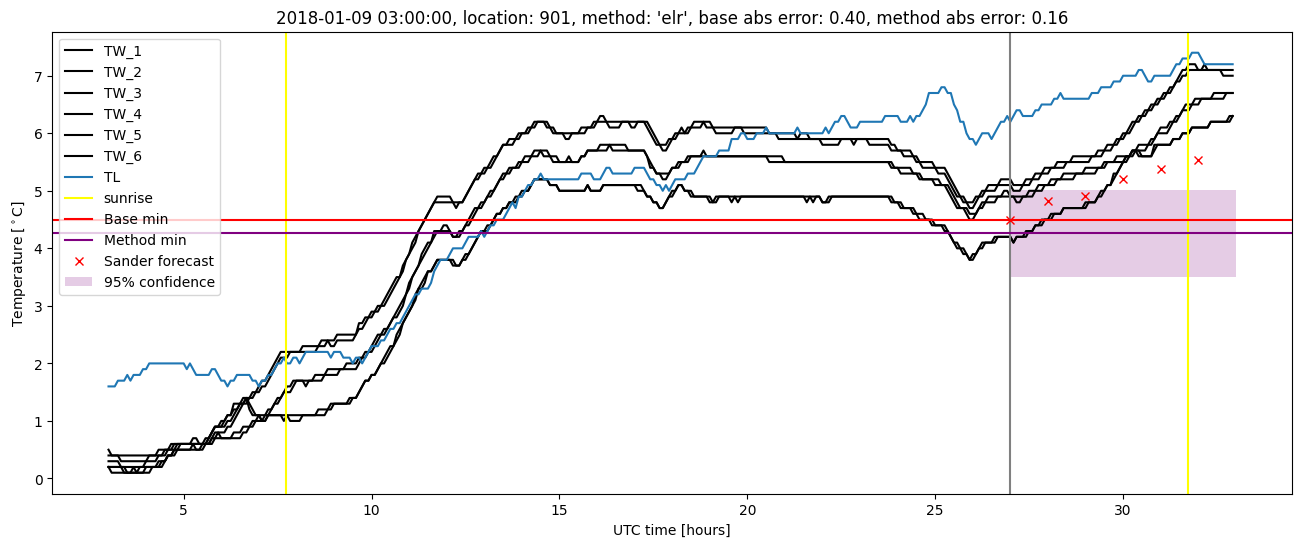
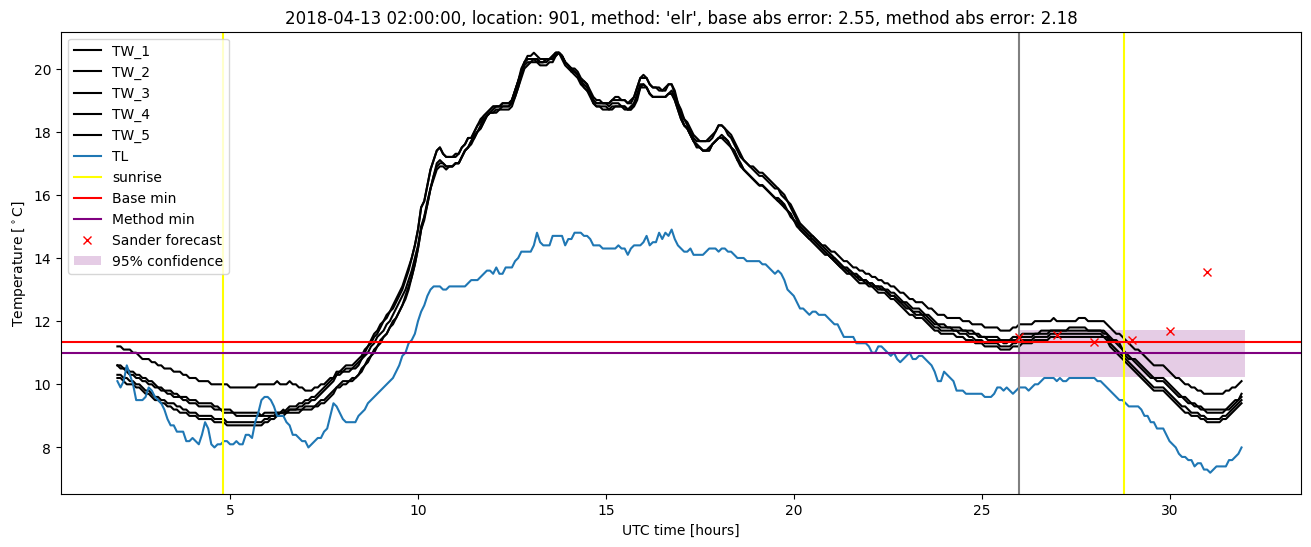
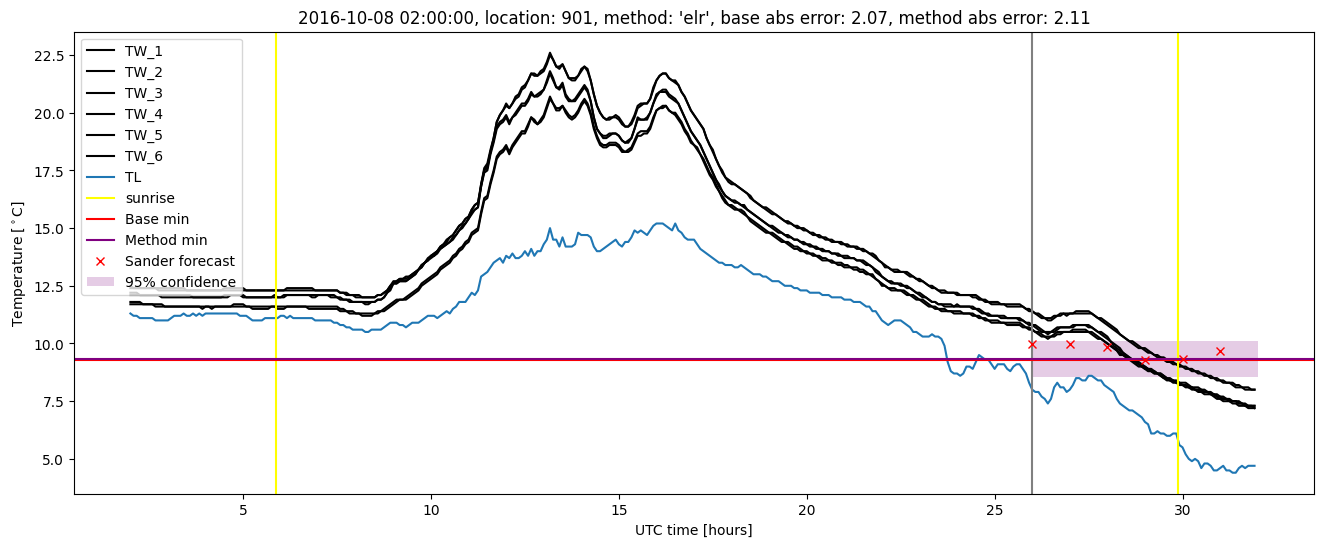
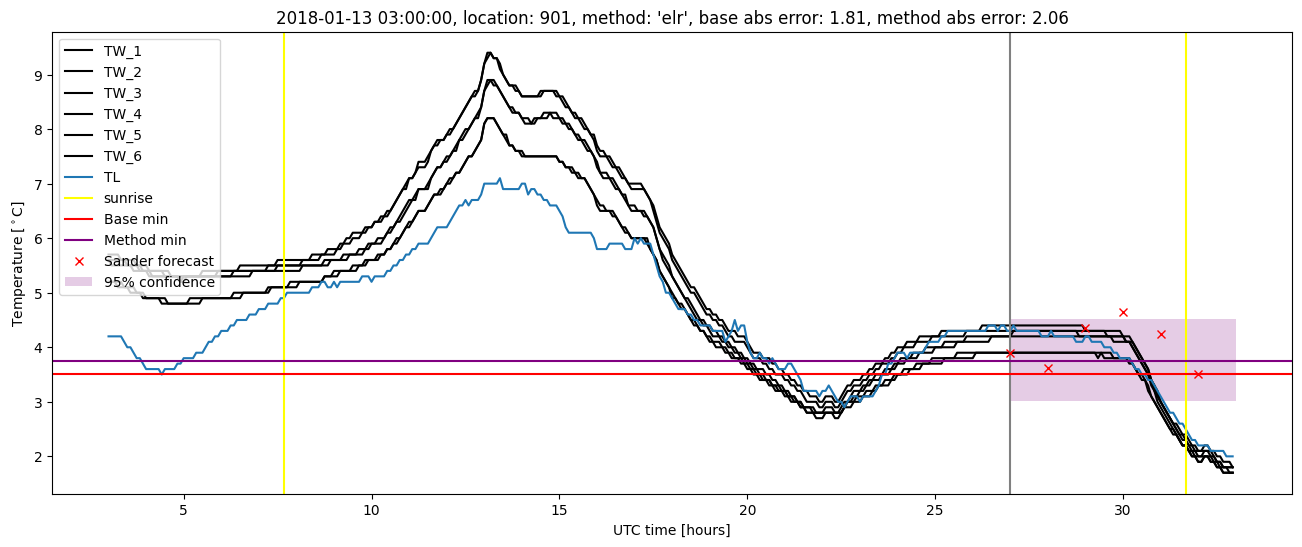
Extended logistic regression plots