GMS location: 873
Random forest results
| names |
period |
power |
significance |
meanSquareError |
absError |
maxError |
CRPS |
IGN |
| baseline |
winter 2016 |
0.982 |
0.125 |
0.325 |
0.392 |
2.699 |
NaN |
NaN |
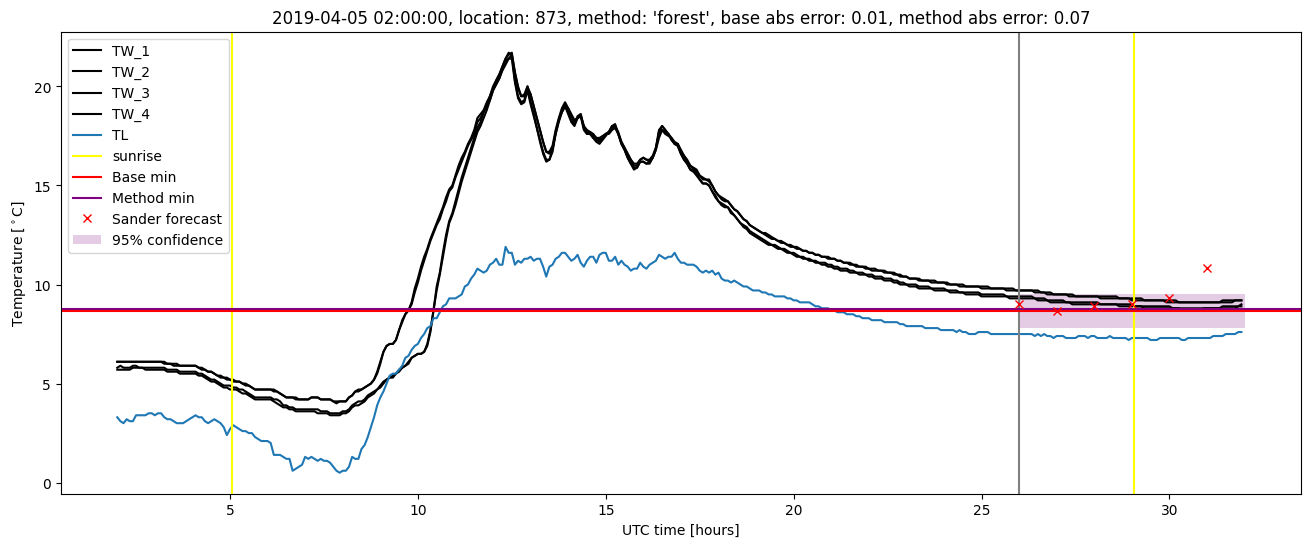
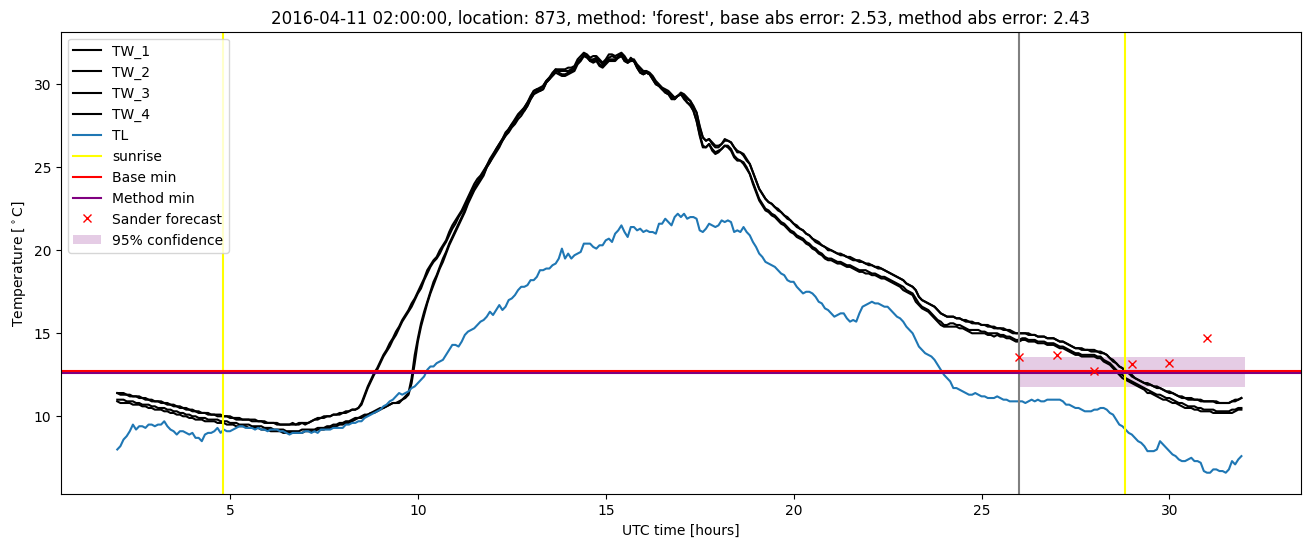
| forest |
winter 2016 |
0.976 |
0.125 |
0.305 |
0.375 |
2.430 |
0.503 |
3.553 |
| baseline |
winter 2017 |
0.991 |
0.000e+00 |
0.295 |
0.404 |
1.890 |
NaN |
NaN |
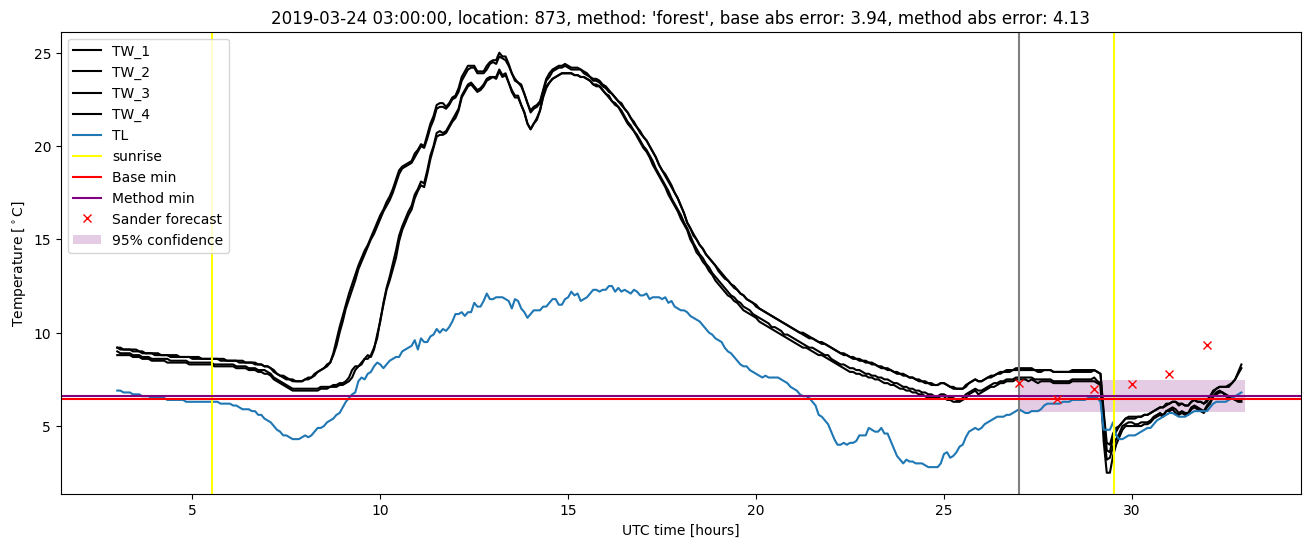
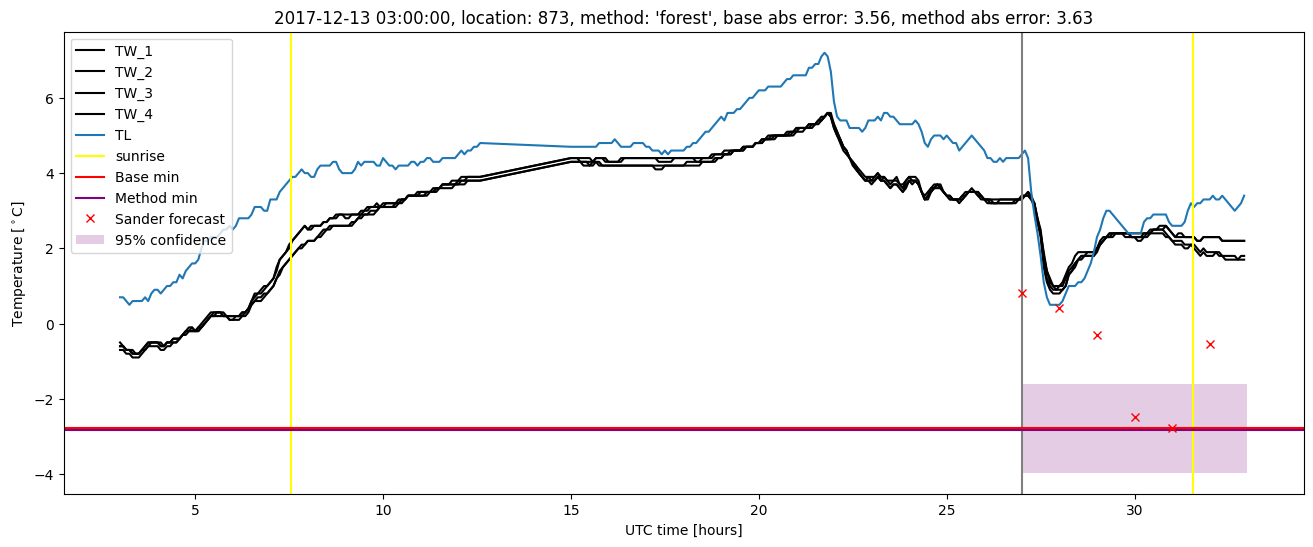
| forest |
winter 2017 |
0.991 |
0.000e+00 |
0.266 |
0.374 |
1.753 |
0.488 |
2.781 |
| baseline |
winter 2018 |
0.967 |
0.107 |
0.430 |
0.469 |
3.563 |
NaN |
NaN |
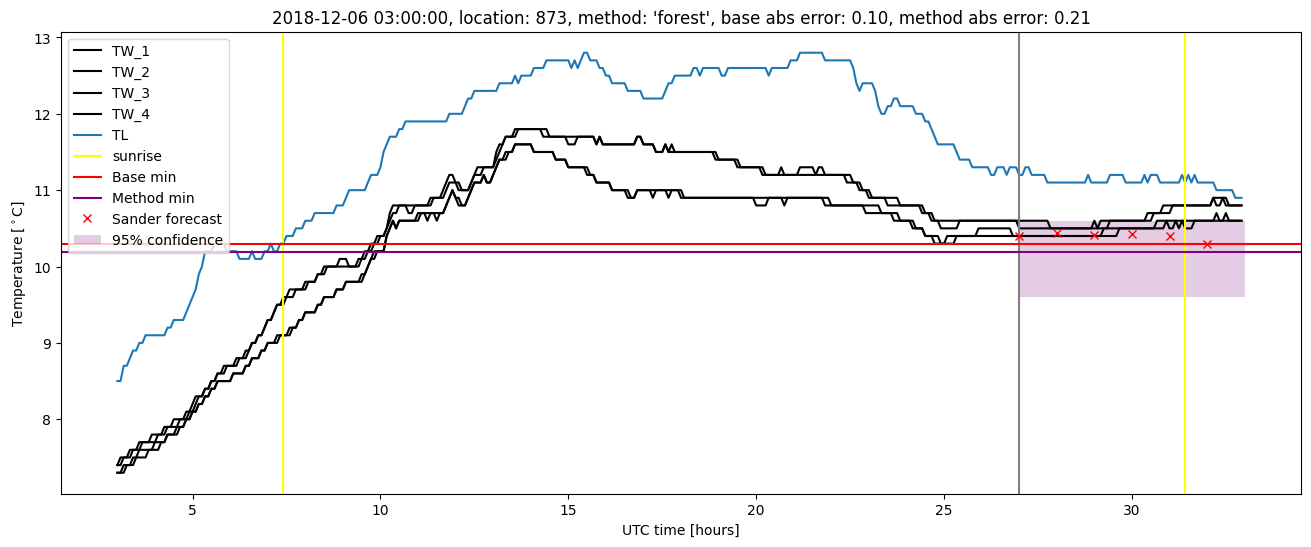
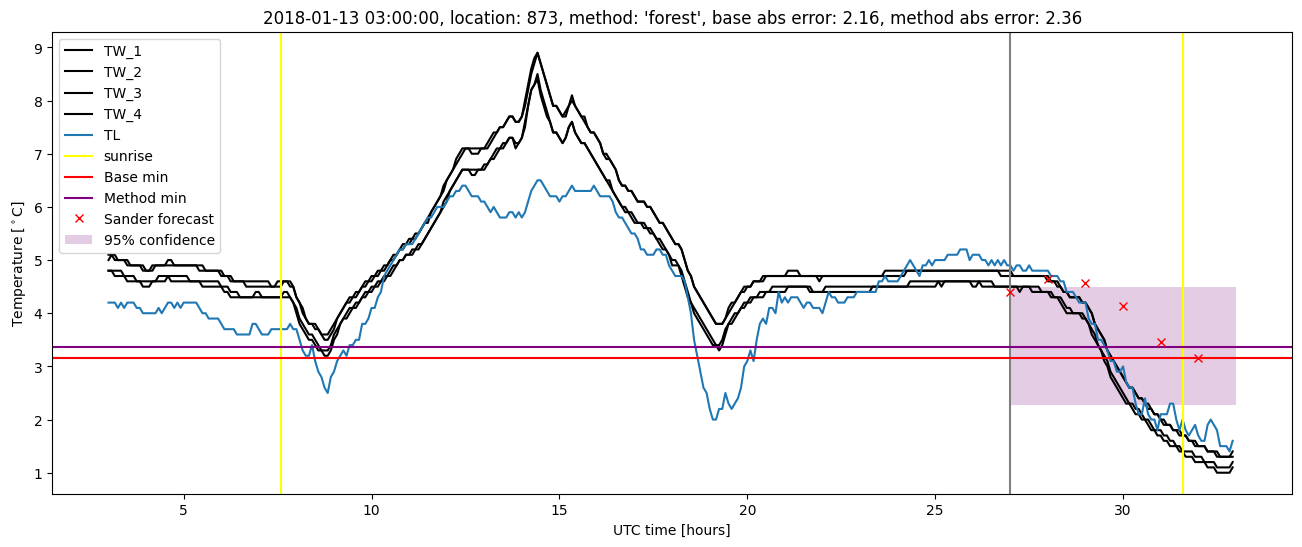
| forest |
winter 2018 |
0.967 |
0.107 |
0.372 |
0.428 |
3.632 |
0.496 |
2.985 |
| baseline |
winter 2019 |
0.986 |
0.048 |
0.453 |
0.464 |
3.935 |
NaN |
NaN |
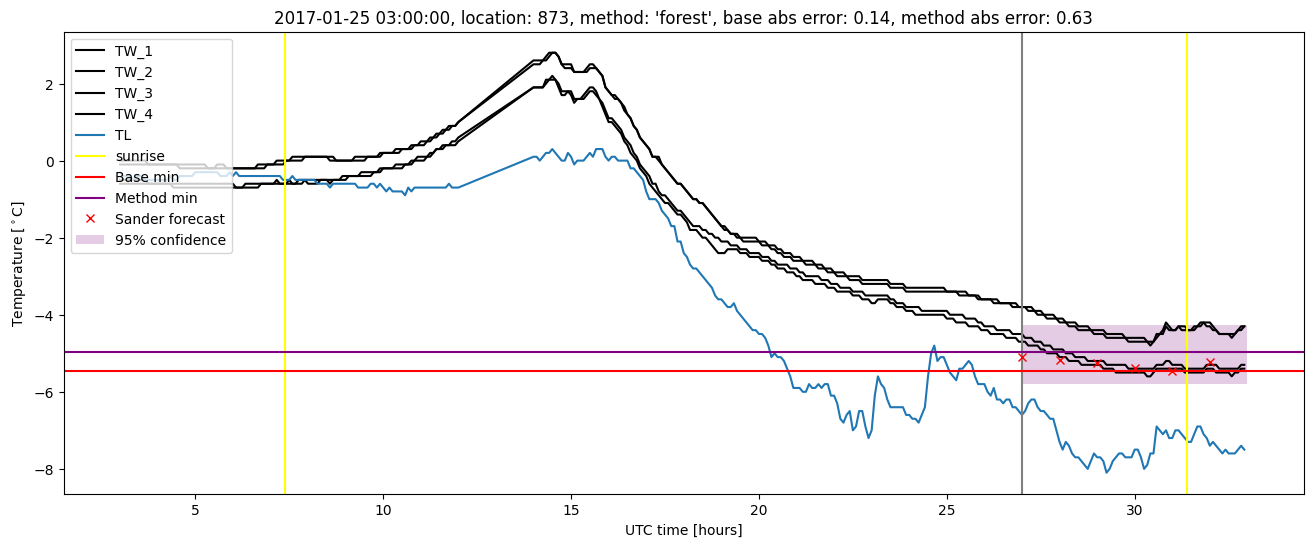
| forest |
winter 2019 |
0.986 |
0.048 |
0.411 |
0.440 |
4.129 |
0.481 |
2.607 |
| baseline |
all |
0.981 |
0.061 |
0.376 |
0.432 |
3.935 |
NaN |
NaN |
| forest |
all |
0.979 |
0.061 |
0.339 |
0.404 |
4.129 |
0.493 |
3.006 |
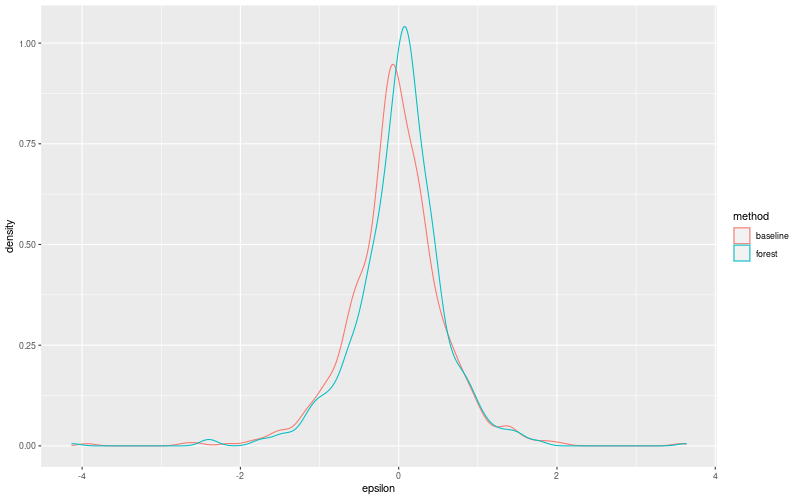
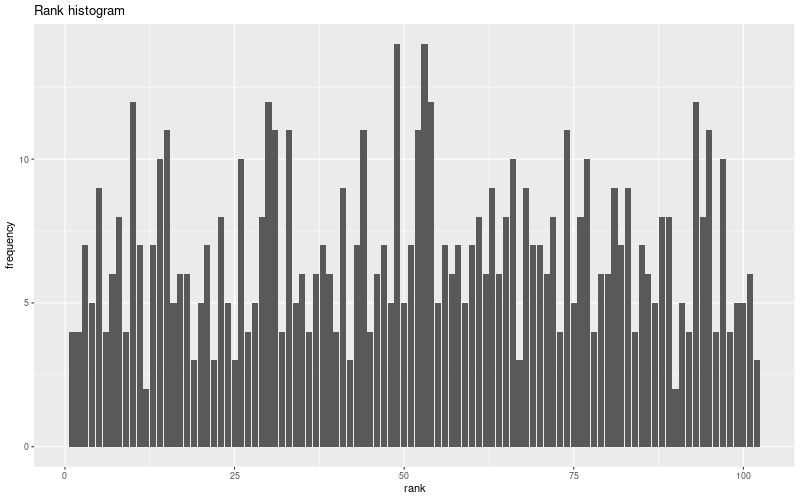
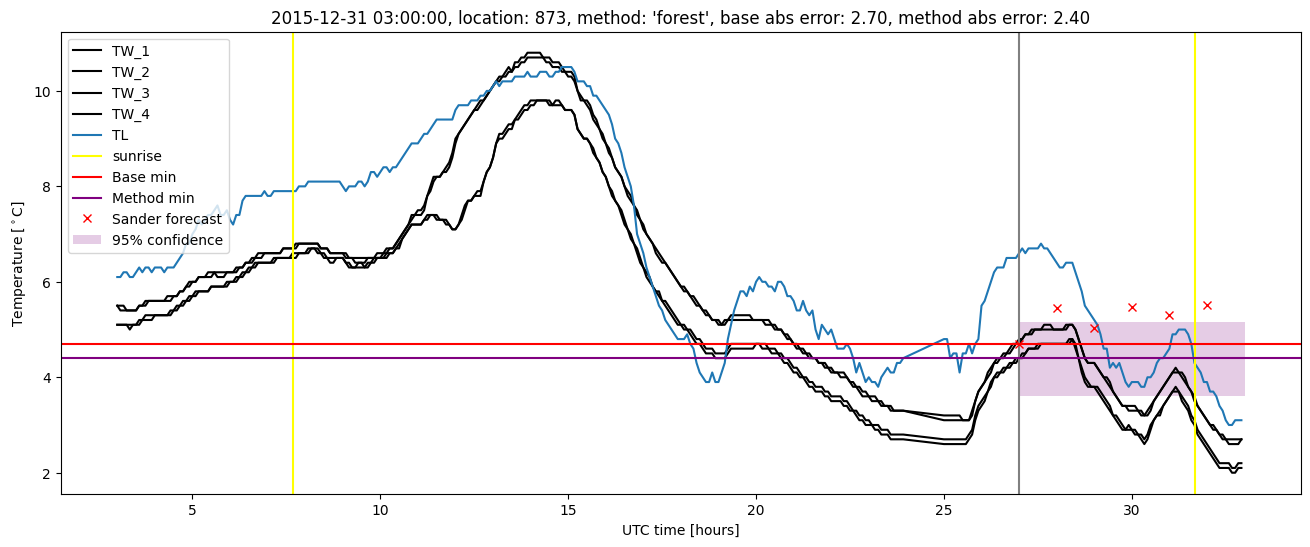
Random forest plots
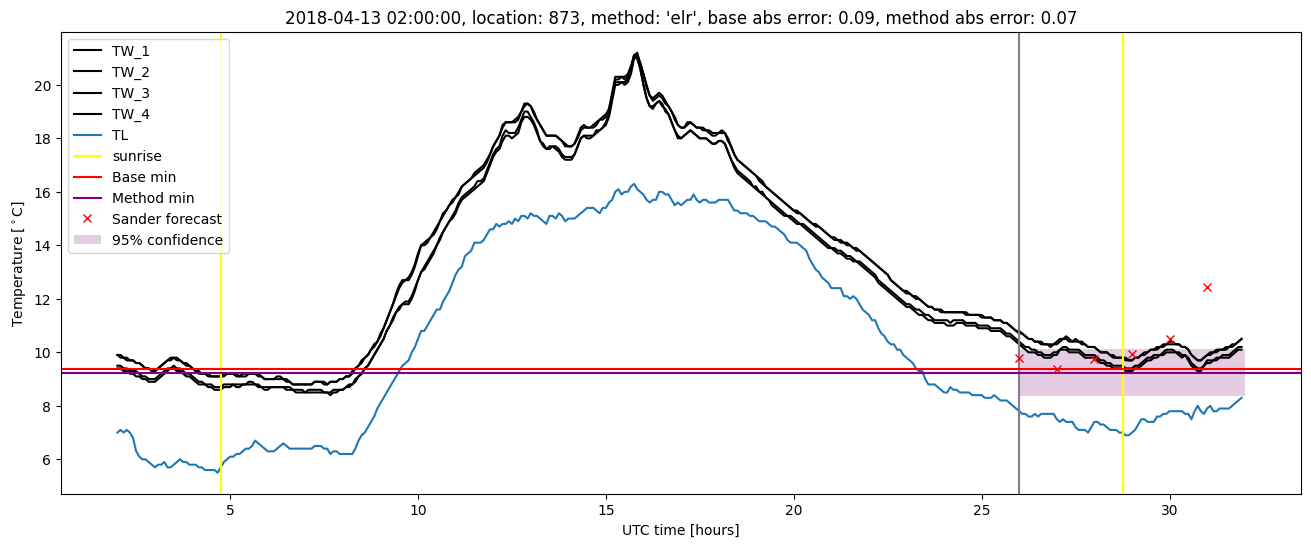
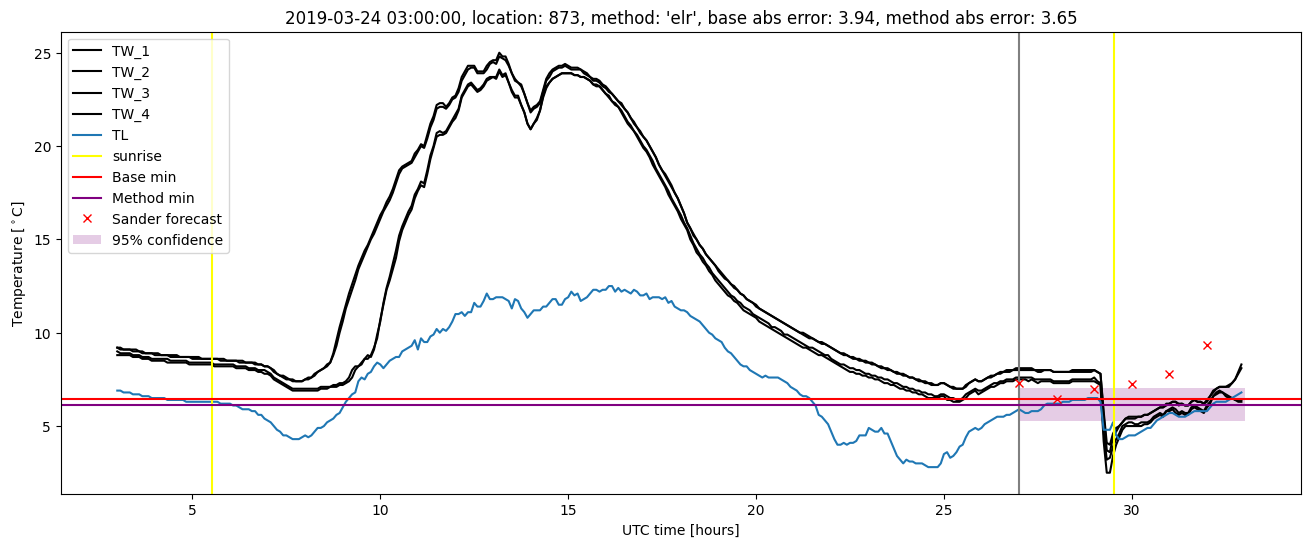
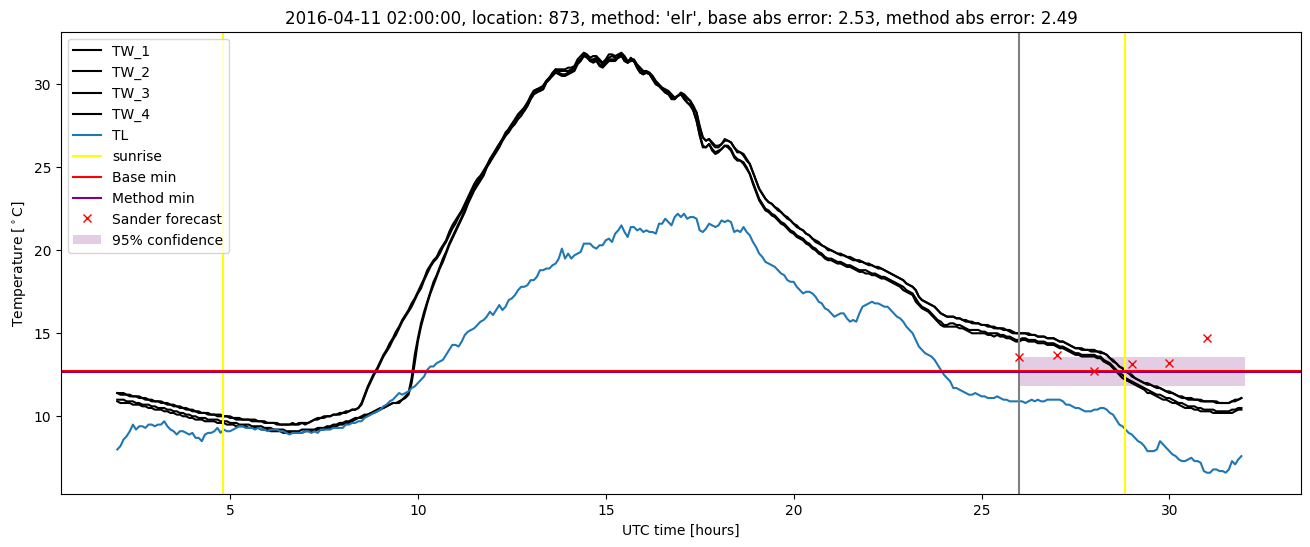
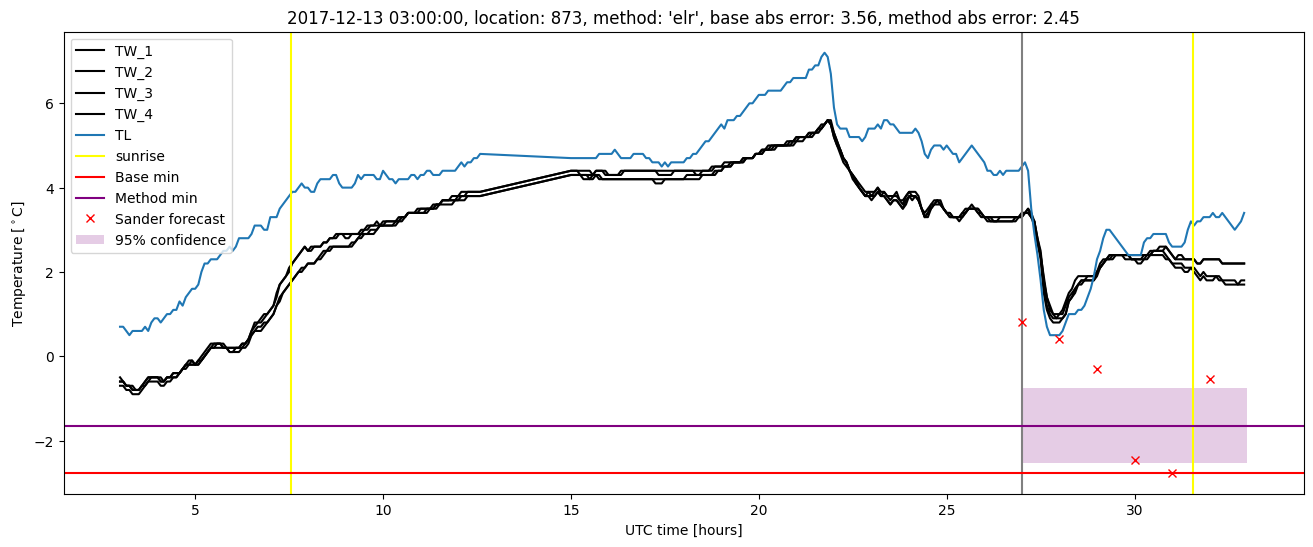
Extended logistic regression results
| names |
period |
power |
significance |
meanSquareError |
absError |
maxError |
CRPS |
IGN |
| baseline |
winter 2016 |
0.982 |
0.125 |
0.325 |
0.392 |
2.699 |
NaN |
NaN |
| elr |
winter 2016 |
0.976 |
0.083 |
0.321 |
0.406 |
2.486 |
0.561 |
4.664 |
| baseline |
winter 2017 |
0.991 |
0.000e+00 |
0.295 |
0.404 |
1.890 |
NaN |
NaN |
| elr |
winter 2017 |
0.991 |
0.000e+00 |
0.251 |
0.368 |
1.515 |
0.549 |
3.561 |
| baseline |
winter 2018 |
0.967 |
0.107 |
0.430 |
0.469 |
3.563 |
NaN |
NaN |
| elr |
winter 2018 |
0.980 |
0.107 |
0.338 |
0.428 |
2.453 |
0.561 |
4.561 |
| baseline |
winter 2019 |
0.986 |
0.048 |
0.453 |
0.464 |
3.935 |
NaN |
NaN |
| elr |
winter 2019 |
0.986 |
0.048 |
0.401 |
0.446 |
3.652 |
0.548 |
4.470 |
| baseline |
all |
0.981 |
0.061 |
0.376 |
0.432 |
3.935 |
NaN |
NaN |
| elr |
all |
0.983 |
0.052 |
0.329 |
0.413 |
3.652 |
0.555 |
4.346 |
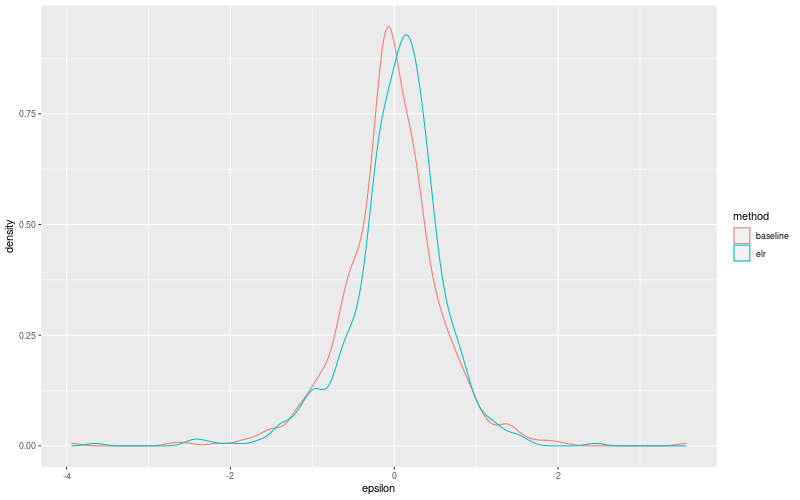
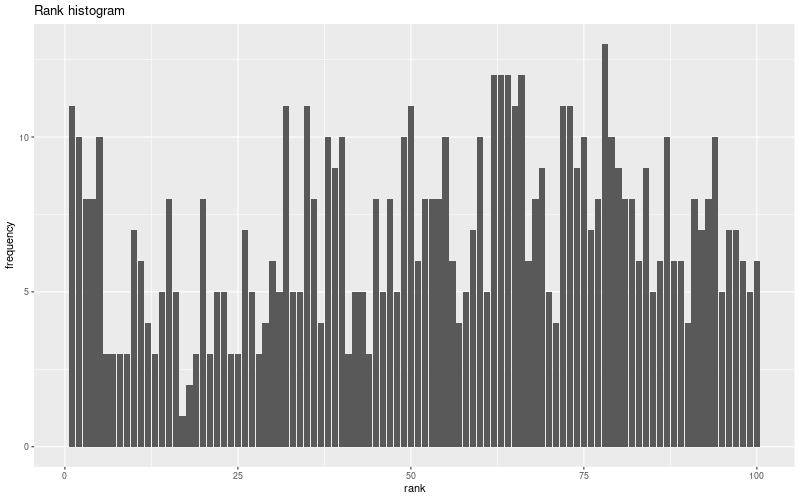
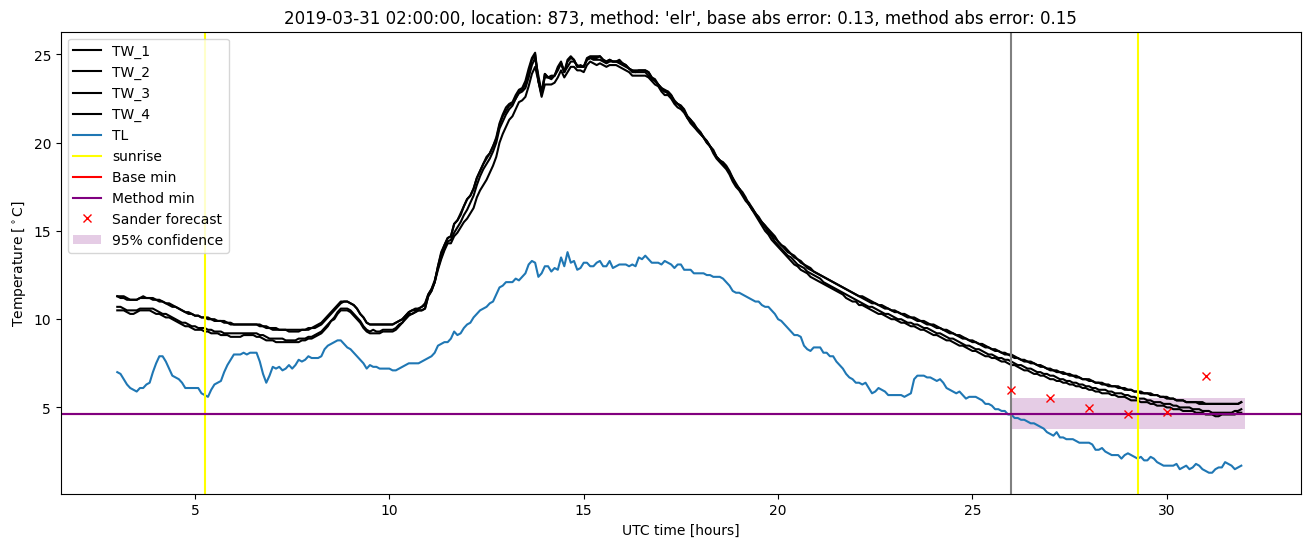
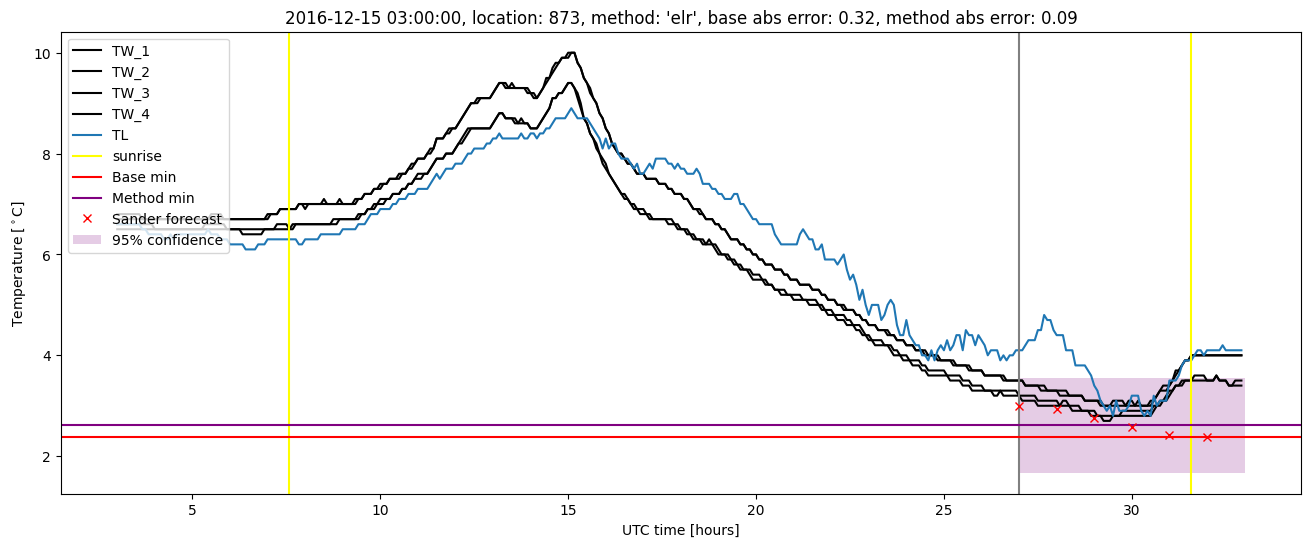
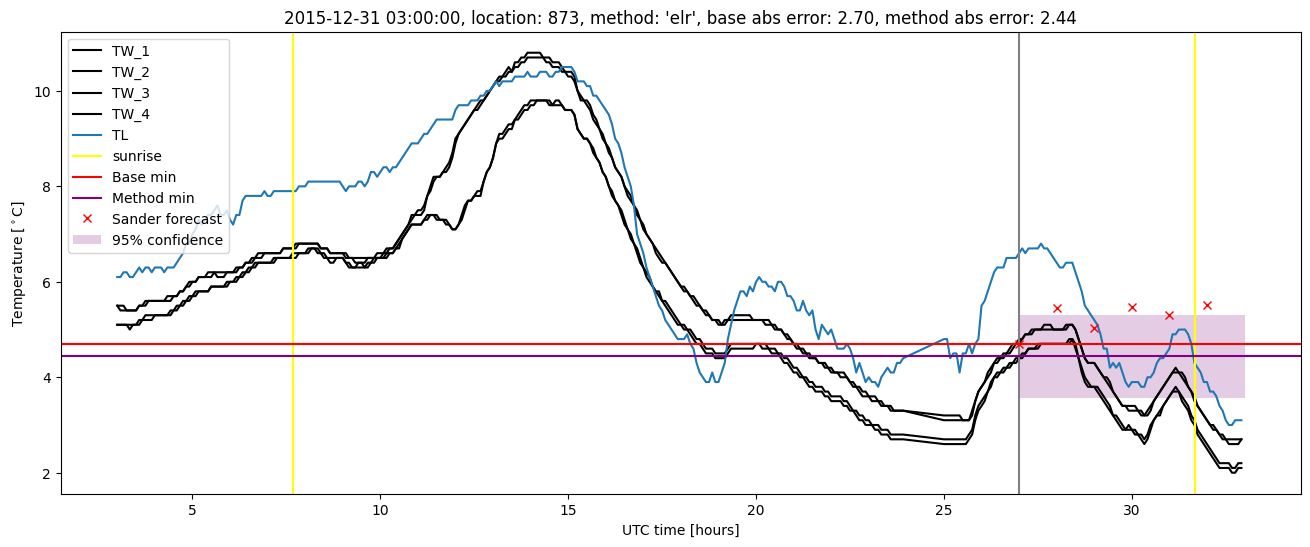
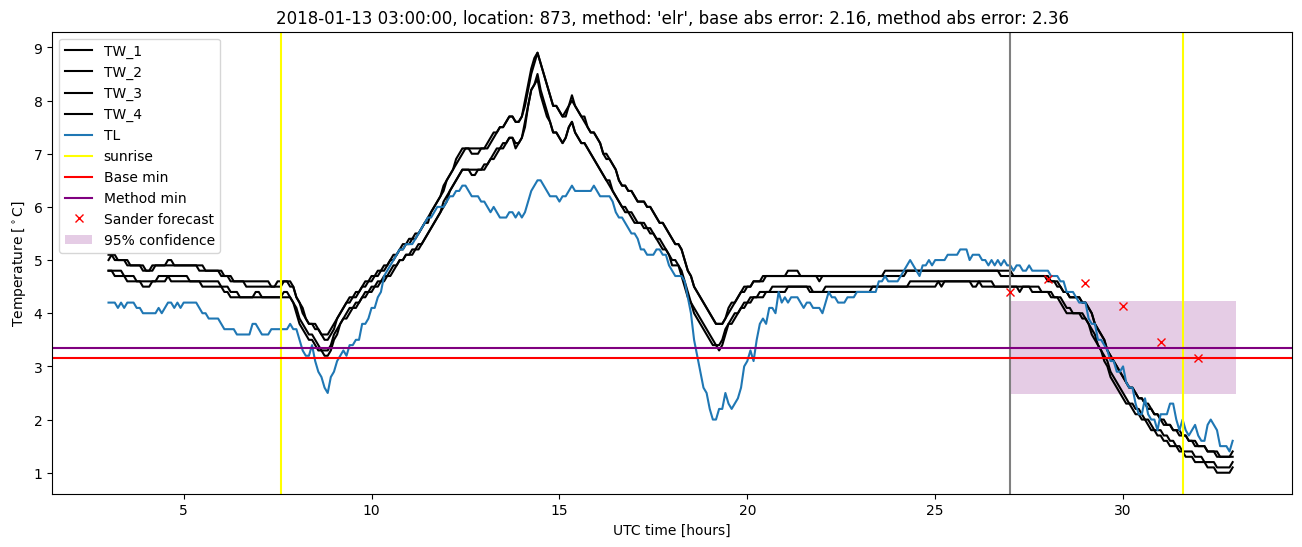
Extended logistic regression plots