GMS location: 872
Random forest results
| names |
period |
power |
significance |
meanSquareError |
absError |
maxError |
CRPS |
IGN |
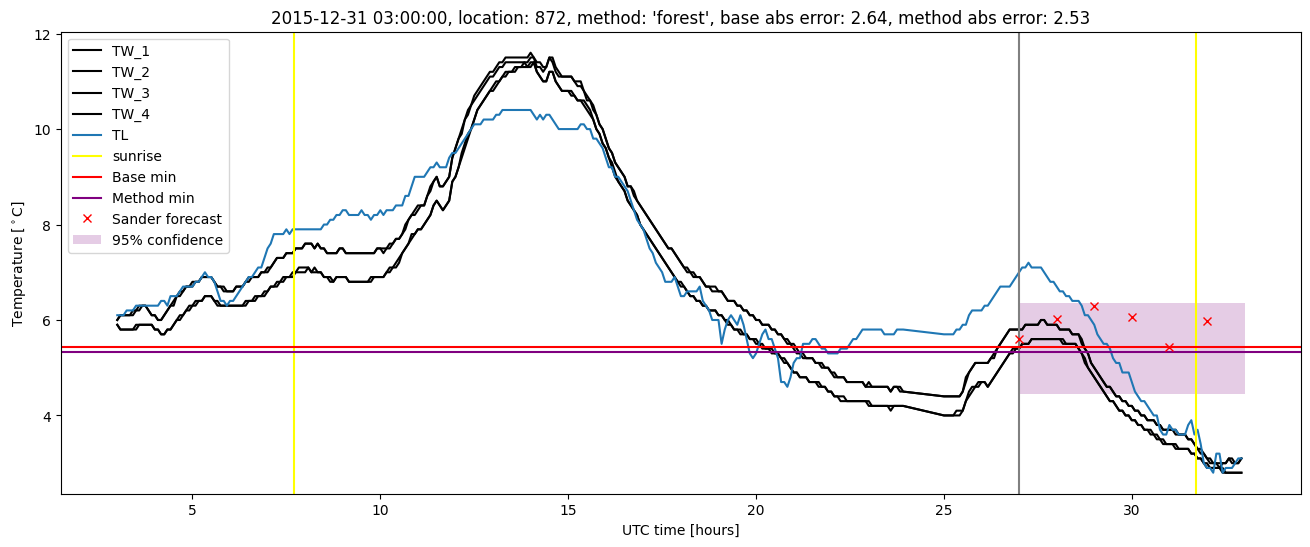
| baseline |
winter 2016 |
0.966 |
0.125 |
0.357 |
0.425 |
2.639 |
NaN |
NaN |
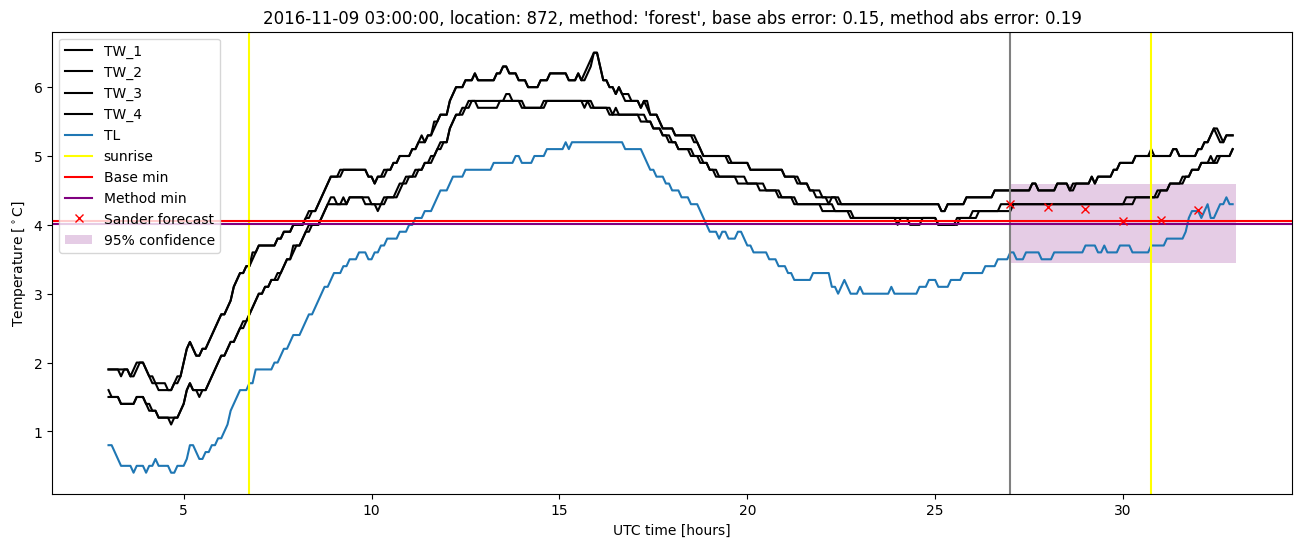
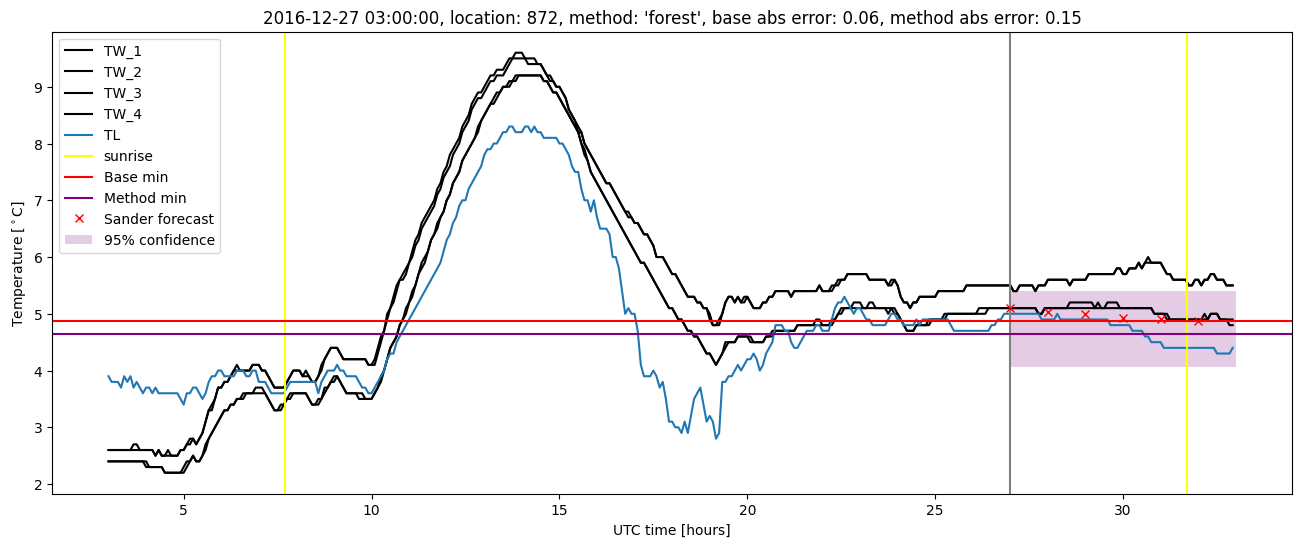
| forest |
winter 2016 |
0.977 |
0.125 |
0.289 |
0.378 |
2.531 |
0.473 |
4.831 |
| baseline |
winter 2017 |
0.960 |
0.148 |
0.406 |
0.457 |
2.621 |
NaN |
NaN |
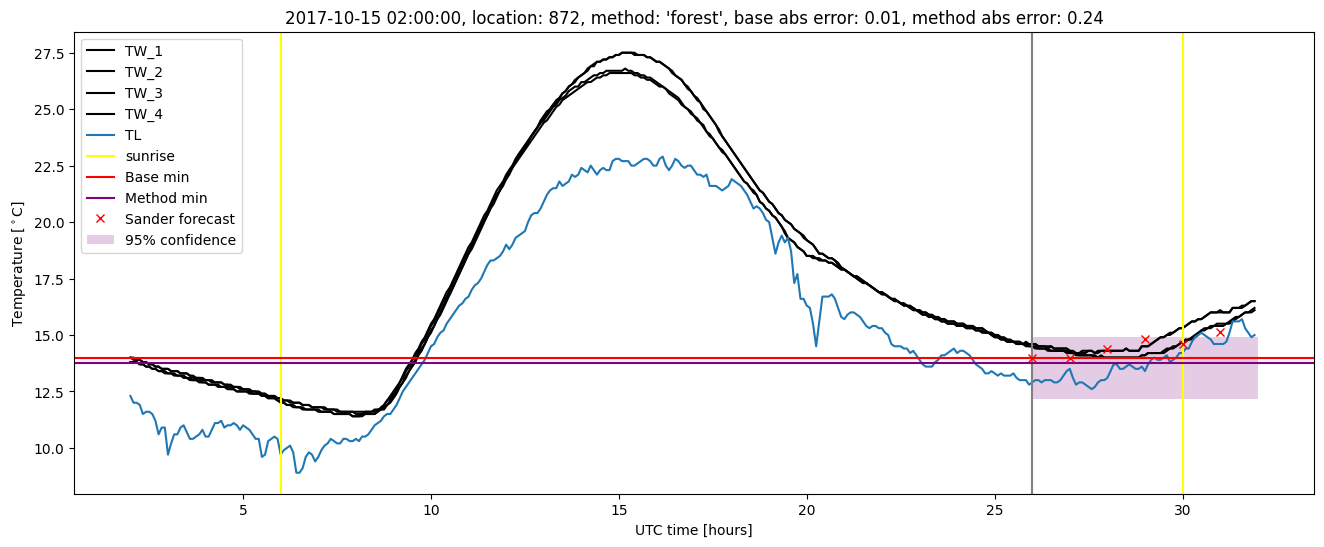
| forest |
winter 2017 |
0.984 |
0.148 |
0.286 |
0.378 |
1.906 |
0.452 |
3.667 |
| baseline |
winter 2018 |
0.993 |
0.191 |
0.294 |
0.409 |
2.000 |
NaN |
NaN |
| forest |
winter 2018 |
0.993 |
0.191 |
0.259 |
0.378 |
2.251 |
0.452 |
3.369 |
| baseline |
winter 2019 |
0.986 |
0.000e+00 |
0.297 |
0.404 |
2.035 |
NaN |
NaN |
| forest |
winter 2019 |
0.993 |
0.071 |
0.201 |
0.325 |
1.502 |
0.438 |
2.875 |
| baseline |
all |
0.976 |
0.128 |
0.338 |
0.423 |
2.639 |
NaN |
NaN |
| forest |
all |
0.987 |
0.141 |
0.260 |
0.366 |
2.531 |
0.455 |
3.739 |
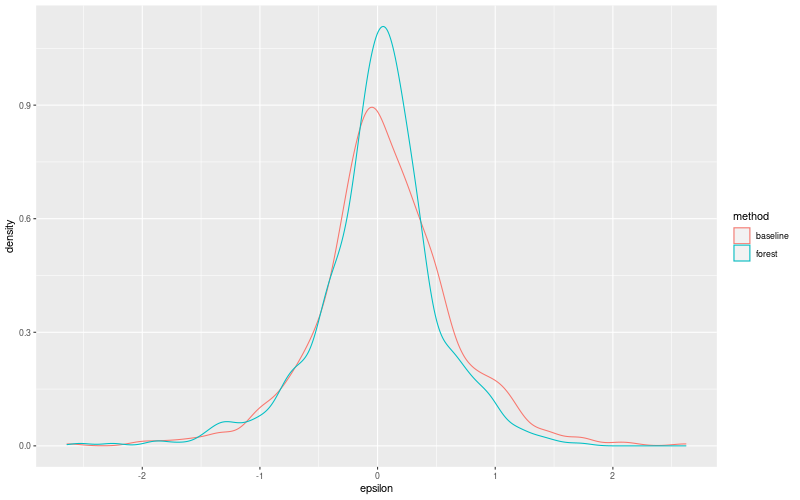
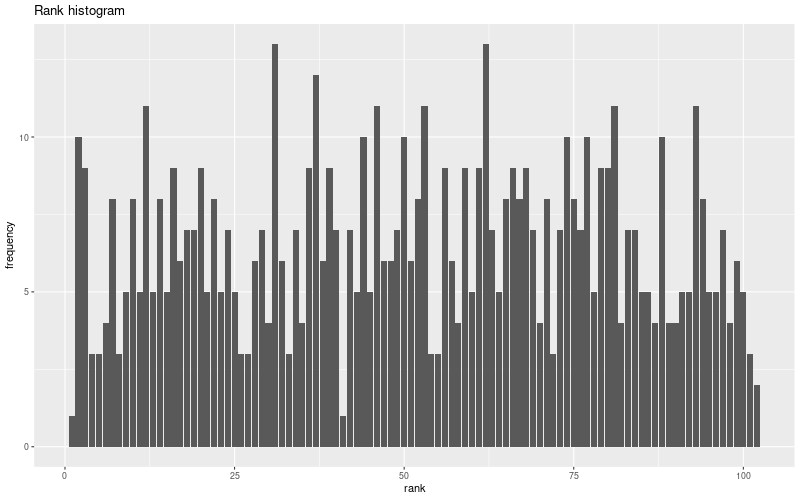
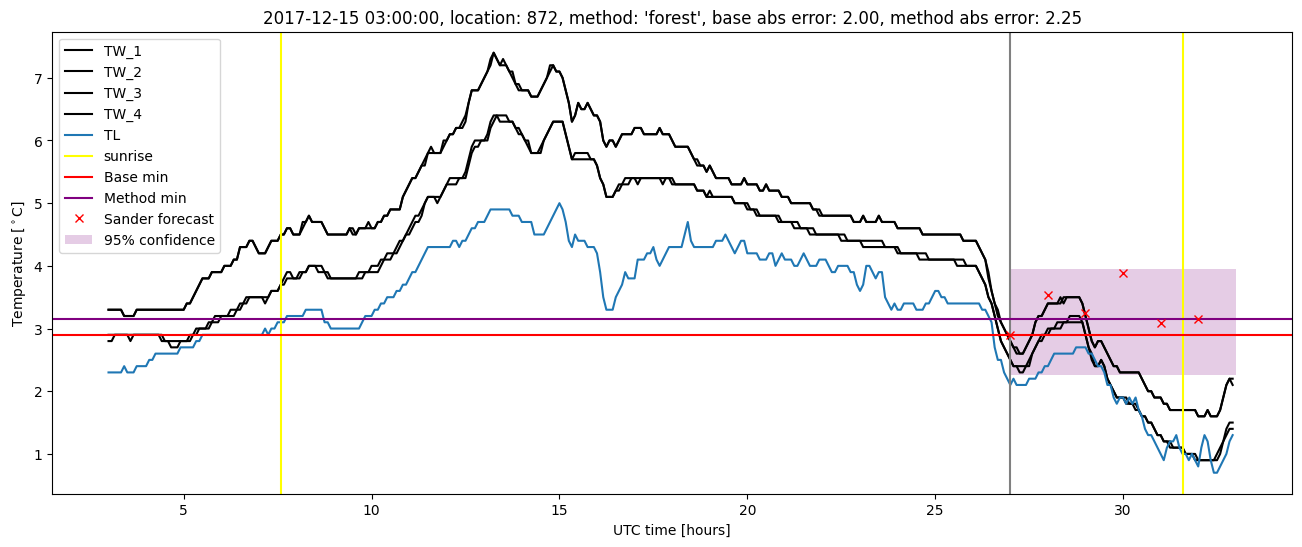
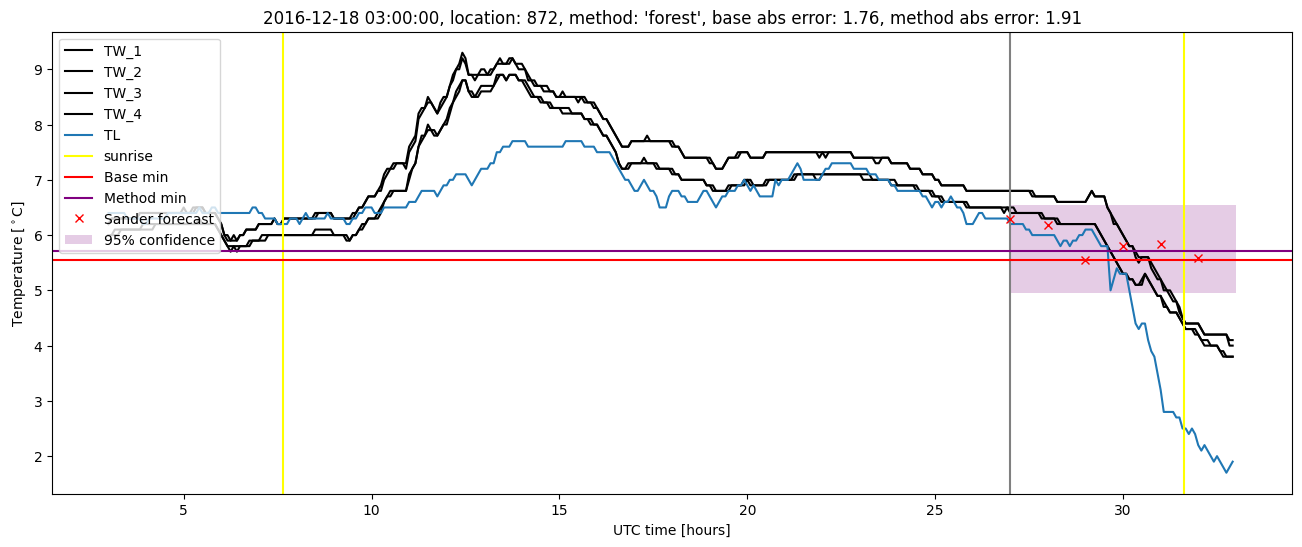
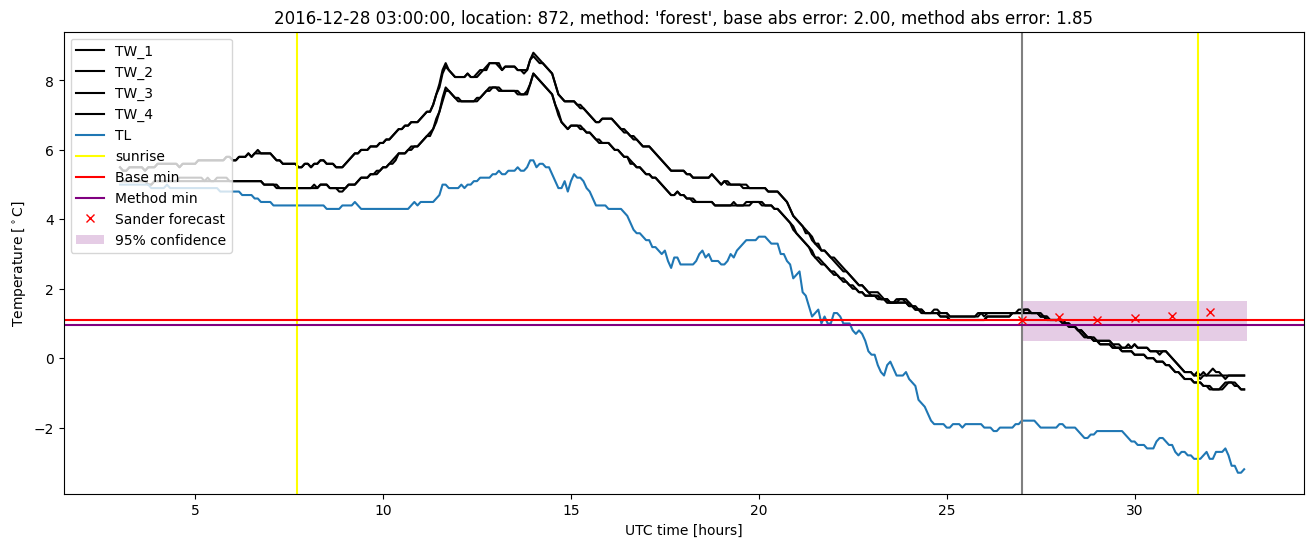
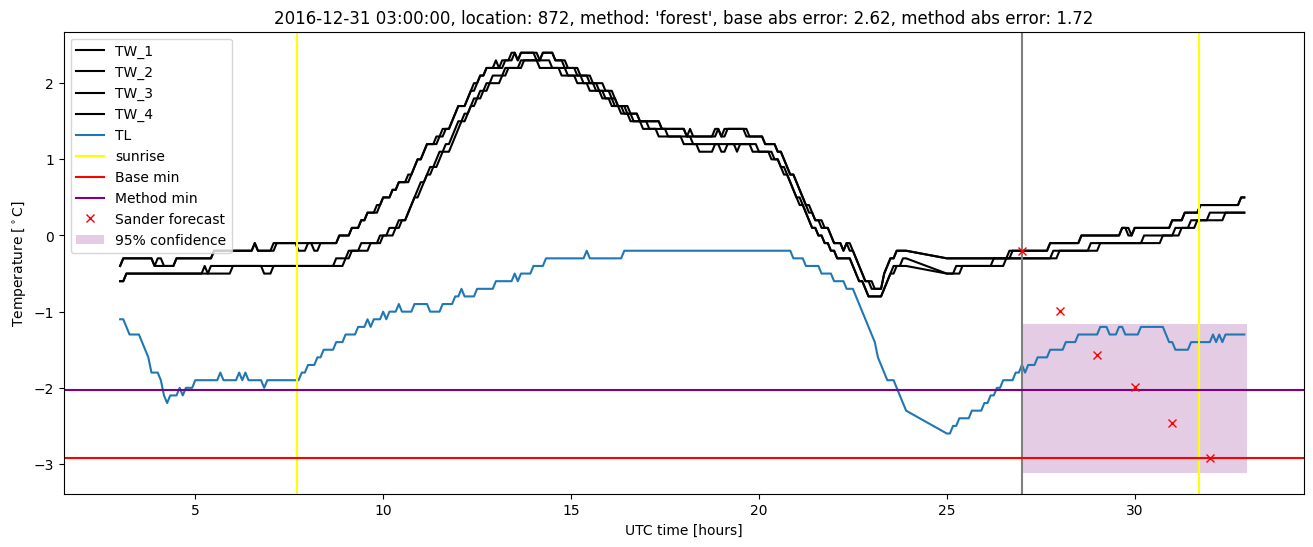
Random forest plots
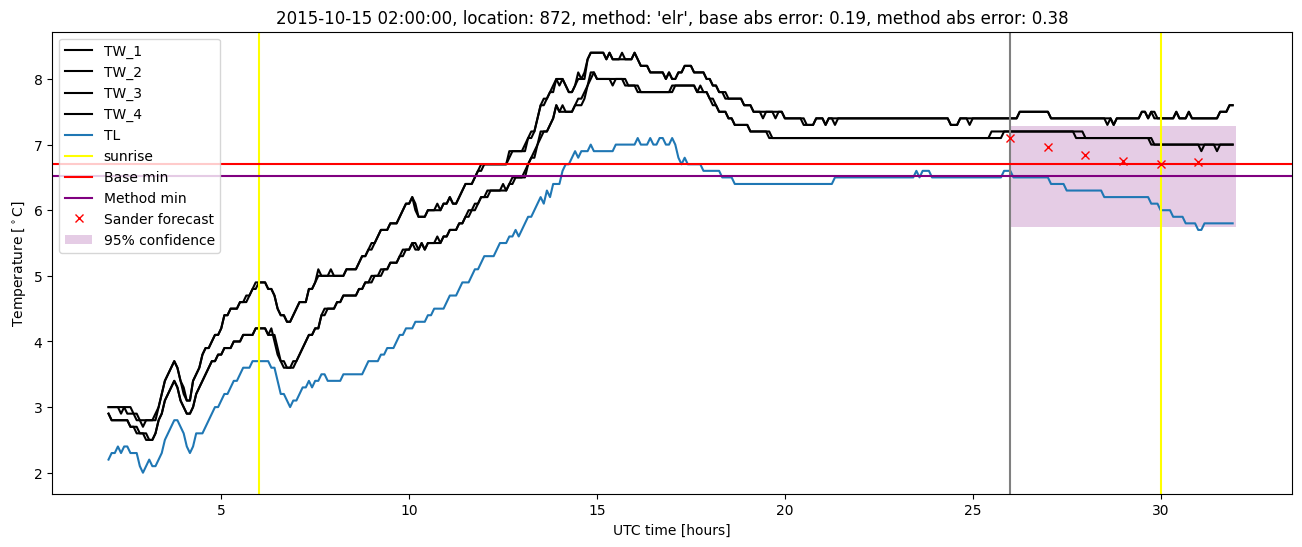
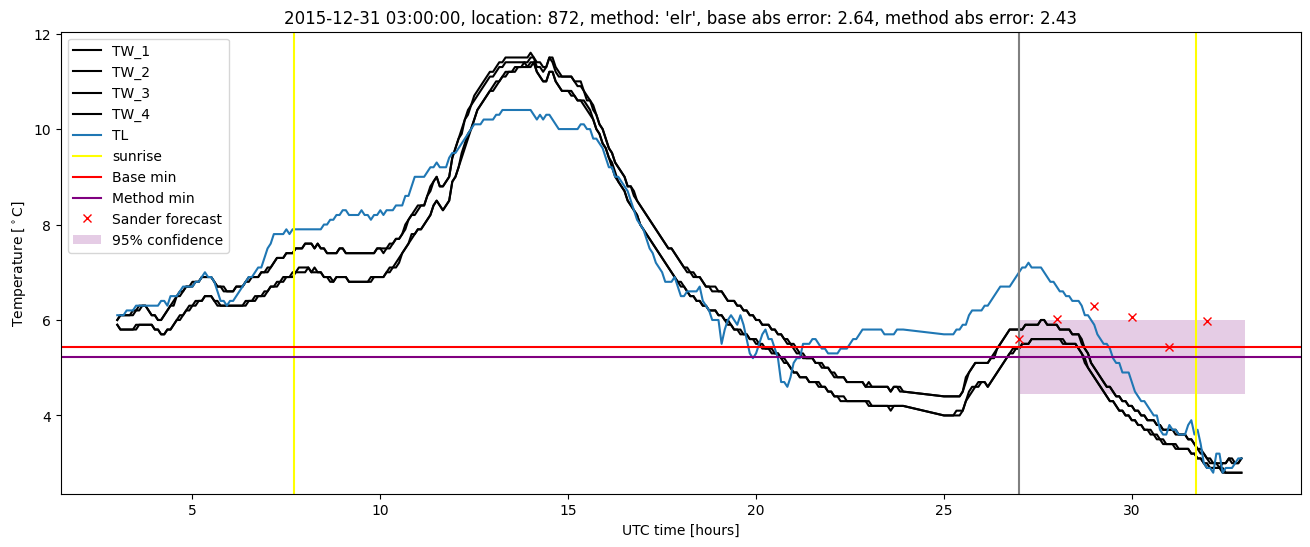
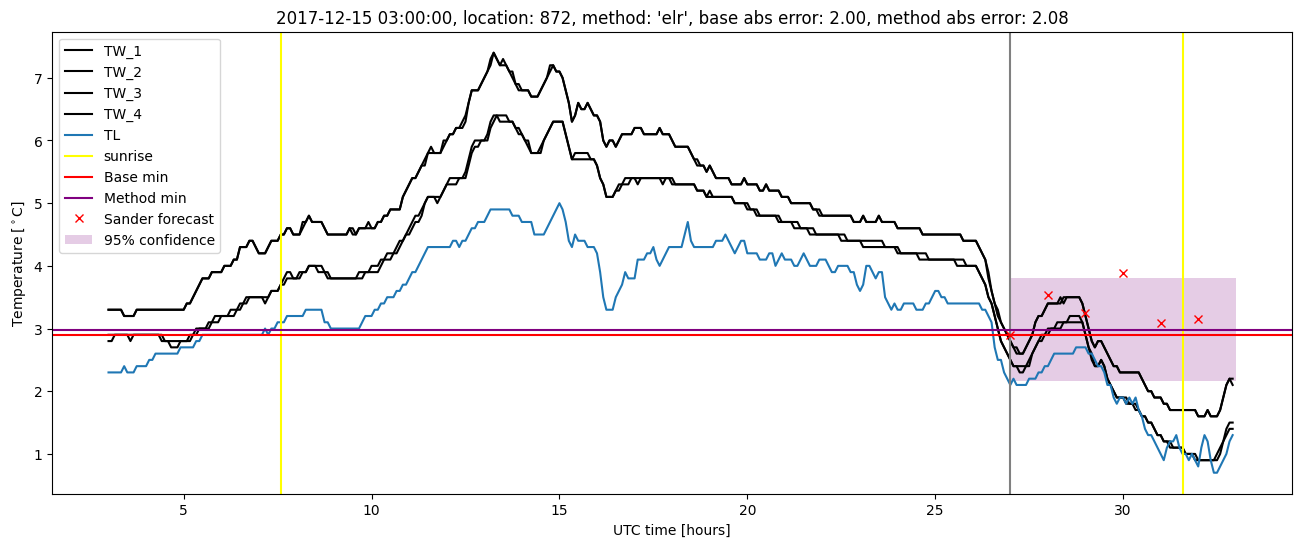
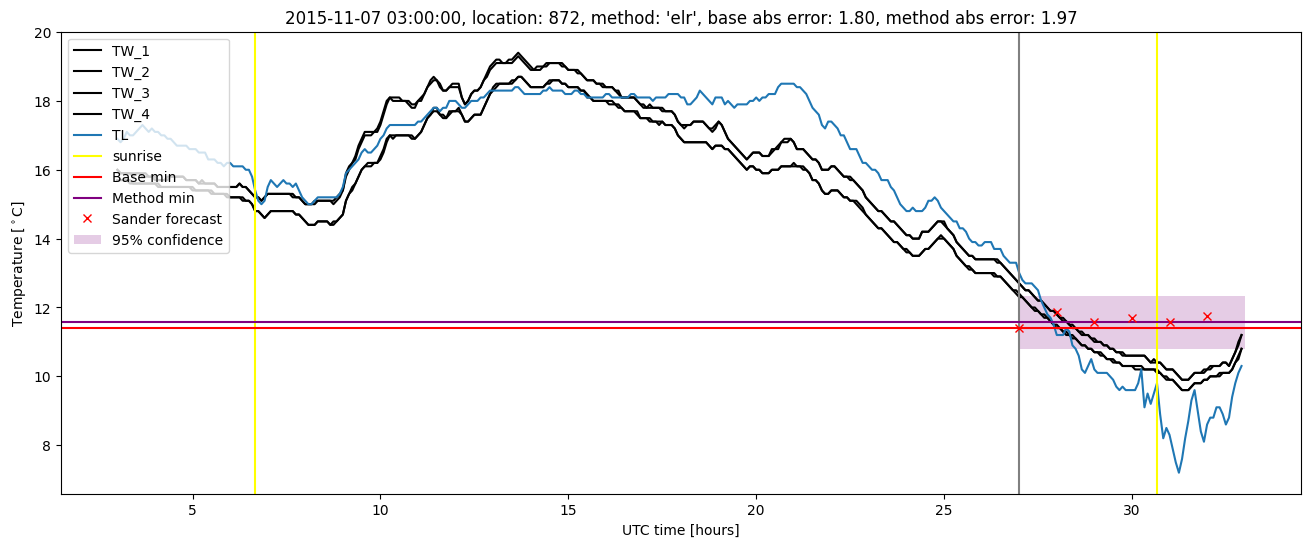
Extended logistic regression results
| names |
period |
power |
significance |
meanSquareError |
absError |
maxError |
CRPS |
IGN |
| baseline |
winter 2016 |
0.966 |
0.125 |
0.357 |
0.425 |
2.639 |
NaN |
NaN |
| elr |
winter 2016 |
0.966 |
0.062 |
0.314 |
0.420 |
2.430 |
0.552 |
7.022 |
| baseline |
winter 2017 |
0.960 |
0.148 |
0.406 |
0.457 |
2.621 |
NaN |
NaN |
| elr |
winter 2017 |
0.984 |
0.111 |
0.286 |
0.383 |
1.901 |
0.505 |
5.195 |
| baseline |
winter 2018 |
0.993 |
0.191 |
0.294 |
0.409 |
2.000 |
NaN |
NaN |
| elr |
winter 2018 |
0.993 |
0.191 |
0.241 |
0.354 |
2.078 |
0.522 |
5.009 |
| baseline |
winter 2019 |
0.986 |
0.000e+00 |
0.297 |
0.404 |
2.035 |
NaN |
NaN |
| elr |
winter 2019 |
1.000 |
0.000e+00 |
0.185 |
0.312 |
1.287 |
0.484 |
4.023 |
| baseline |
all |
0.976 |
0.128 |
0.338 |
0.423 |
2.639 |
NaN |
NaN |
| elr |
all |
0.985 |
0.103 |
0.259 |
0.369 |
2.430 |
0.518 |
5.396 |
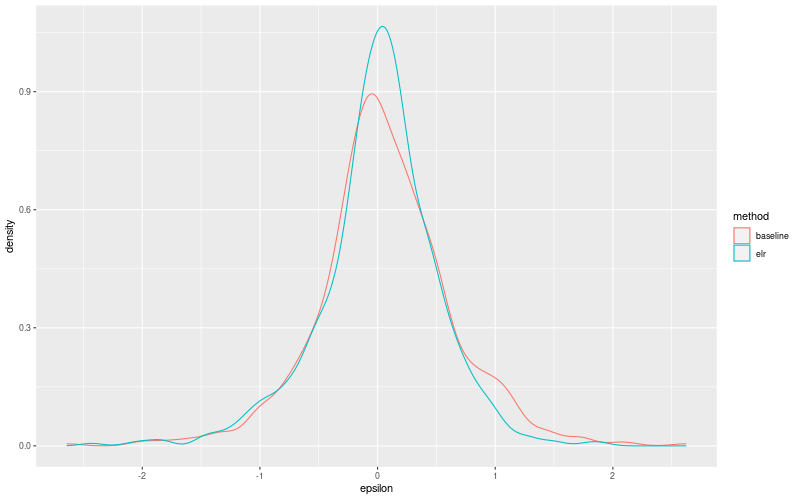
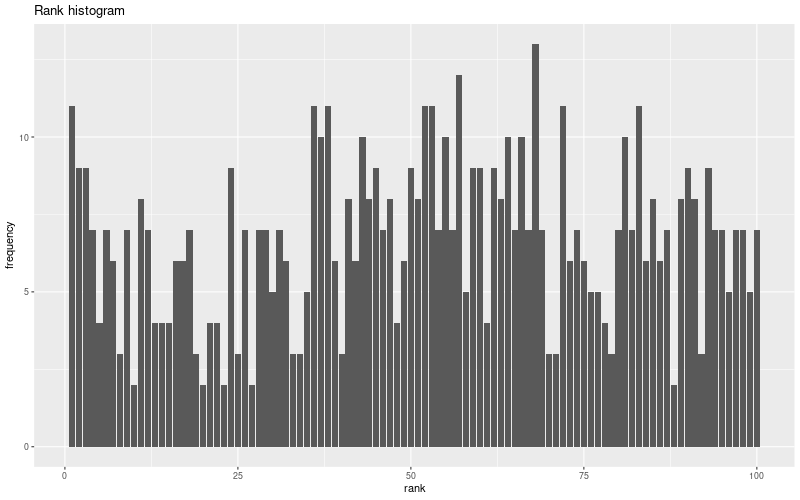
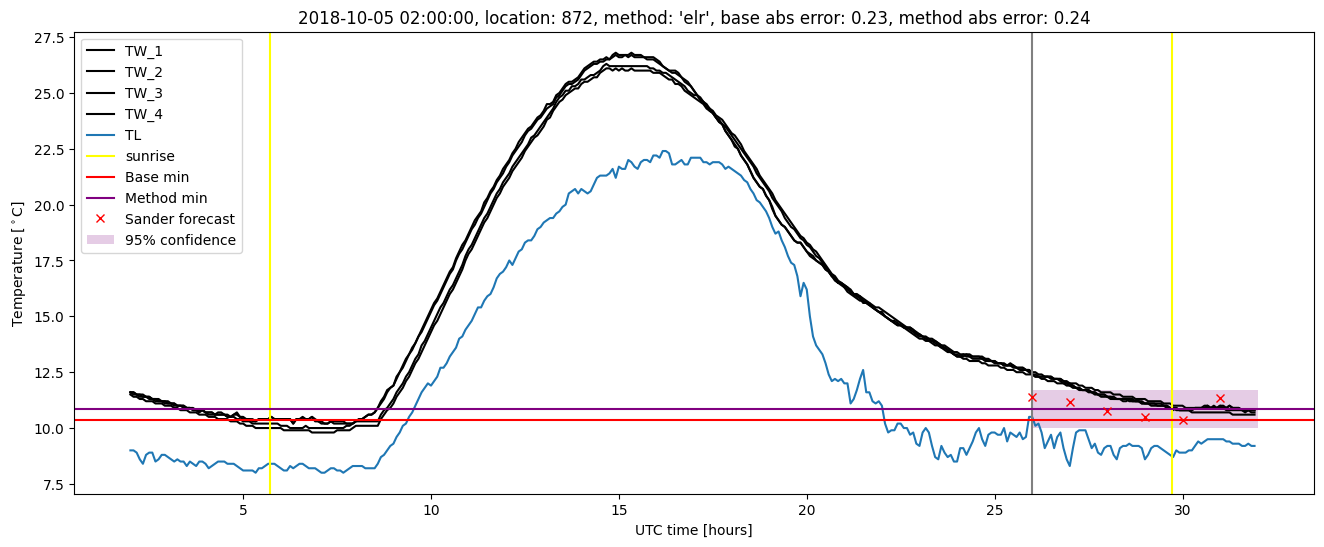
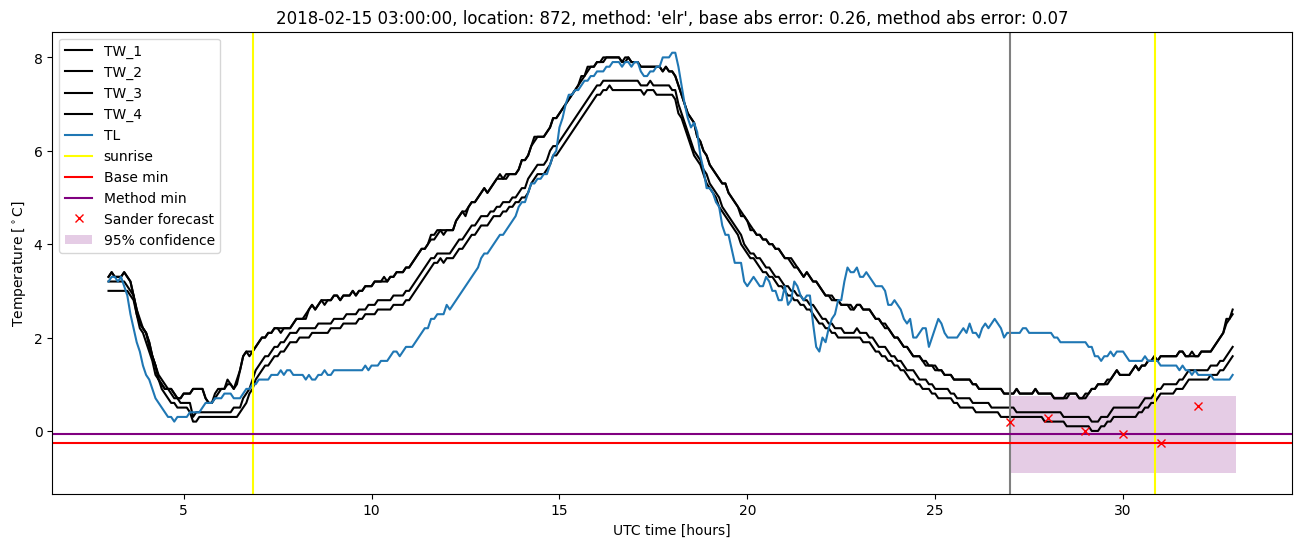
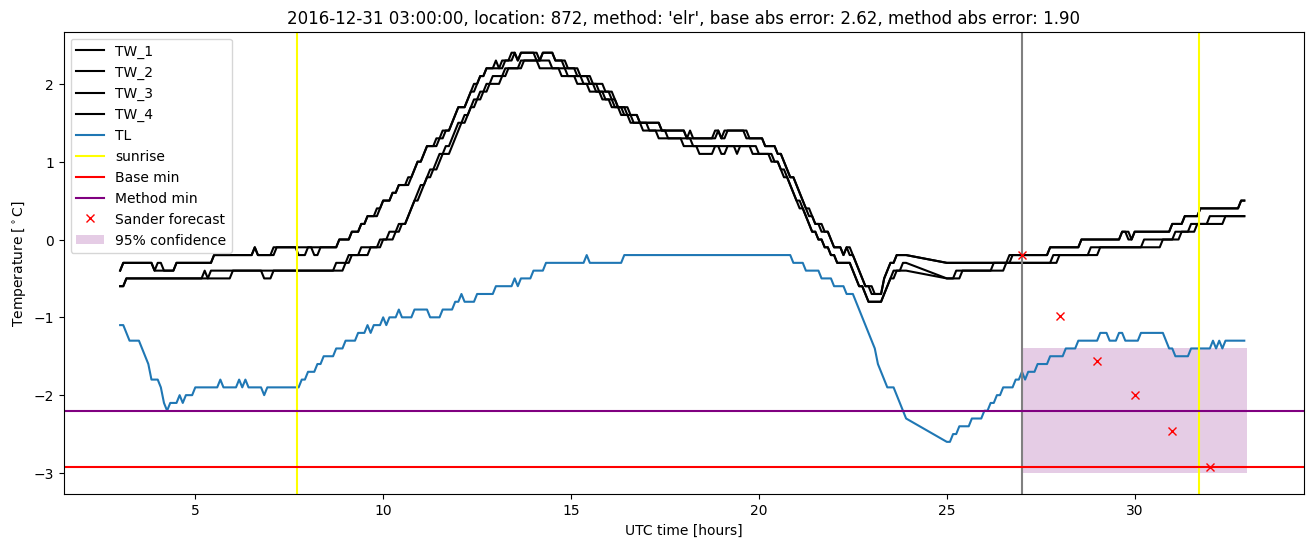
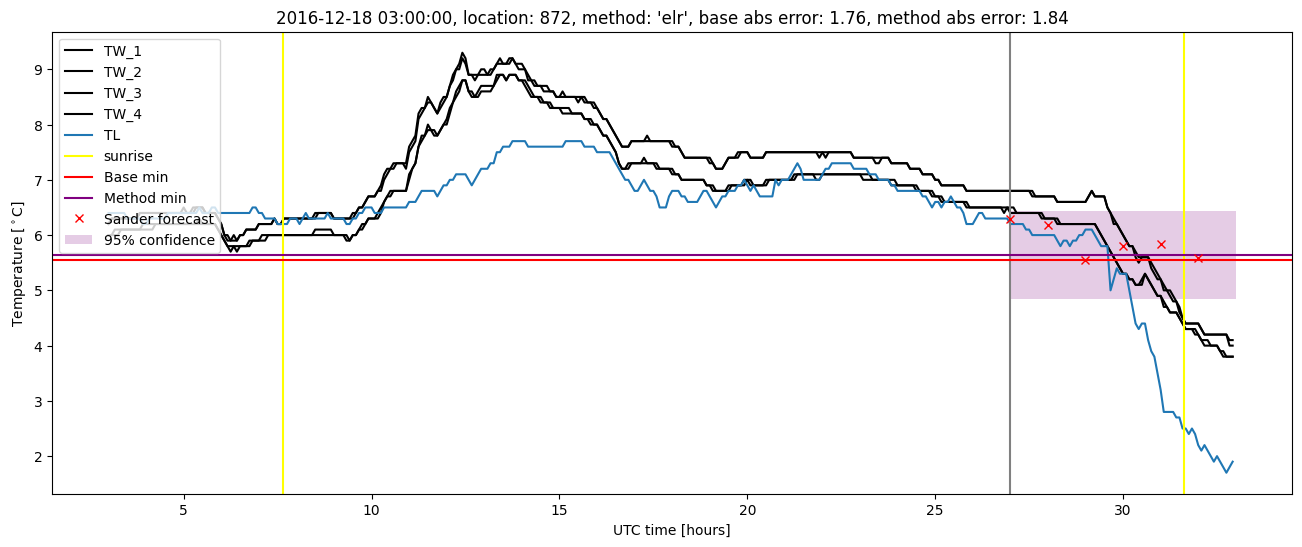
Extended logistic regression plots