GMS location: 871
Random forest results
| names |
period |
power |
significance |
meanSquareError |
absError |
maxError |
CRPS |
IGN |
| baseline |
winter 2016 |
0.978 |
0.000e+00 |
0.330 |
0.429 |
2.049 |
NaN |
NaN |
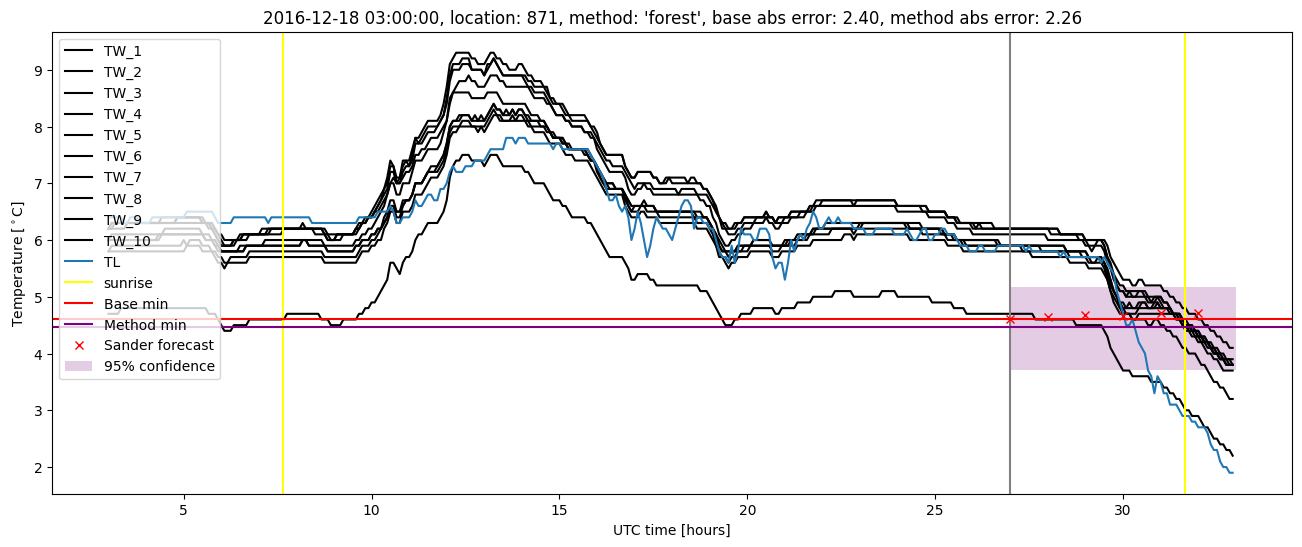
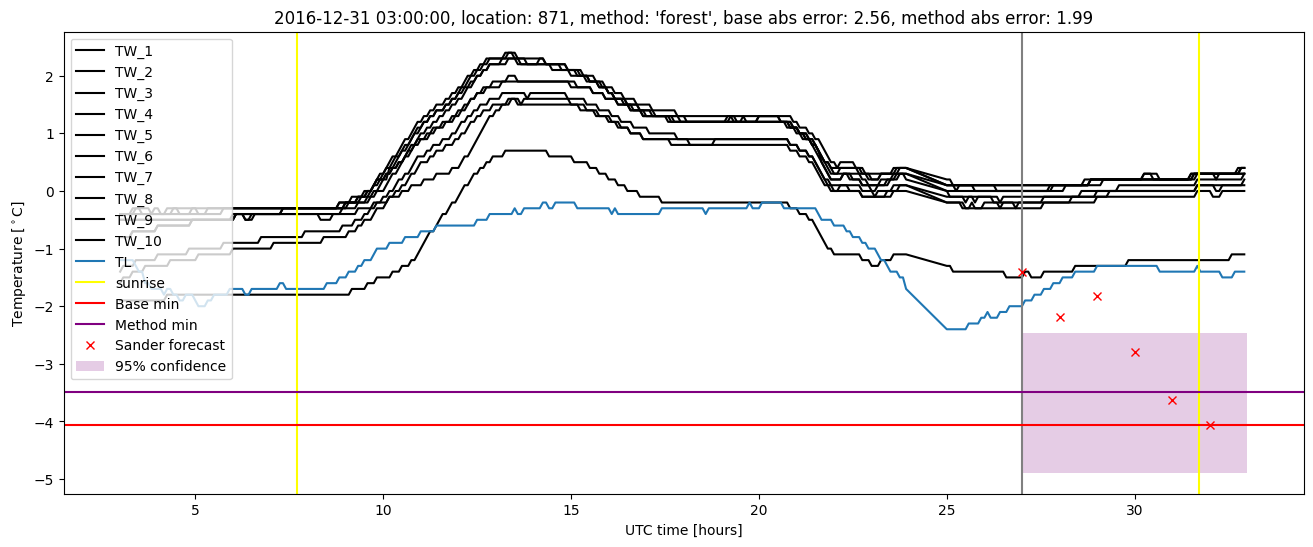
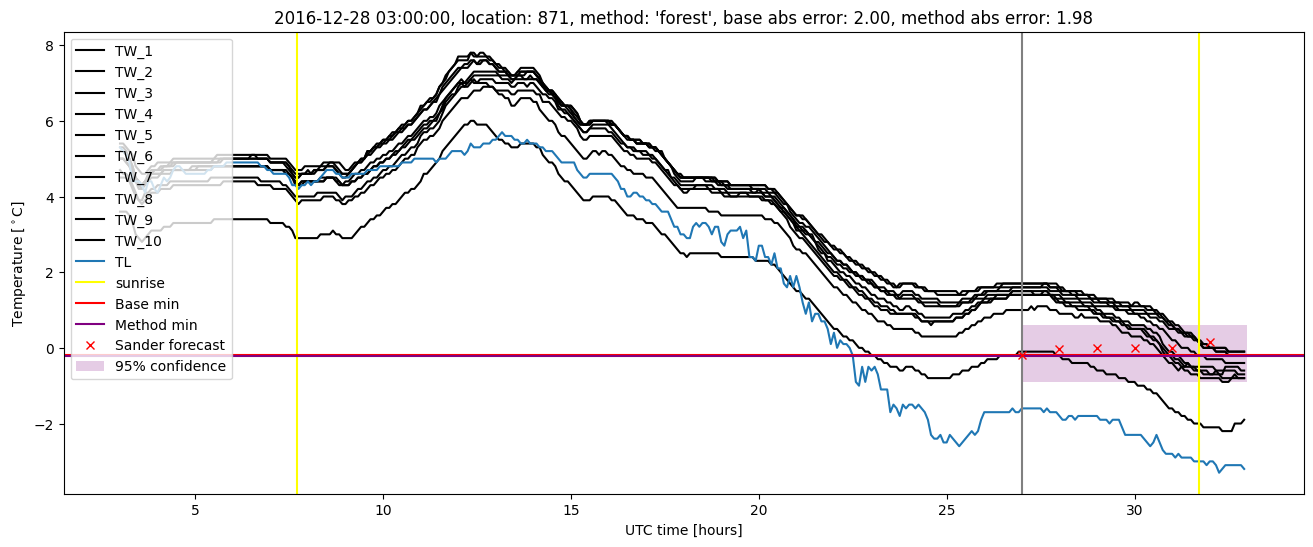
| forest |
winter 2016 |
0.983 |
0.040 |
0.279 |
0.387 |
1.819 |
0.500 |
4.743 |
| baseline |
winter 2017 |
0.991 |
0.000e+00 |
0.426 |
0.444 |
2.557 |
NaN |
NaN |
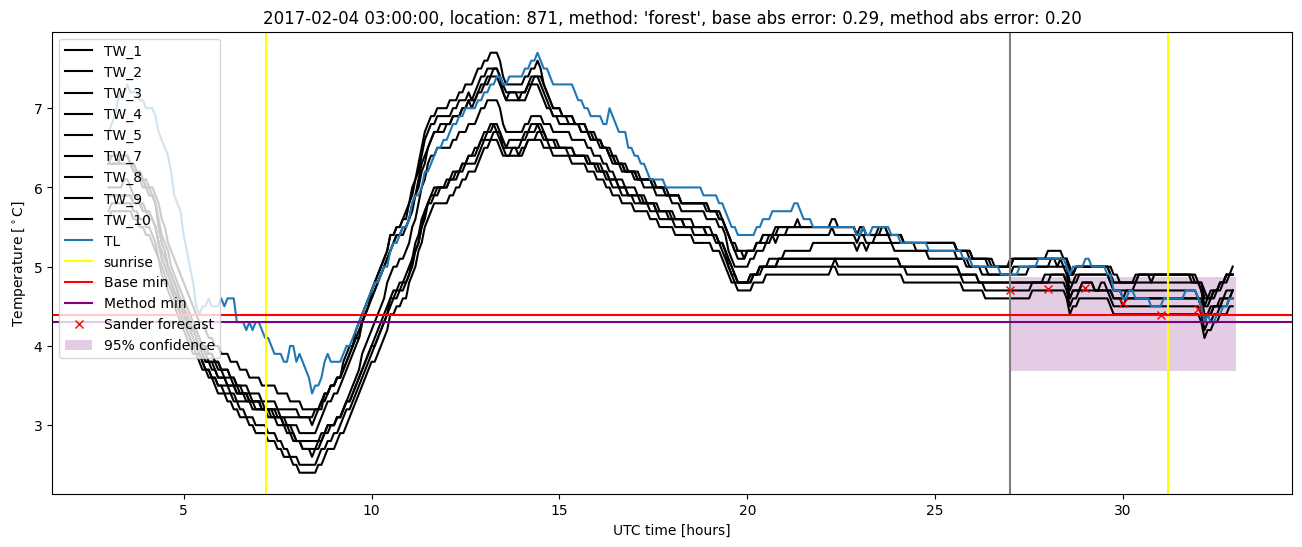
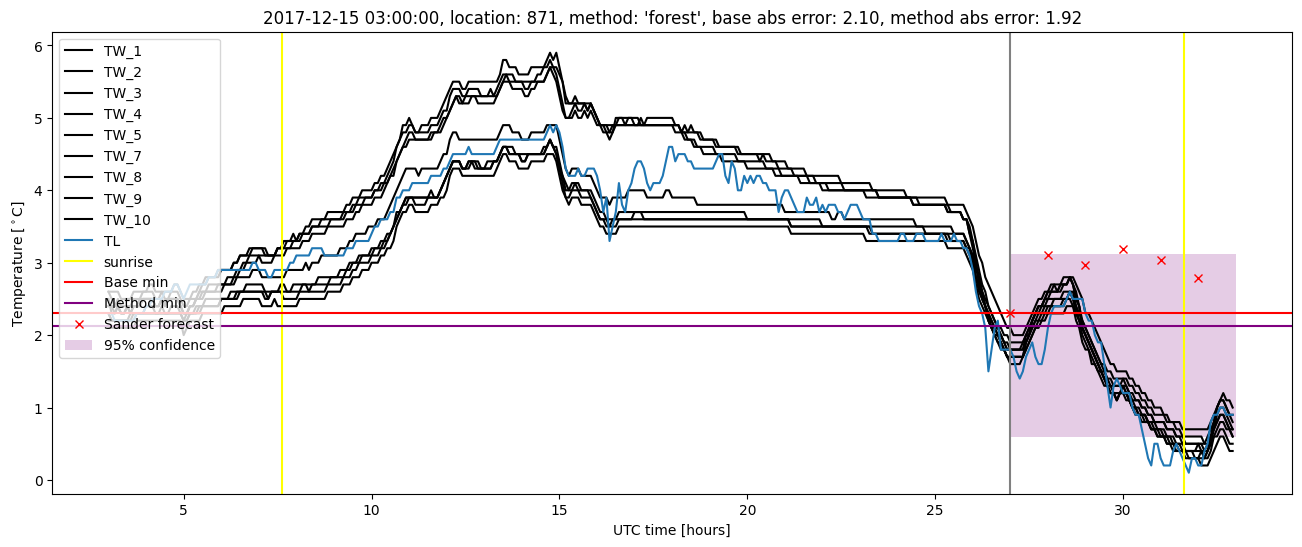
| forest |
winter 2017 |
0.991 |
0.000e+00 |
0.345 |
0.399 |
2.261 |
0.473 |
4.402 |
| baseline |
winter 2018 |
0.979 |
0.125 |
0.296 |
0.397 |
2.563 |
NaN |
NaN |
| forest |
winter 2018 |
0.993 |
0.094 |
0.265 |
0.369 |
2.422 |
0.470 |
2.969 |
| baseline |
winter 2019 |
0.963 |
0.000e+00 |
0.284 |
0.392 |
1.842 |
NaN |
NaN |
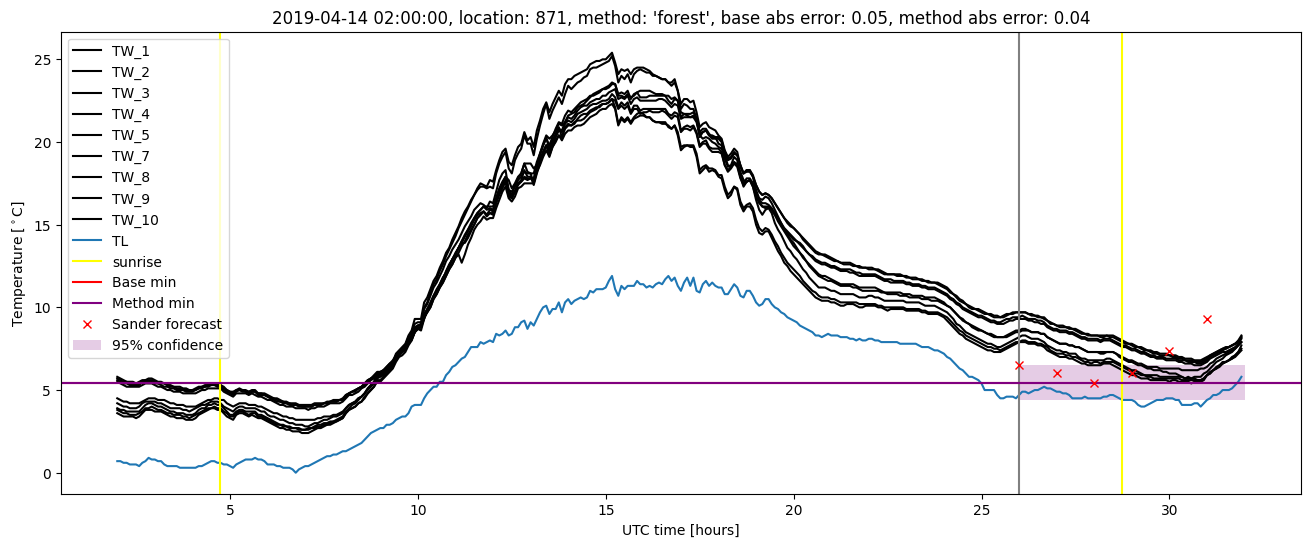
| forest |
winter 2019 |
0.972 |
0.000e+00 |
0.196 |
0.326 |
1.597 |
0.472 |
3.542 |
| baseline |
all |
0.978 |
0.036 |
0.333 |
0.417 |
2.563 |
NaN |
NaN |
| forest |
all |
0.985 |
0.036 |
0.274 |
0.373 |
2.422 |
0.481 |
3.956 |
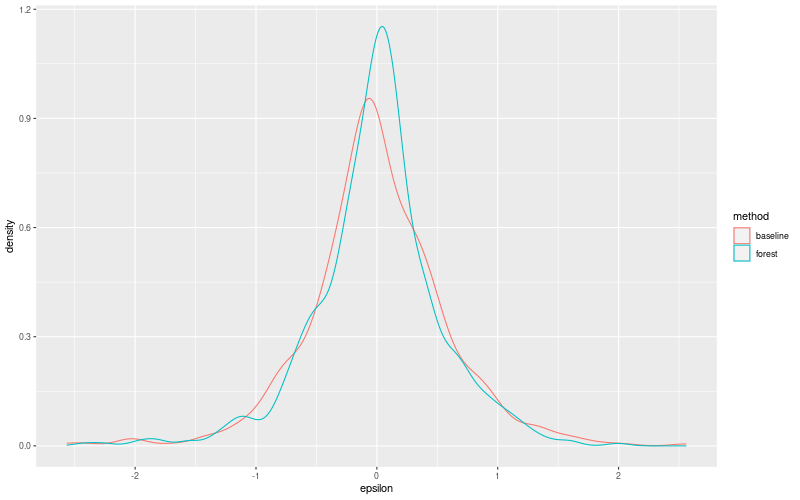
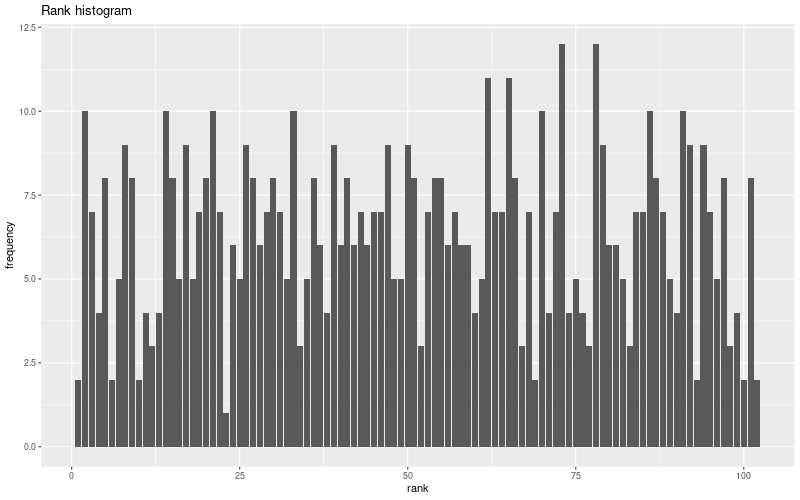
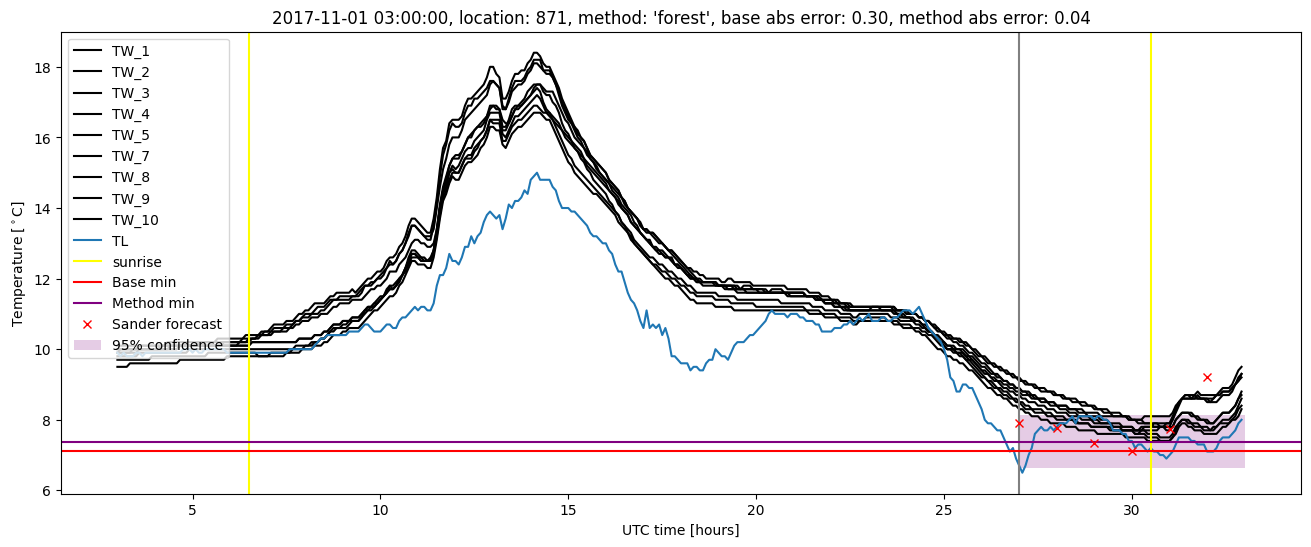
Random forest plots

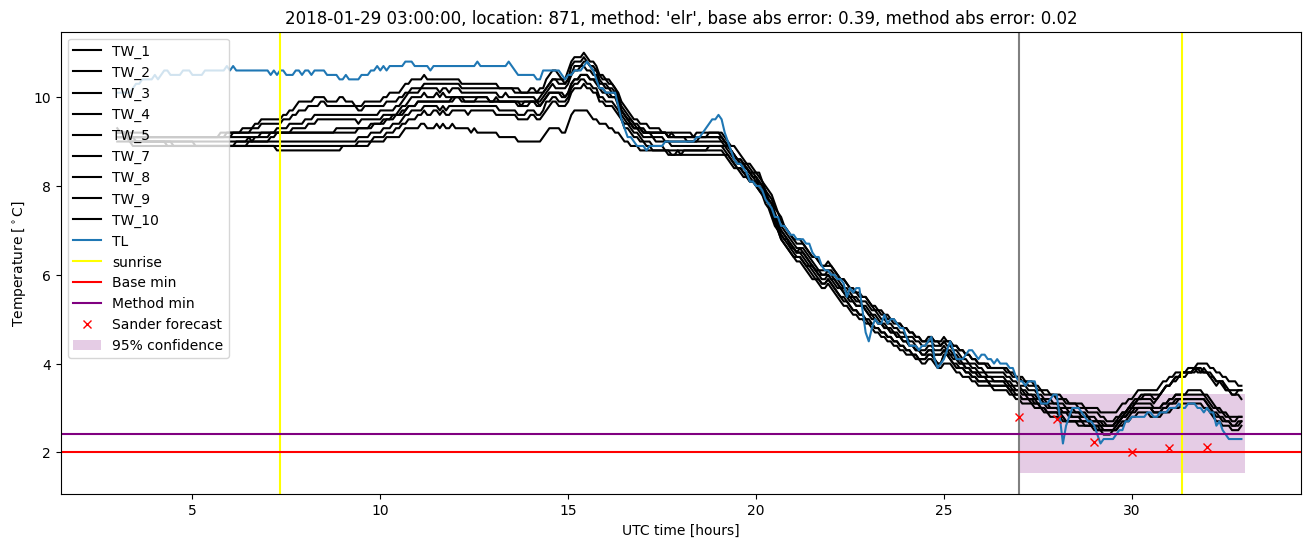
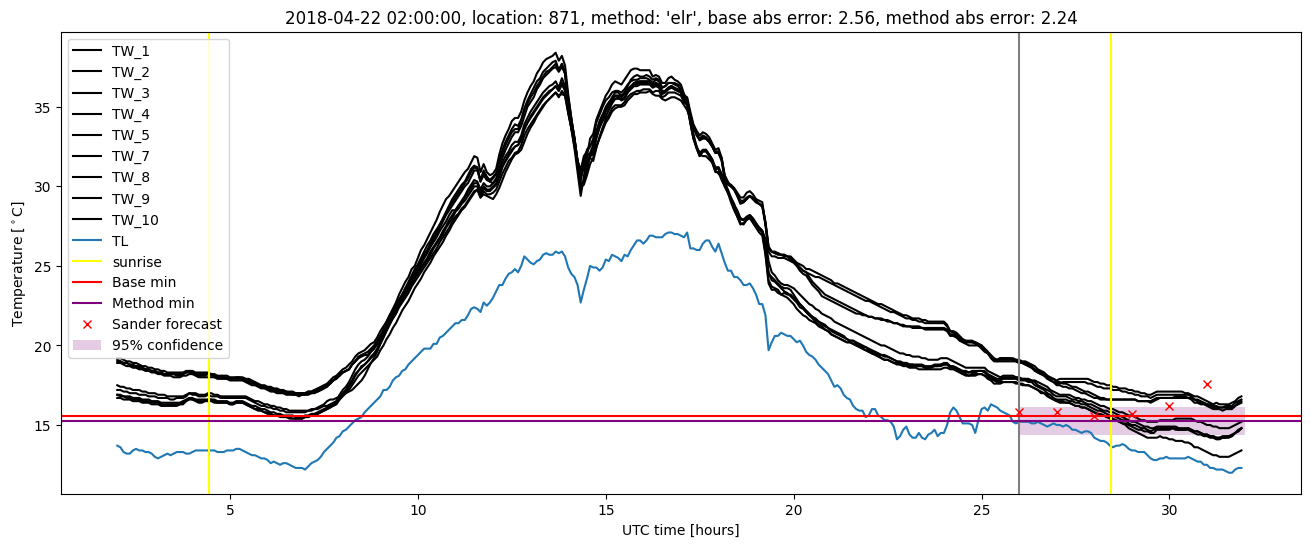
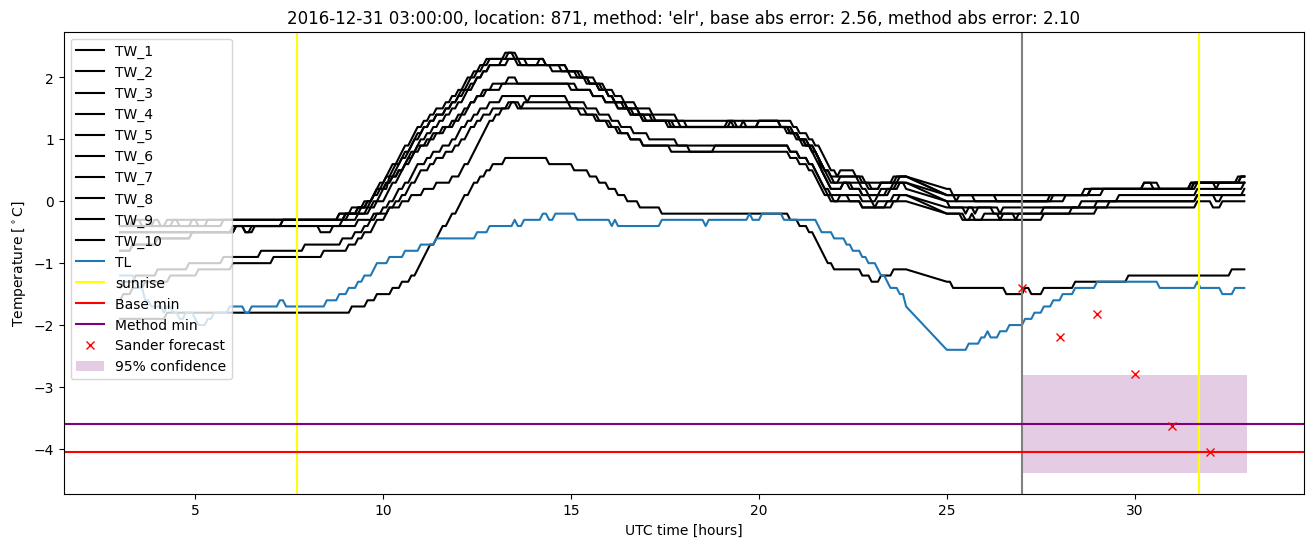
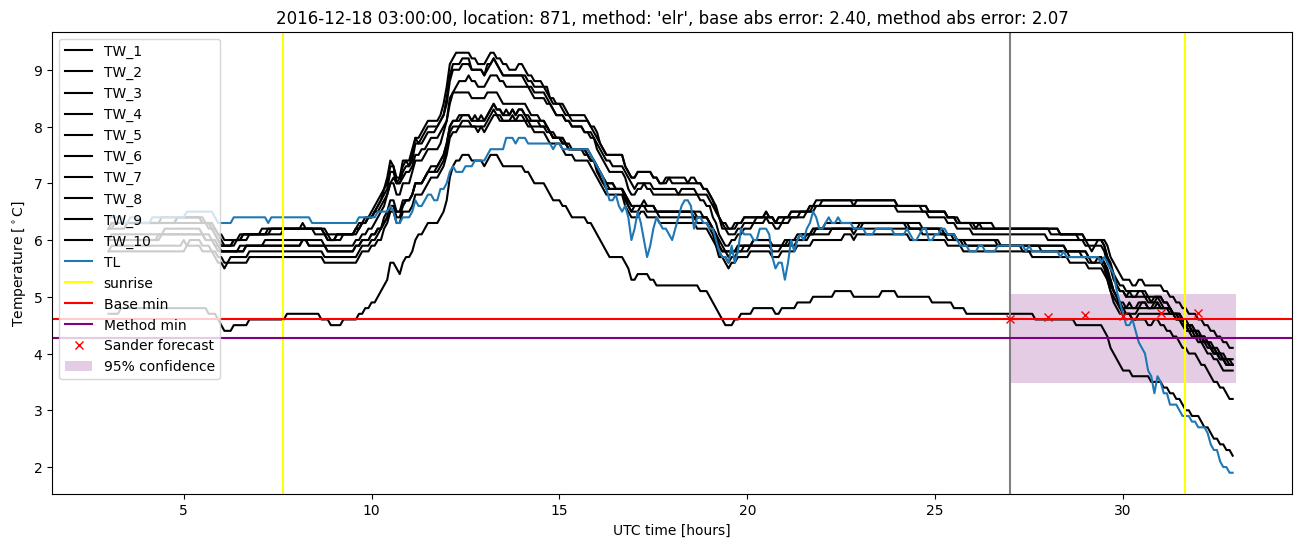
Extended logistic regression results
| names |
period |
power |
significance |
meanSquareError |
absError |
maxError |
CRPS |
IGN |
| baseline |
winter 2016 |
0.978 |
0.000e+00 |
0.330 |
0.429 |
2.049 |
NaN |
NaN |
| elr |
winter 2016 |
0.983 |
0.000e+00 |
0.301 |
0.418 |
1.947 |
0.576 |
6.688 |
| baseline |
winter 2017 |
0.991 |
0.000e+00 |
0.426 |
0.444 |
2.557 |
NaN |
NaN |
| elr |
winter 2017 |
0.981 |
0.000e+00 |
0.353 |
0.426 |
2.103 |
0.554 |
6.657 |
| baseline |
winter 2018 |
0.979 |
0.125 |
0.296 |
0.397 |
2.563 |
NaN |
NaN |
| elr |
winter 2018 |
0.993 |
0.094 |
0.249 |
0.368 |
2.236 |
0.519 |
3.881 |
| baseline |
winter 2019 |
0.963 |
0.000e+00 |
0.284 |
0.392 |
1.842 |
NaN |
NaN |
| elr |
winter 2019 |
0.982 |
0.000e+00 |
0.212 |
0.360 |
1.592 |
0.512 |
3.681 |
| baseline |
all |
0.978 |
0.036 |
0.333 |
0.417 |
2.563 |
NaN |
NaN |
| elr |
all |
0.985 |
0.027 |
0.281 |
0.395 |
2.236 |
0.543 |
5.343 |
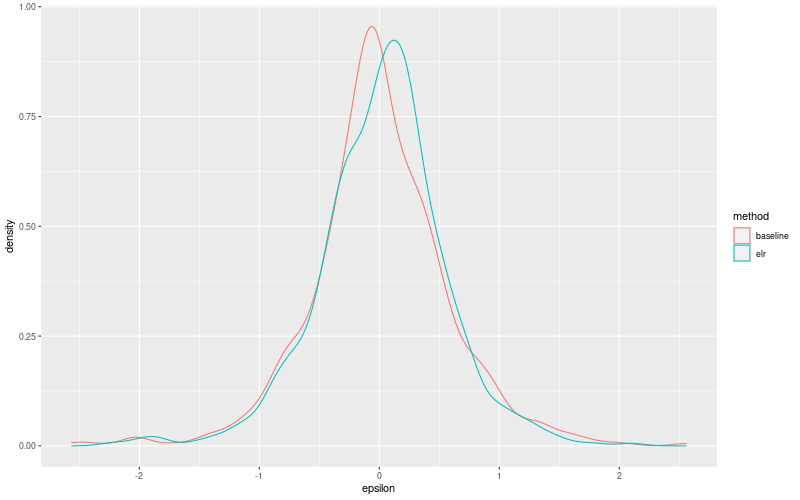
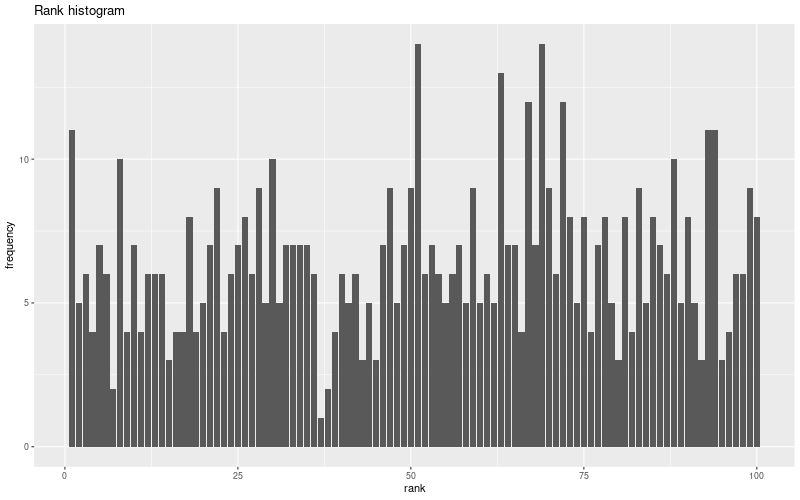
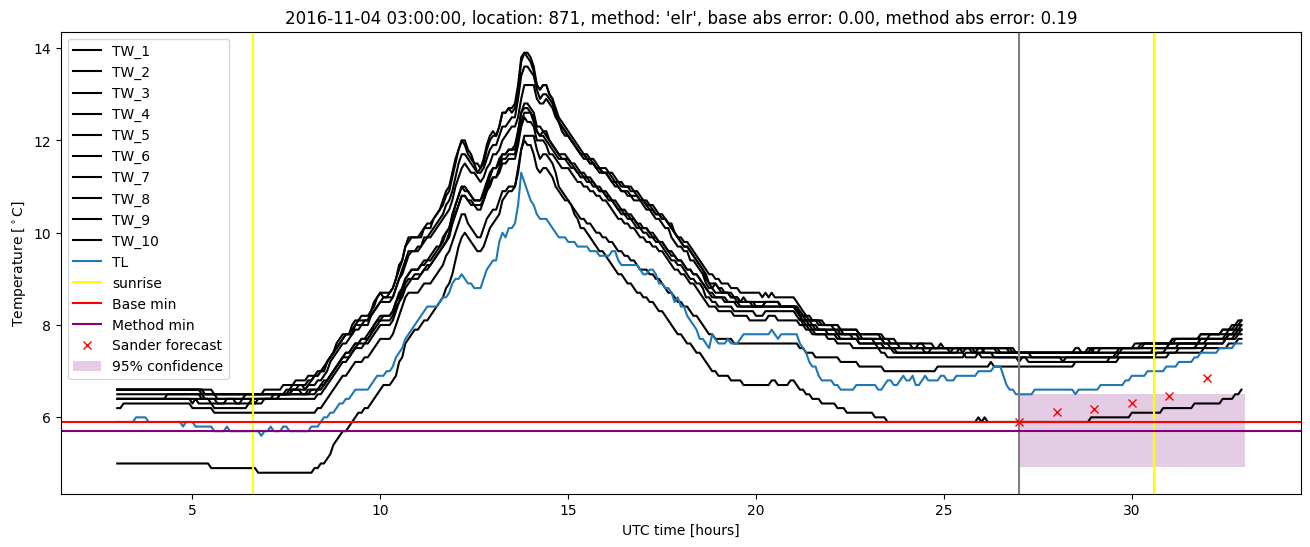
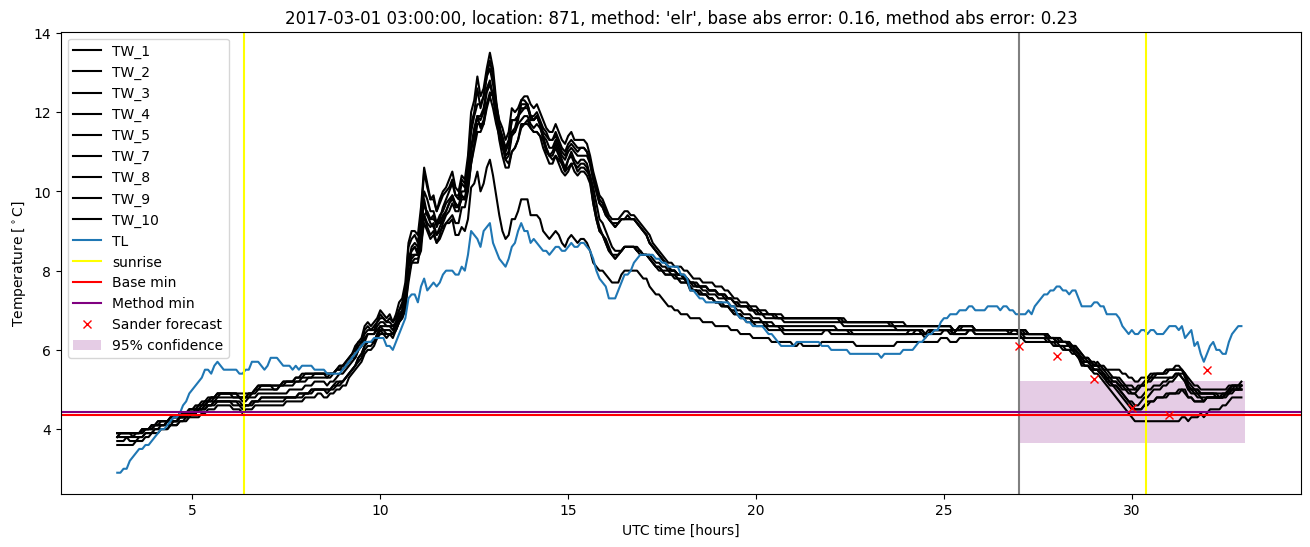
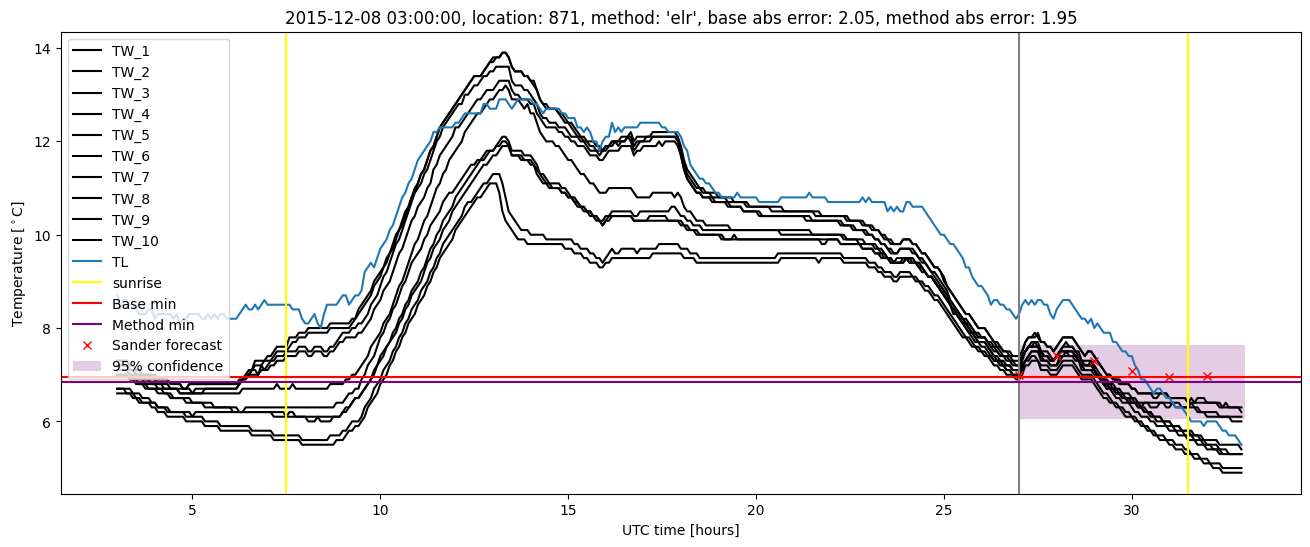
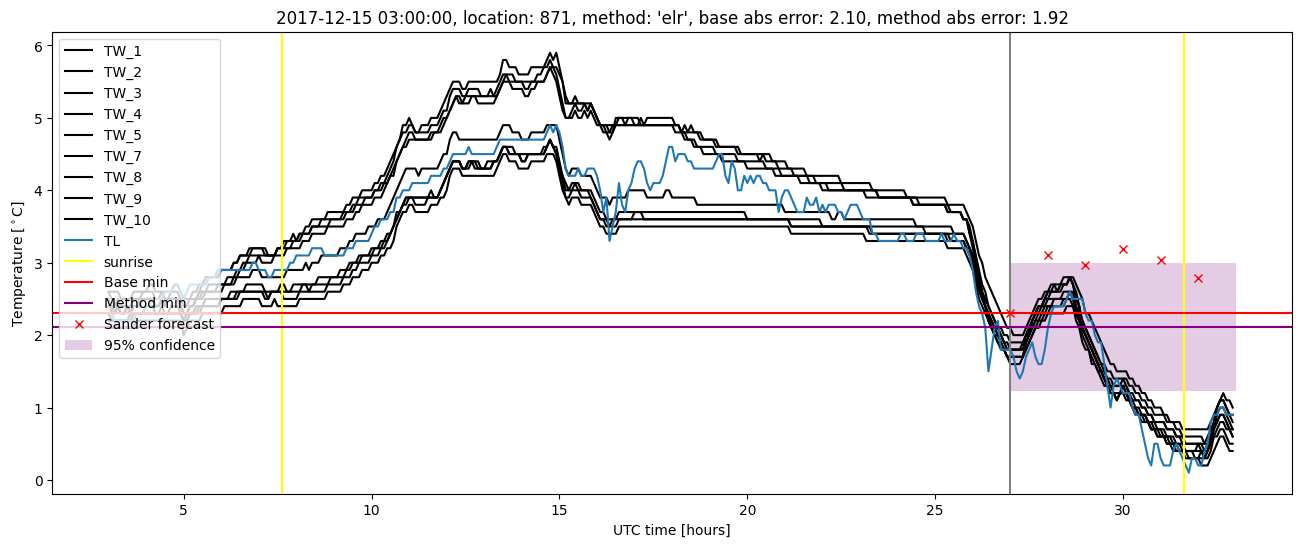
Extended logistic regression plots