GMS location: 870
Random forest results
| names |
period |
power |
significance |
meanSquareError |
absError |
maxError |
CRPS |
IGN |
| baseline |
winter 2016 |
0.983 |
0.000e+00 |
0.377 |
0.467 |
2.249 |
NaN |
NaN |
| forest |
winter 2016 |
0.983 |
0.071 |
0.306 |
0.403 |
2.103 |
0.440 |
2.611 |
| baseline |
winter 2017 |
0.959 |
0.067 |
0.352 |
0.431 |
2.288 |
NaN |
NaN |
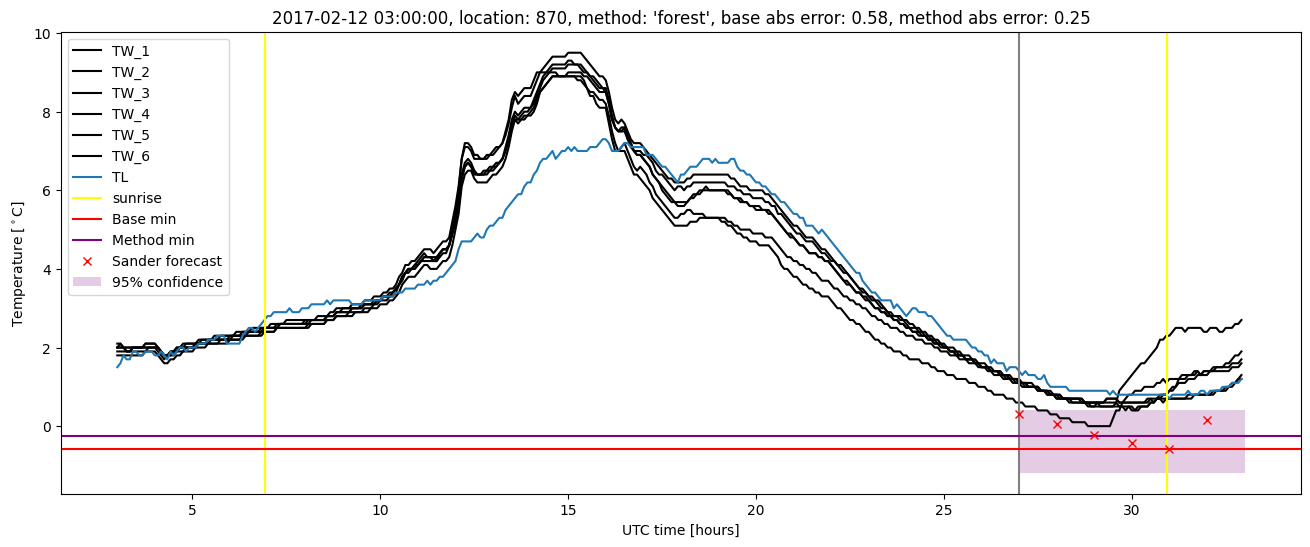
| forest |
winter 2017 |
0.959 |
0.067 |
0.249 |
0.356 |
2.665 |
0.430 |
2.628 |
| baseline |
winter 2018 |
0.981 |
0.091 |
0.507 |
0.540 |
2.435 |
NaN |
NaN |
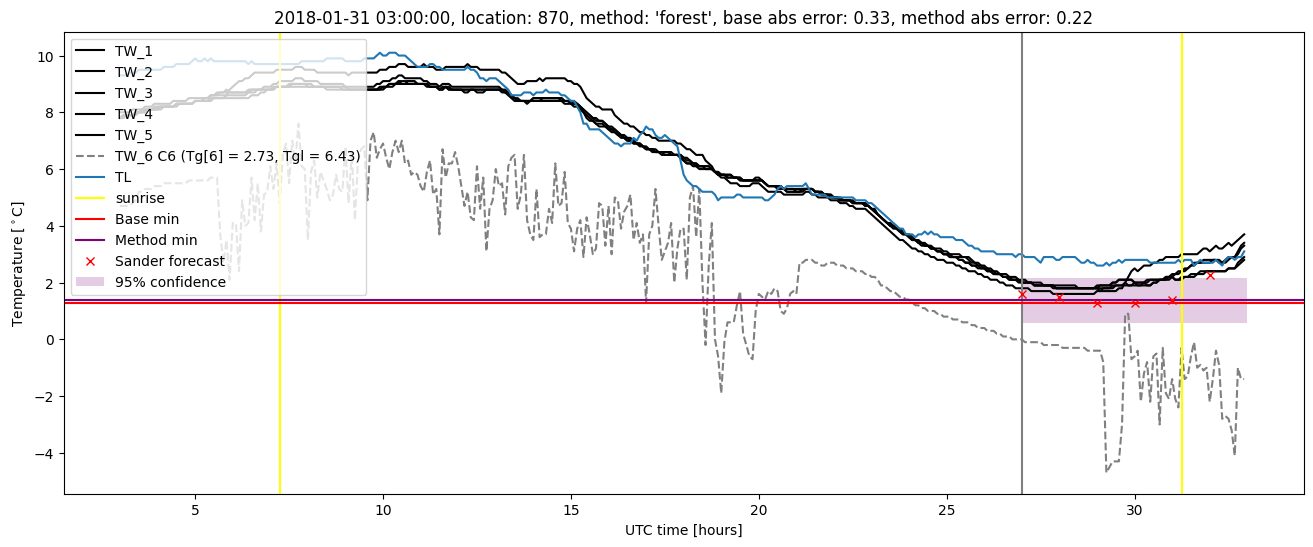
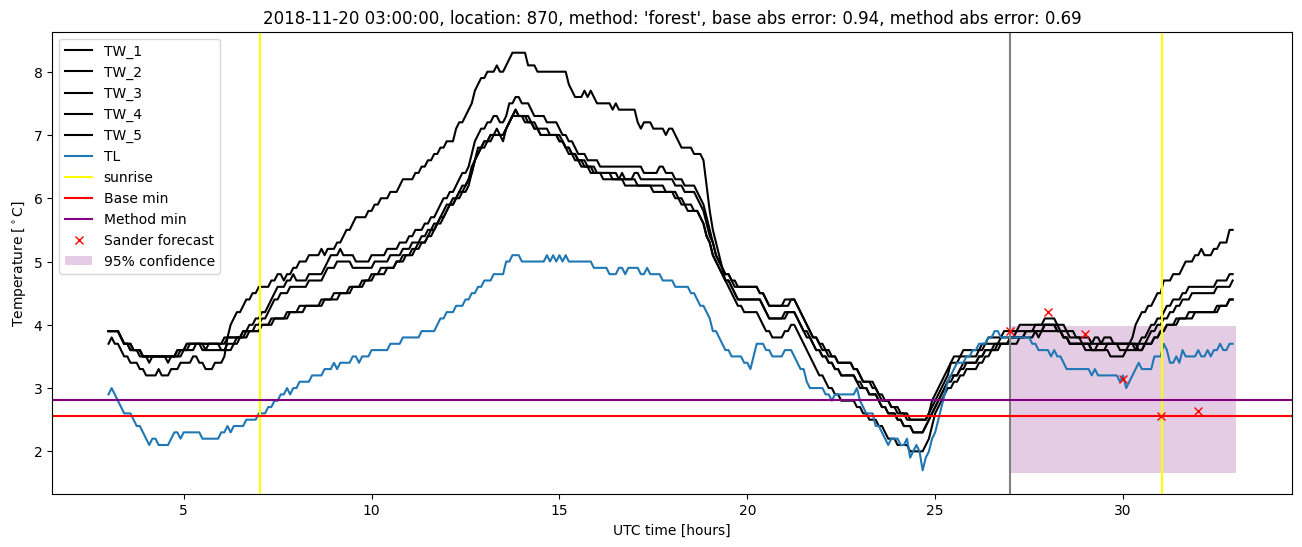
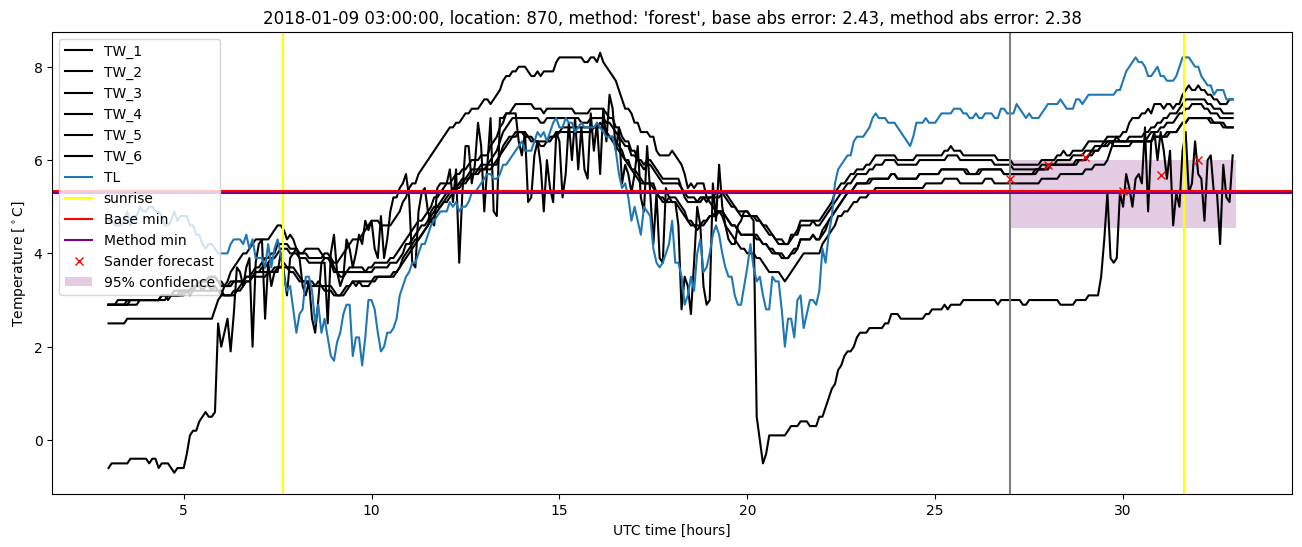
| forest |
winter 2018 |
0.987 |
0.045 |
0.402 |
0.463 |
2.384 |
0.427 |
3.379 |
| baseline |
winter 2019 |
0.980 |
0.071 |
0.322 |
0.414 |
2.231 |
NaN |
NaN |
| forest |
winter 2019 |
1.000 |
0.071 |
0.226 |
0.348 |
1.995 |
0.407 |
1.904 |
| baseline |
all |
0.977 |
0.062 |
0.392 |
0.466 |
2.435 |
NaN |
NaN |
| forest |
all |
0.984 |
0.062 |
0.299 |
0.395 |
2.665 |
0.427 |
2.646 |
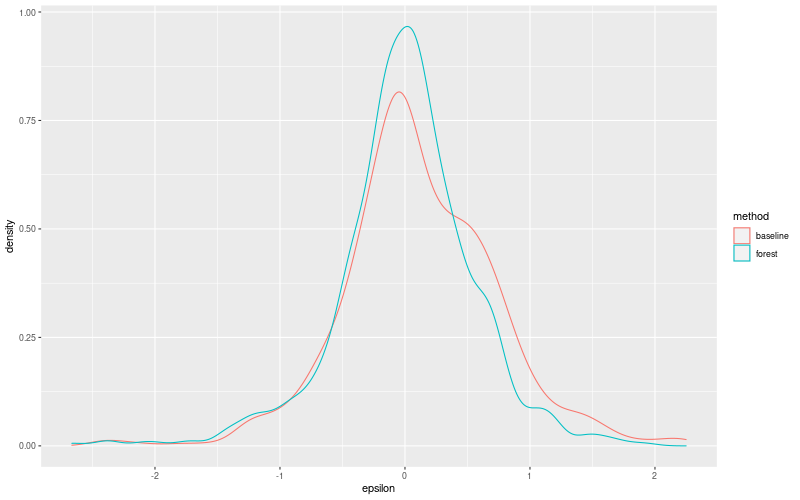
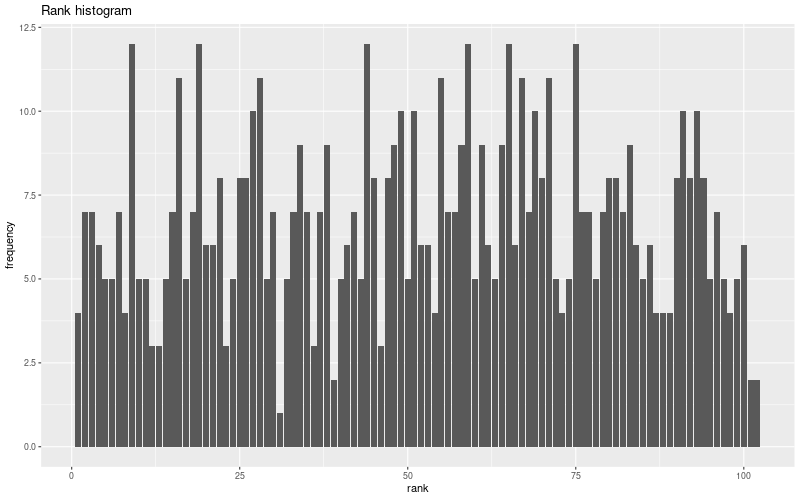
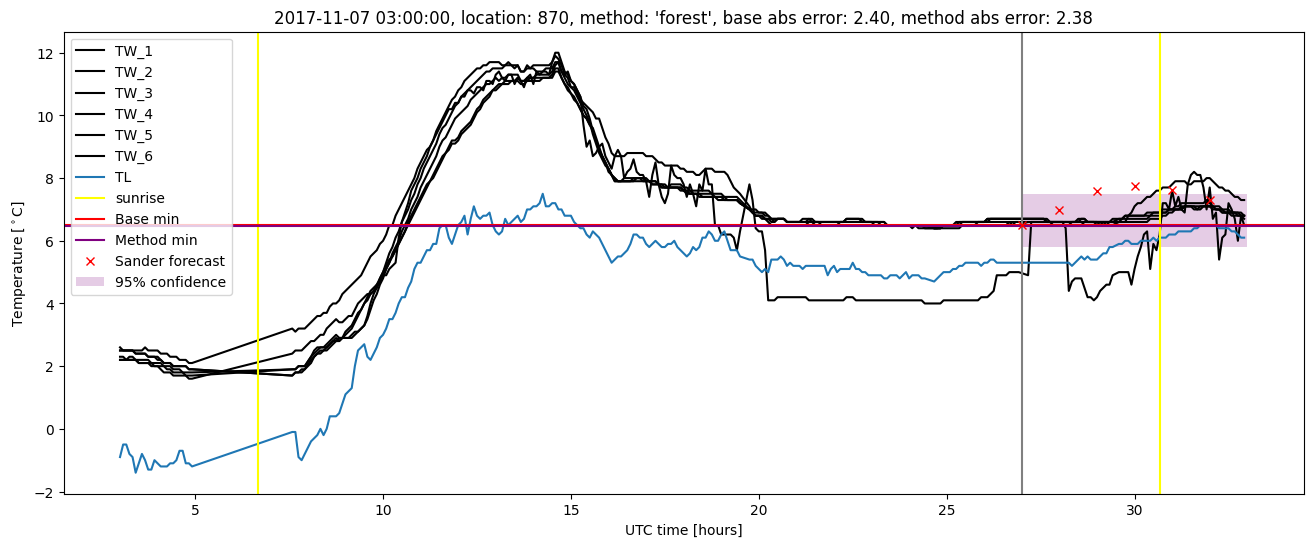
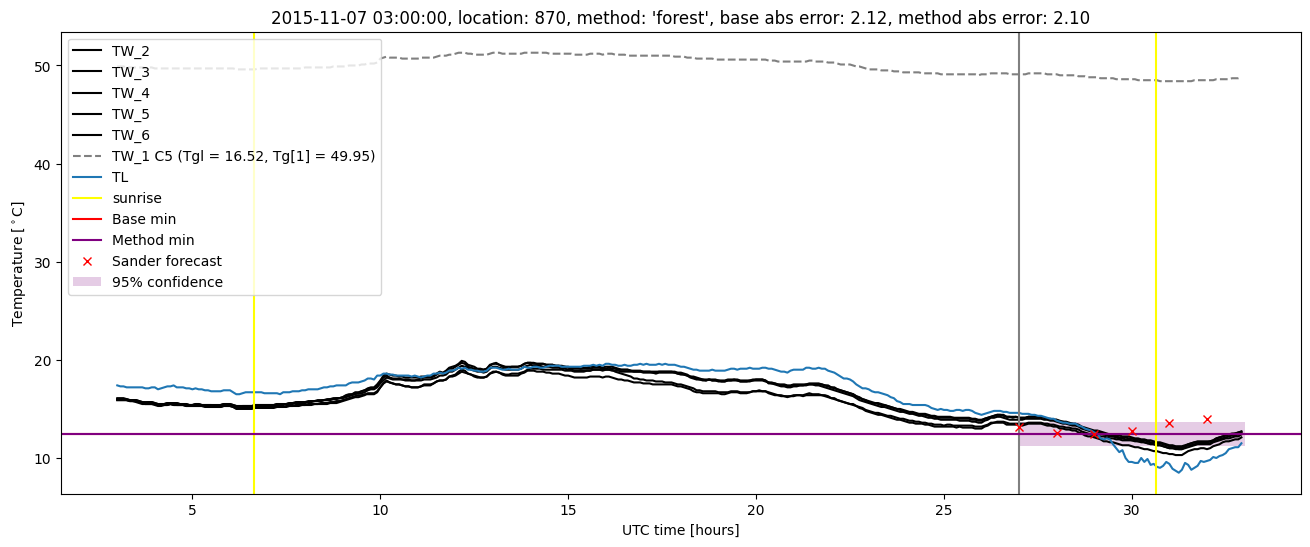
Random forest plots


Extended logistic regression results
| names |
period |
power |
significance |
meanSquareError |
absError |
maxError |
CRPS |
IGN |
| baseline |
winter 2016 |
0.983 |
0.000e+00 |
0.377 |
0.467 |
2.249 |
NaN |
NaN |
| elr |
winter 2016 |
0.977 |
0.071 |
0.345 |
0.435 |
2.214 |
0.537 |
4.724 |
| baseline |
winter 2017 |
0.959 |
0.067 |
0.352 |
0.431 |
2.288 |
NaN |
NaN |
| elr |
winter 2017 |
0.976 |
0.067 |
0.256 |
0.388 |
2.517 |
0.520 |
3.642 |
| baseline |
winter 2018 |
0.981 |
0.091 |
0.507 |
0.540 |
2.435 |
NaN |
NaN |
| elr |
winter 2018 |
0.981 |
0.091 |
0.402 |
0.470 |
2.372 |
0.497 |
4.364 |
| baseline |
winter 2019 |
0.980 |
0.071 |
0.322 |
0.414 |
2.231 |
NaN |
NaN |
| elr |
winter 2019 |
1.000 |
0.071 |
0.267 |
0.373 |
1.959 |
0.460 |
3.004 |
| baseline |
all |
0.977 |
0.062 |
0.392 |
0.466 |
2.435 |
NaN |
NaN |
| elr |
all |
0.984 |
0.075 |
0.322 |
0.419 |
2.517 |
0.504 |
3.978 |
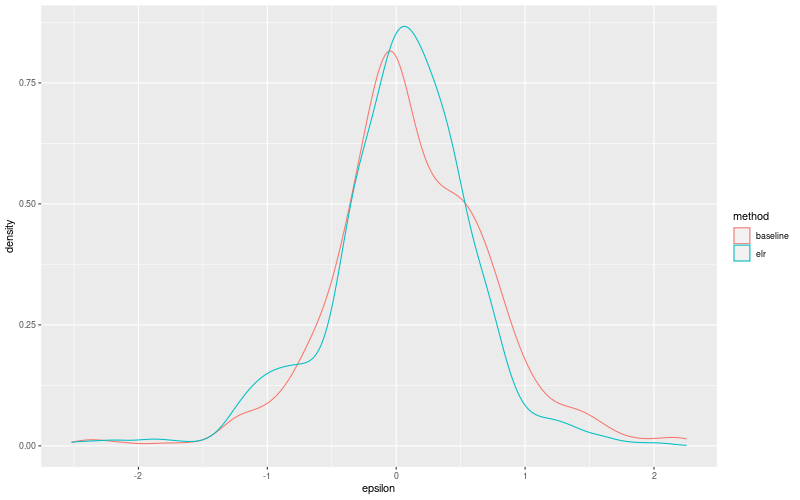
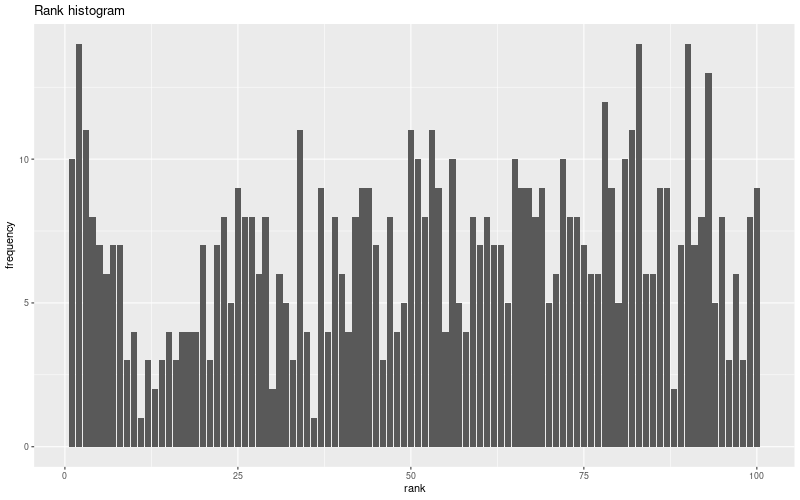
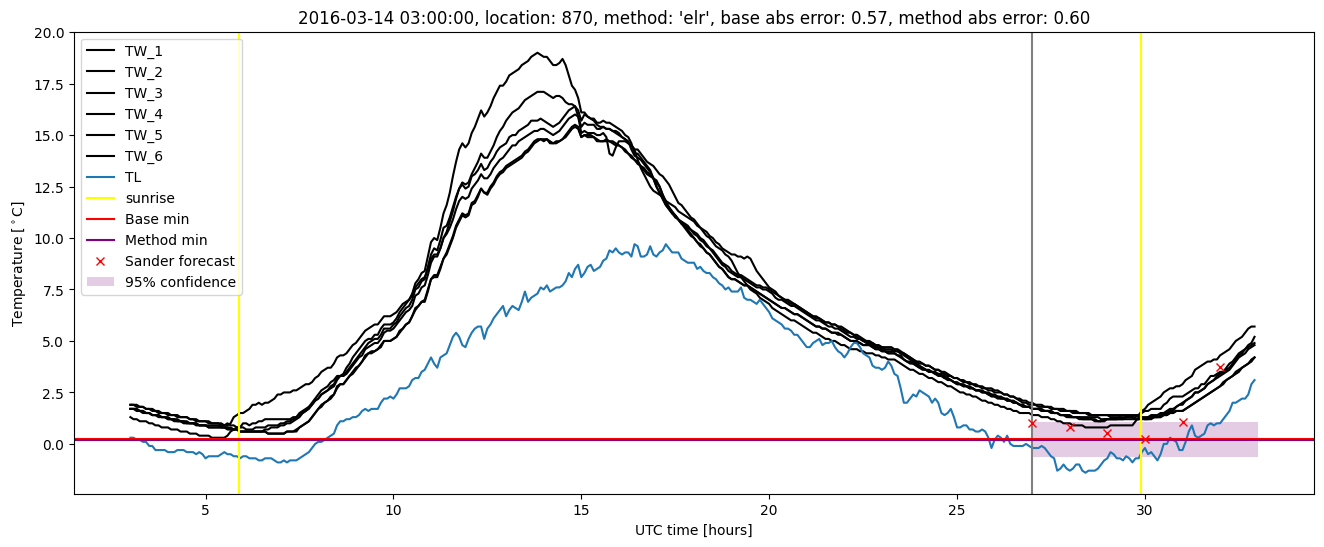
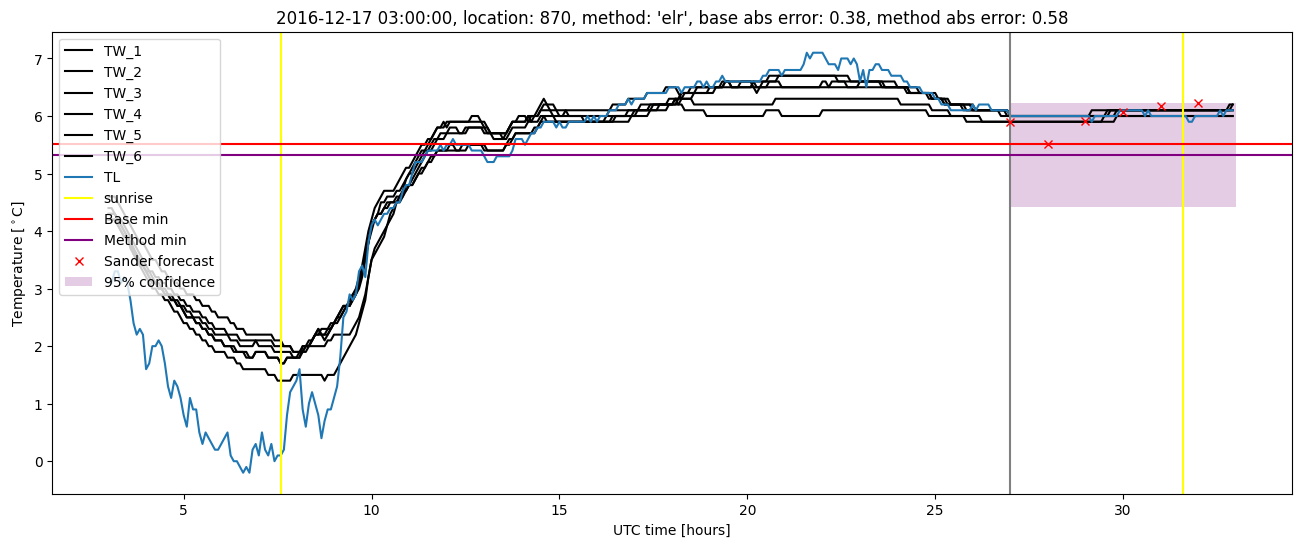
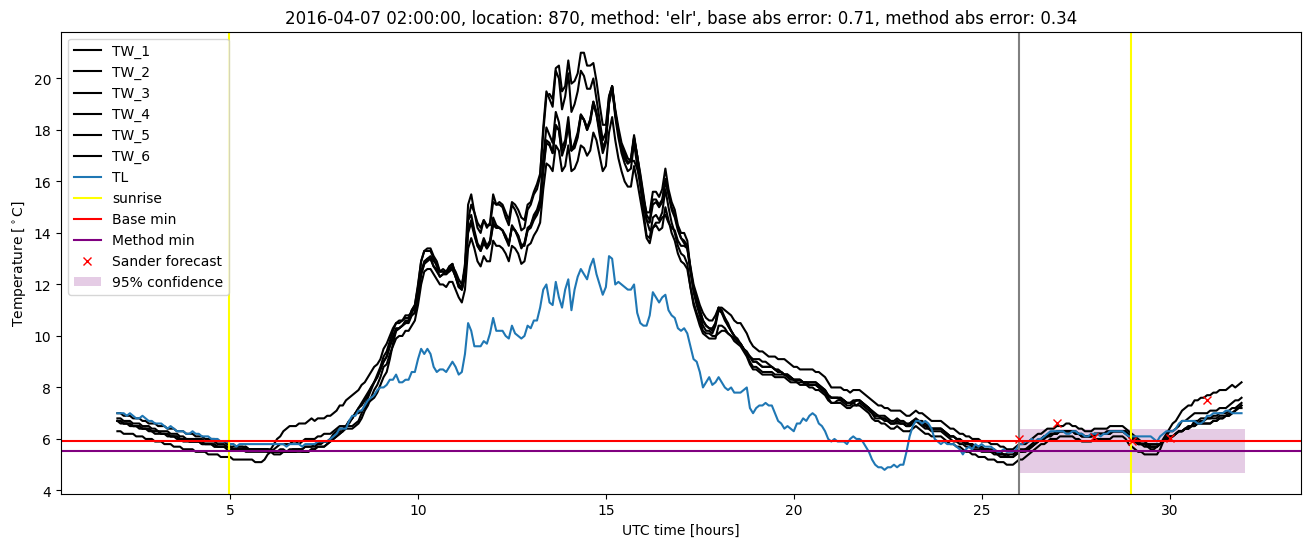
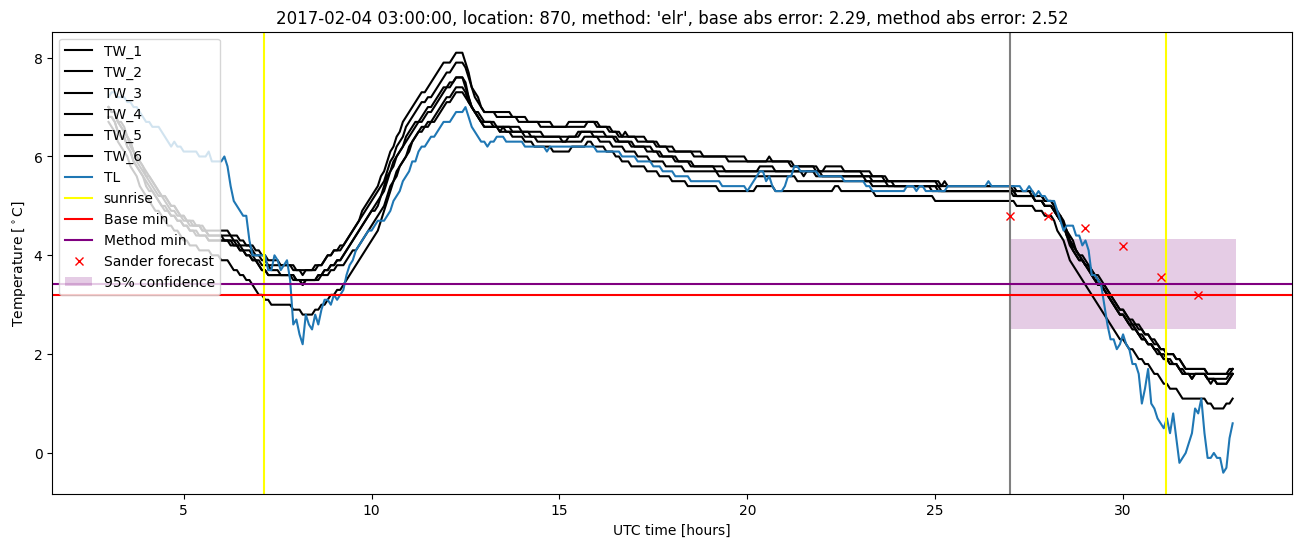
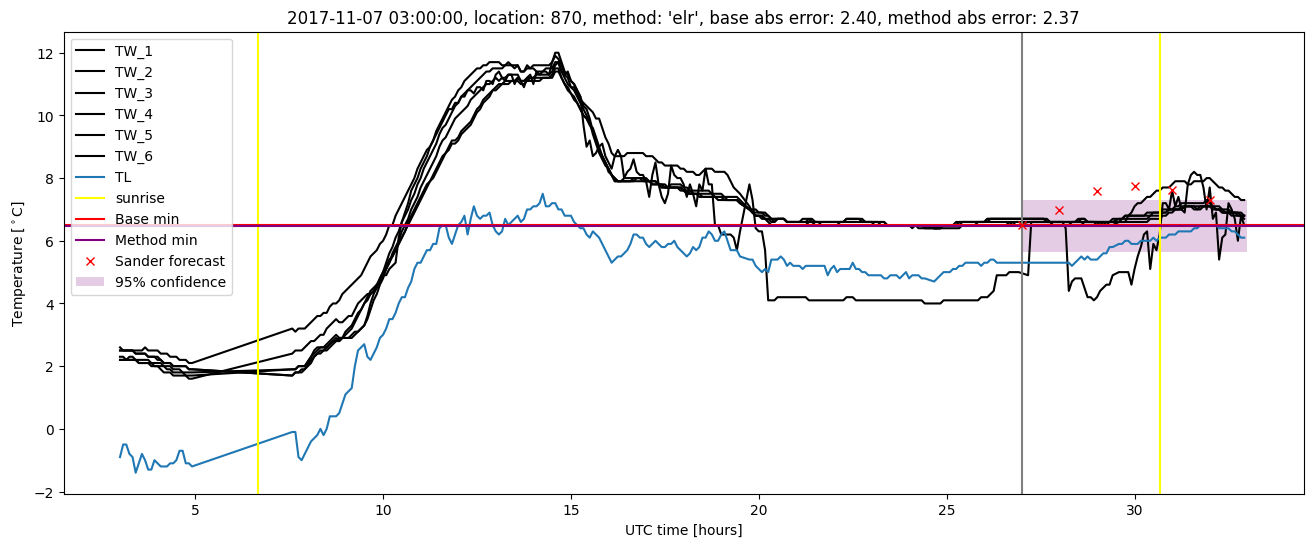
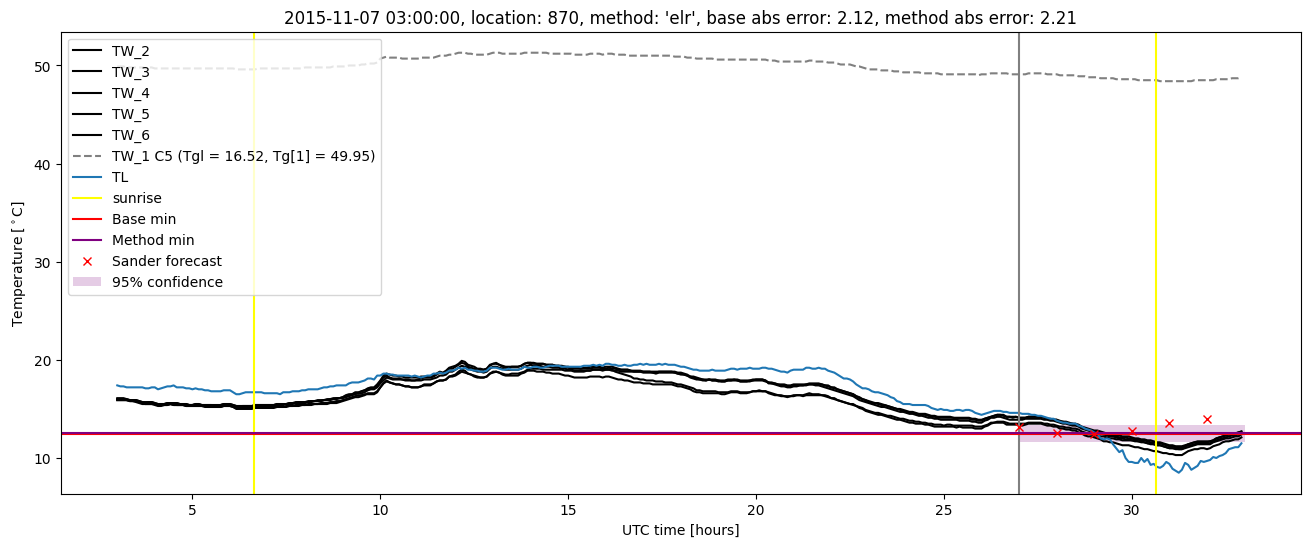
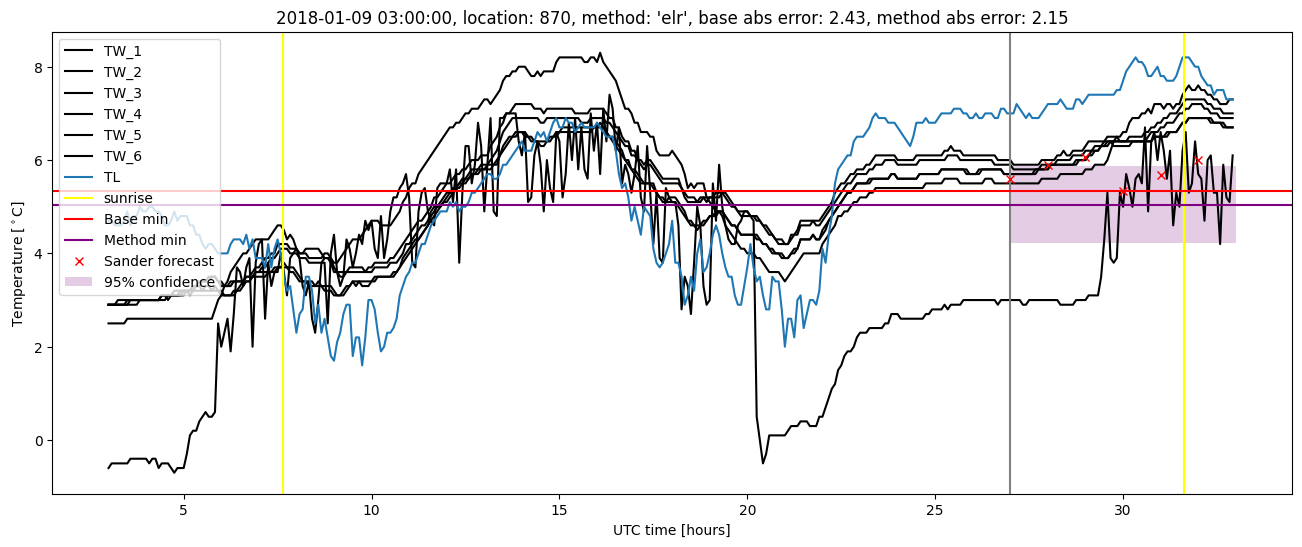
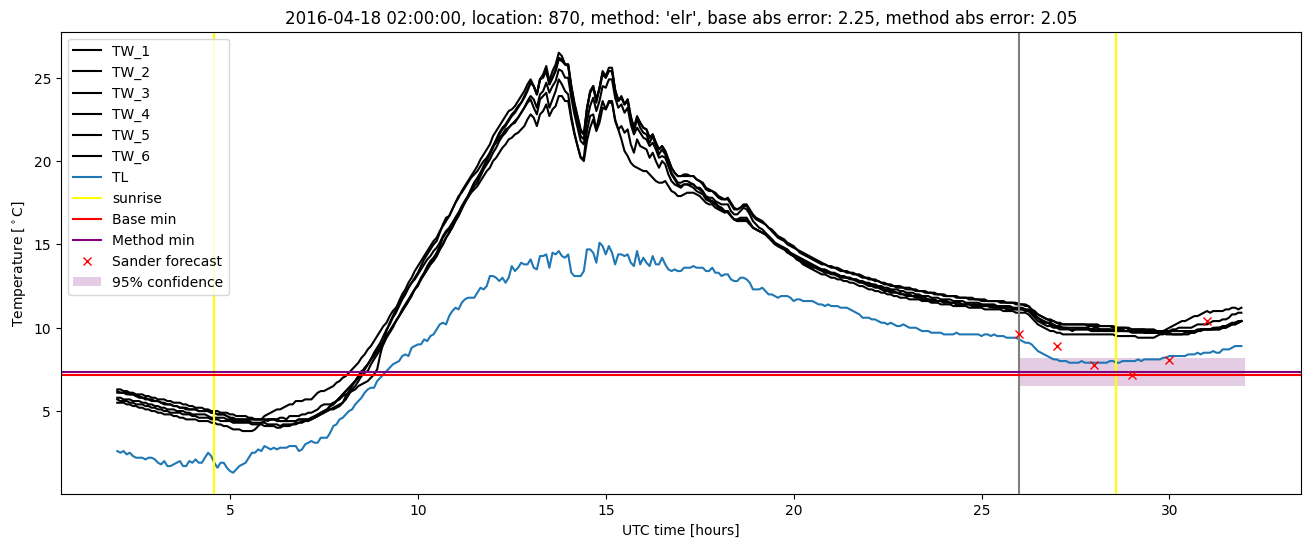
Extended logistic regression plots