GMS location: 853
Random forest results
| names |
period |
power |
significance |
meanSquareError |
absError |
maxError |
CRPS |
IGN |
| baseline |
winter 2016 |
0.979 |
0.067 |
0.369 |
0.439 |
2.087 |
NaN |
NaN |
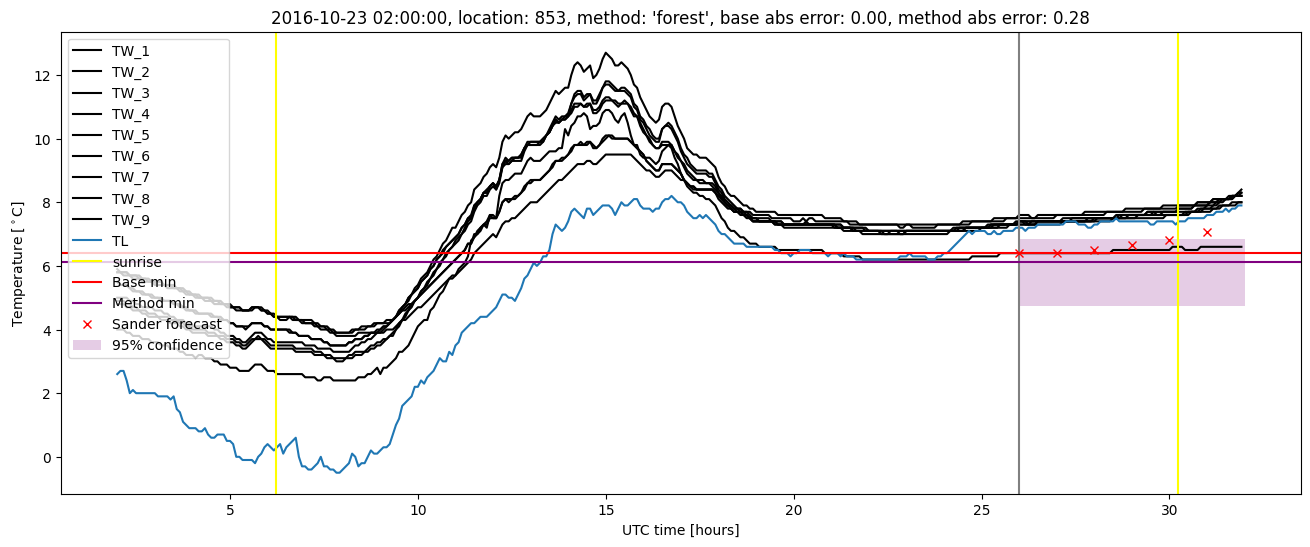
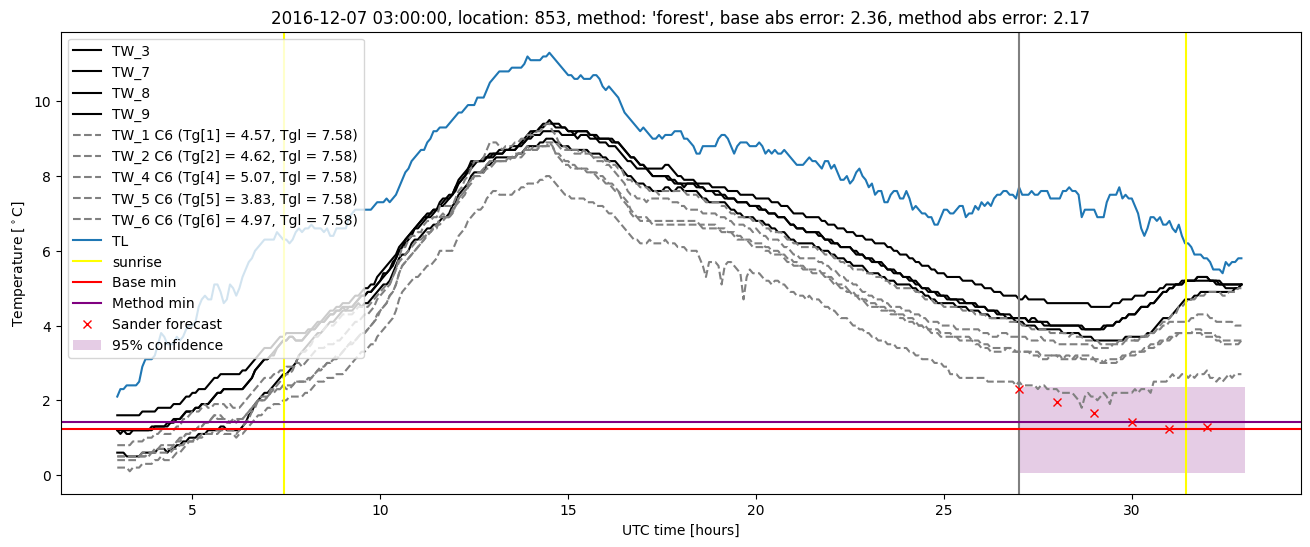
| forest |
winter 2016 |
0.995 |
0.000e+00 |
0.310 |
0.406 |
1.959 |
0.424 |
1.731 |
| baseline |
winter 2017 |
0.974 |
0.075 |
0.409 |
0.461 |
2.828 |
NaN |
NaN |
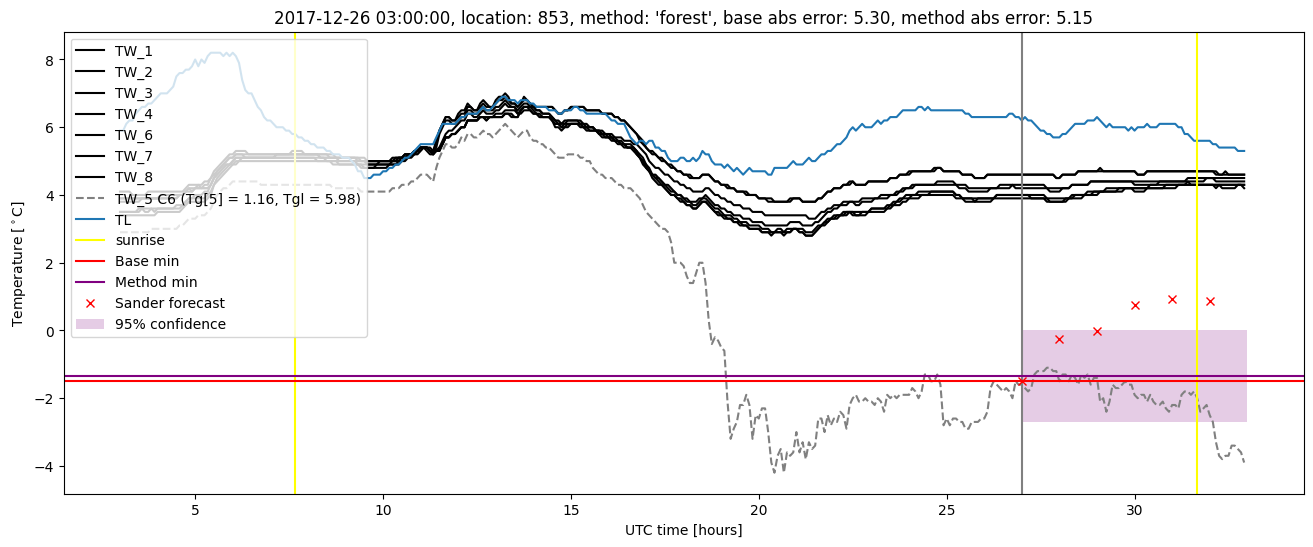
| forest |
winter 2017 |
0.982 |
0.125 |
0.342 |
0.436 |
2.174 |
0.425 |
1.756 |
| baseline |
winter 2018 |
0.961 |
0.094 |
0.708 |
0.580 |
5.298 |
NaN |
NaN |
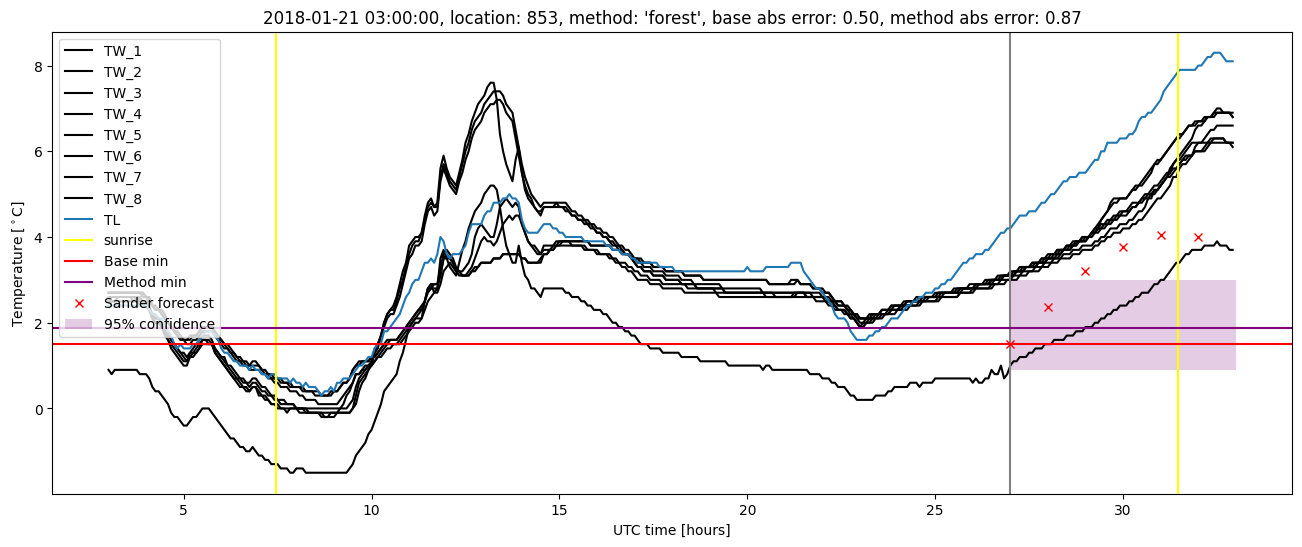
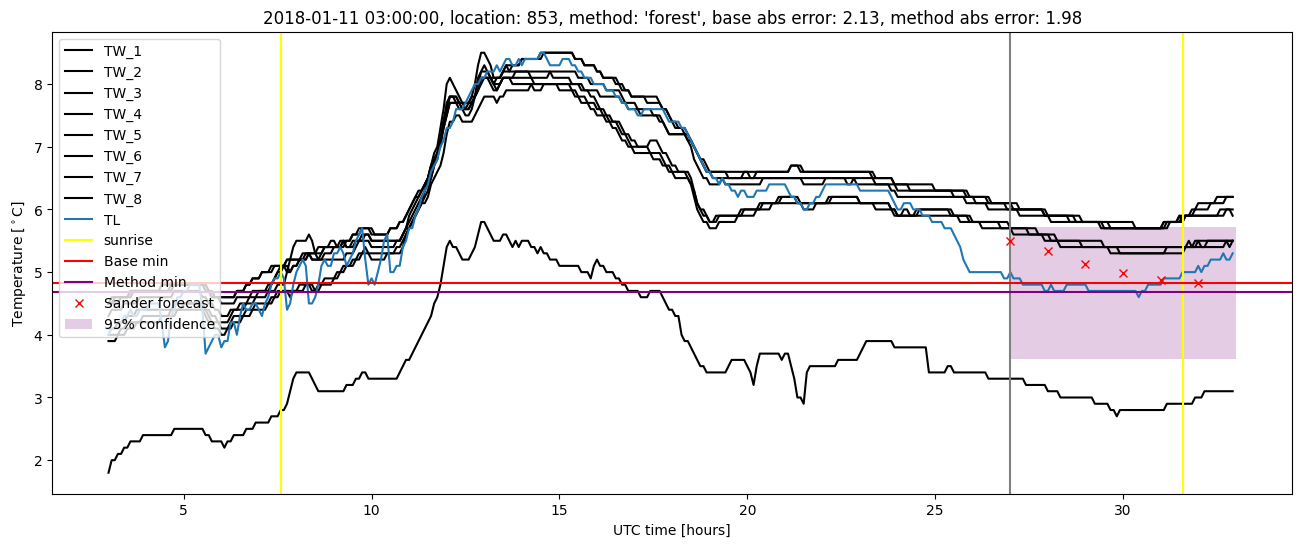
| forest |
winter 2018 |
0.967 |
0.094 |
0.572 |
0.499 |
5.149 |
0.406 |
1.704 |
| baseline |
winter 2019 |
0.986 |
0.000e+00 |
0.445 |
0.475 |
2.466 |
NaN |
NaN |
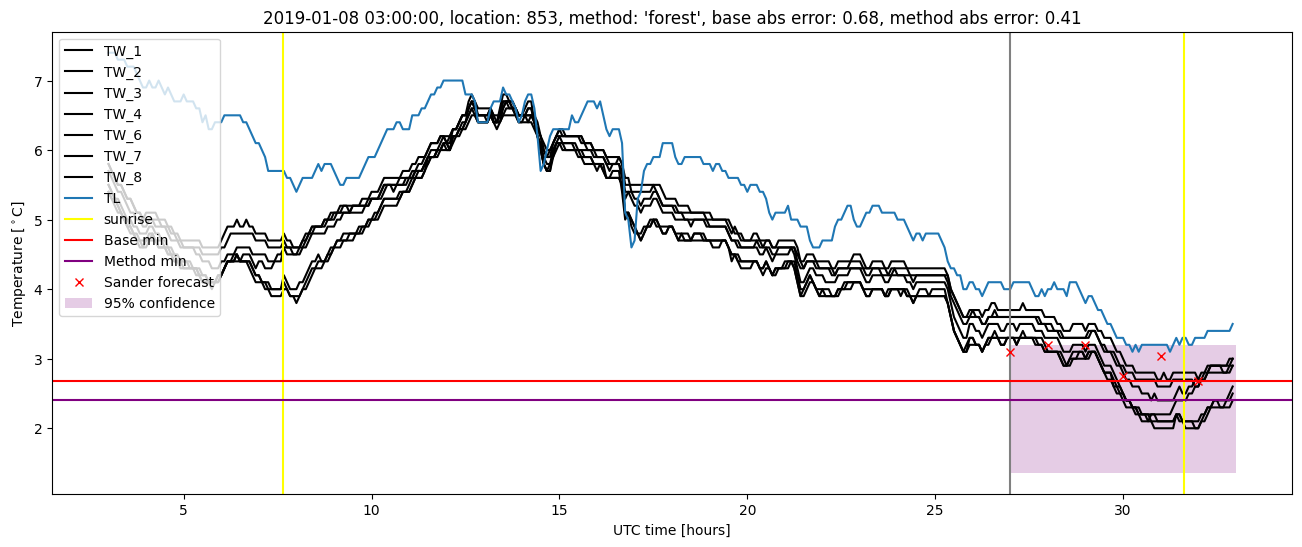
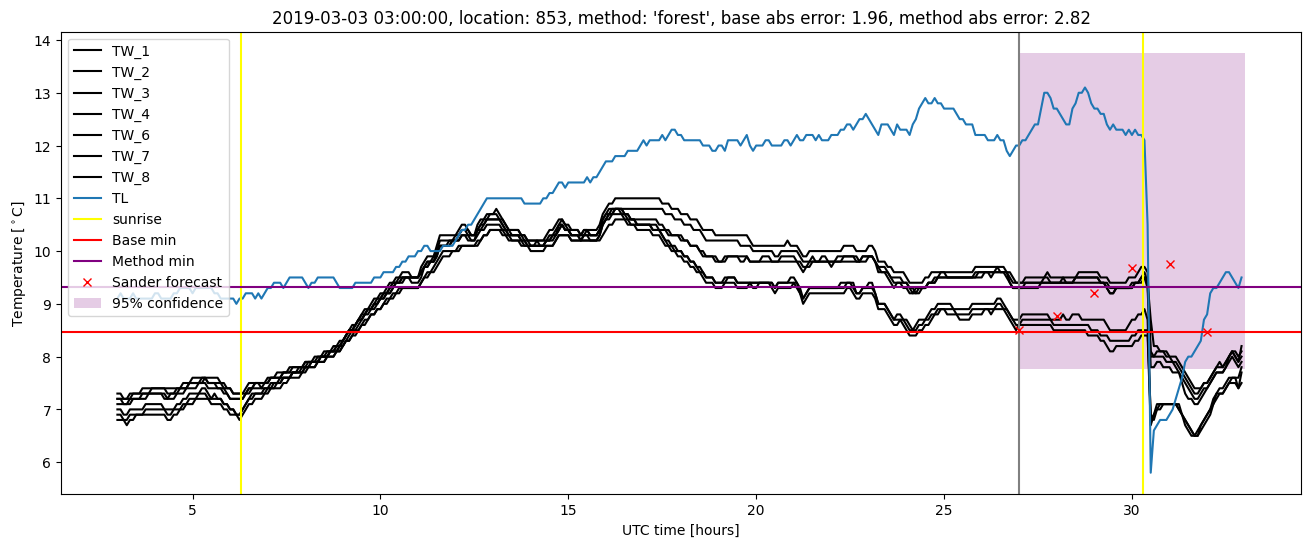
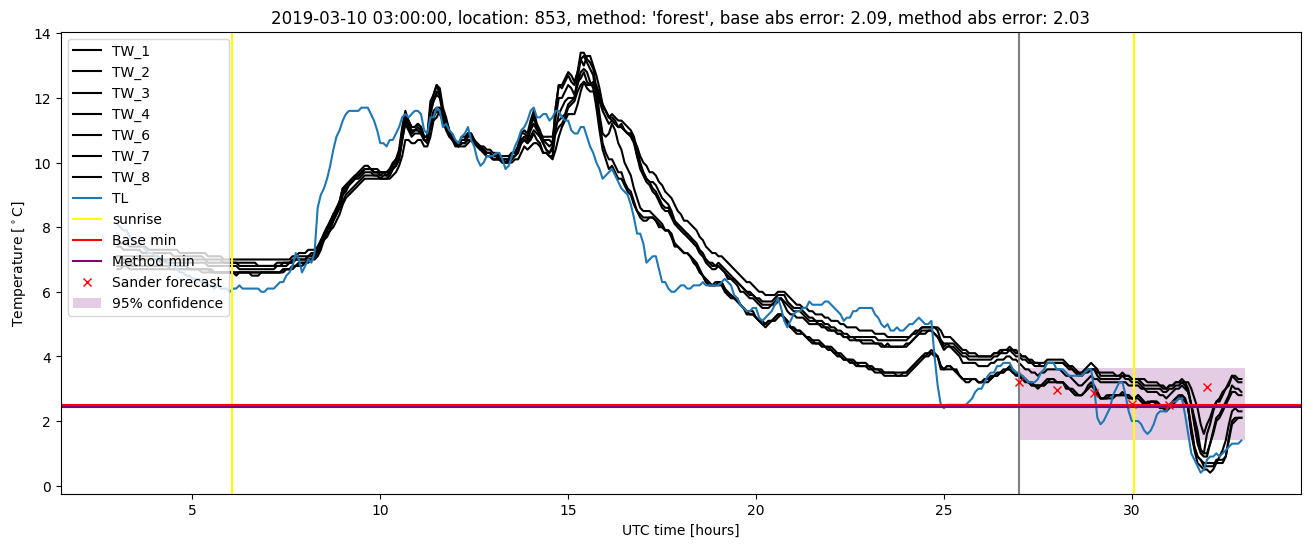
| forest |
winter 2019 |
0.986 |
0.091 |
0.337 |
0.407 |
2.815 |
0.398 |
1.448 |
| baseline |
all |
0.975 |
0.064 |
0.484 |
0.489 |
5.298 |
NaN |
NaN |
| forest |
all |
0.983 |
0.092 |
0.392 |
0.437 |
5.149 |
0.414 |
1.664 |
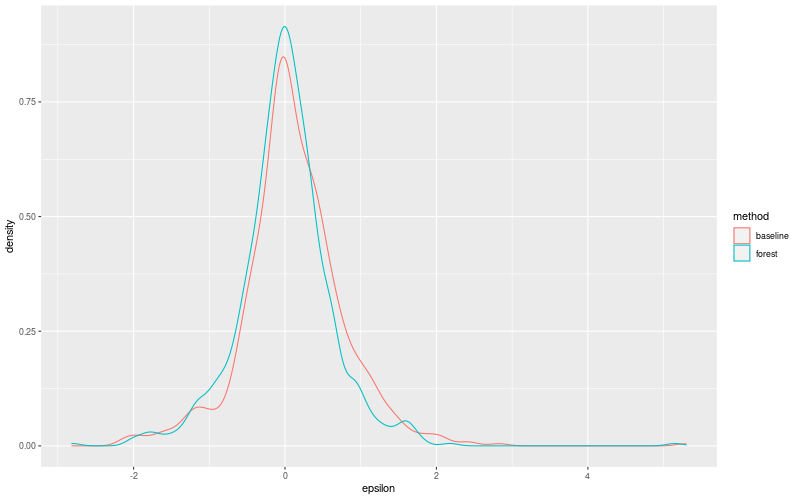
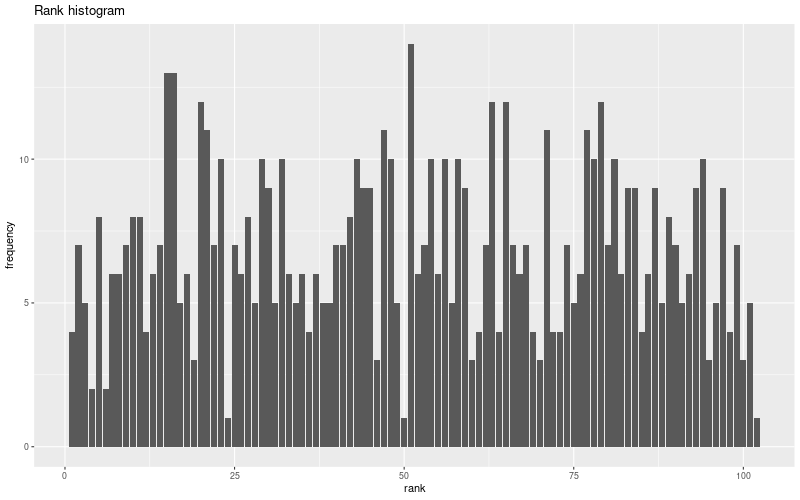
Random forest plots
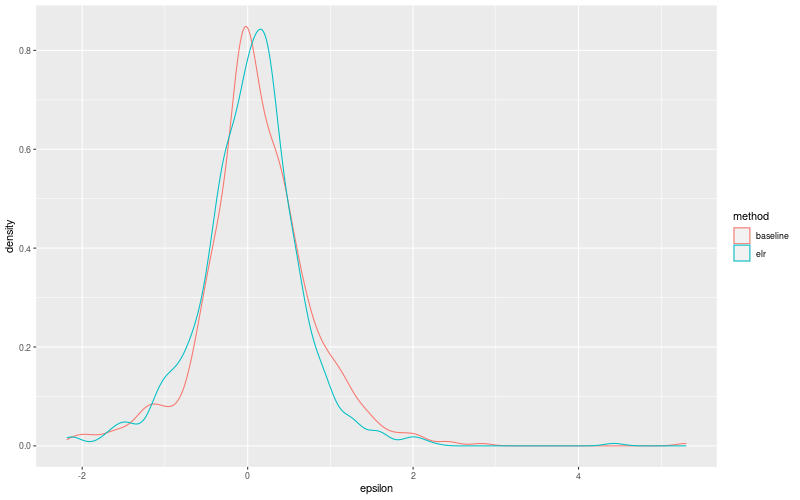
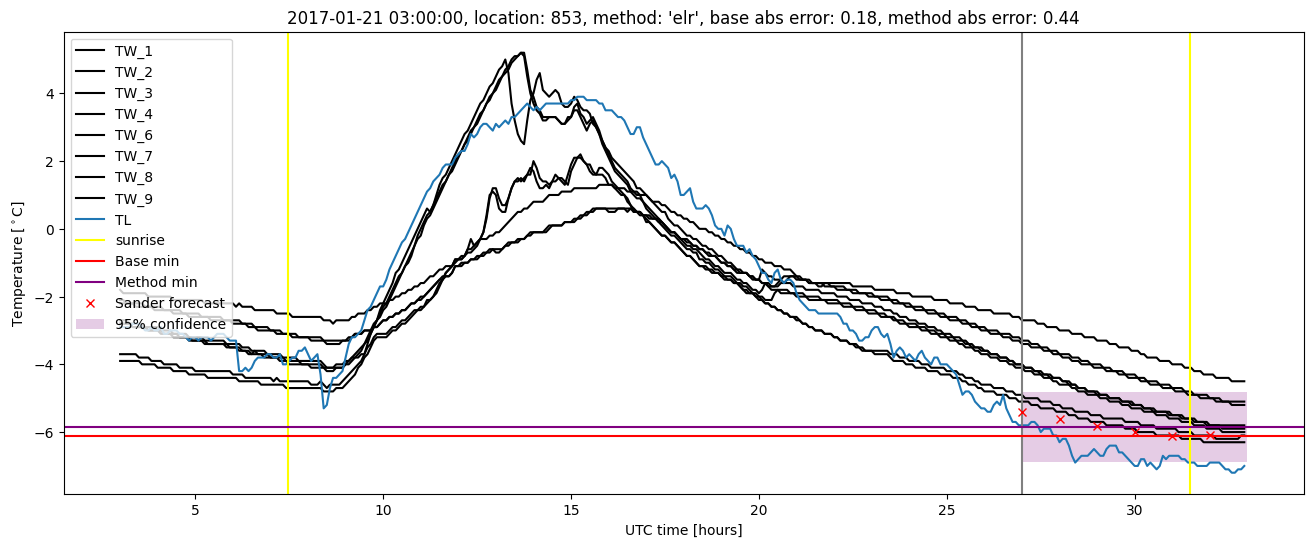
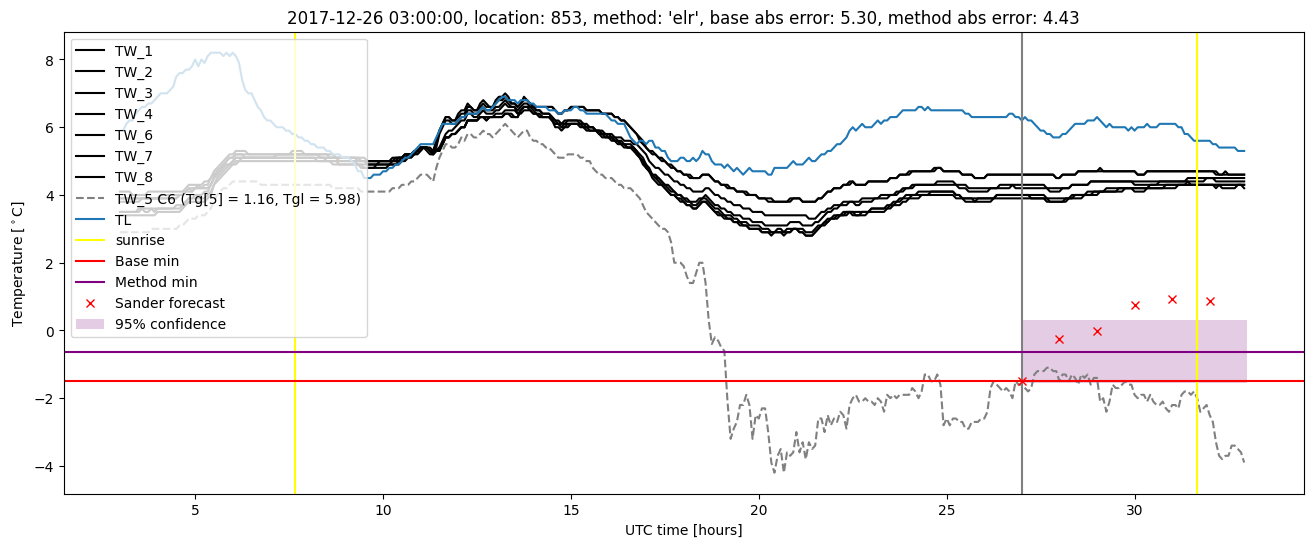
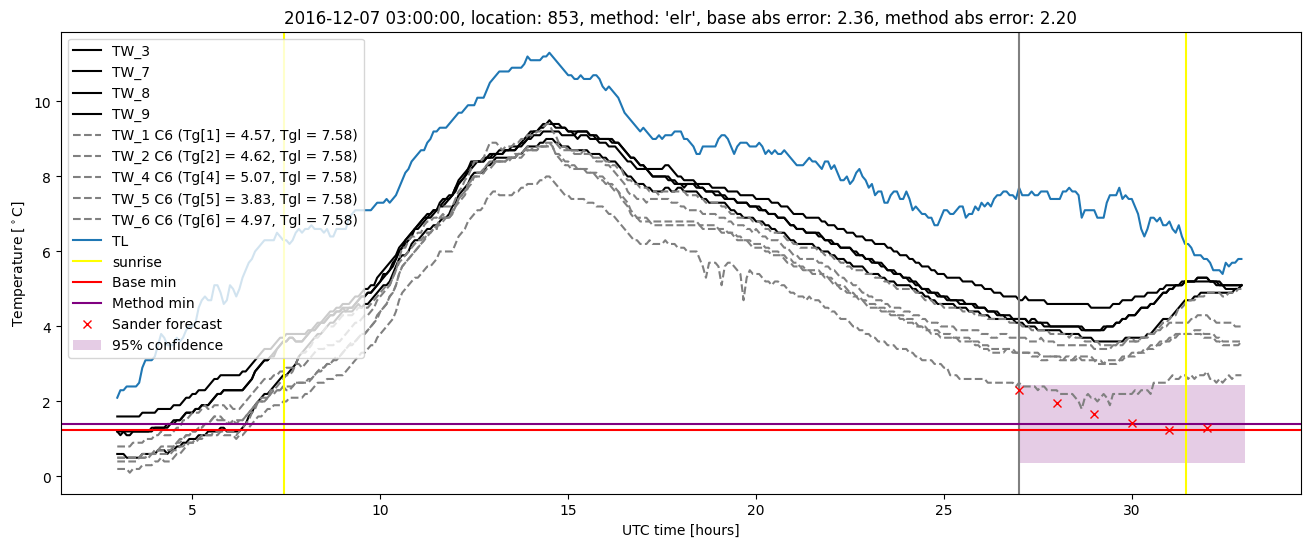
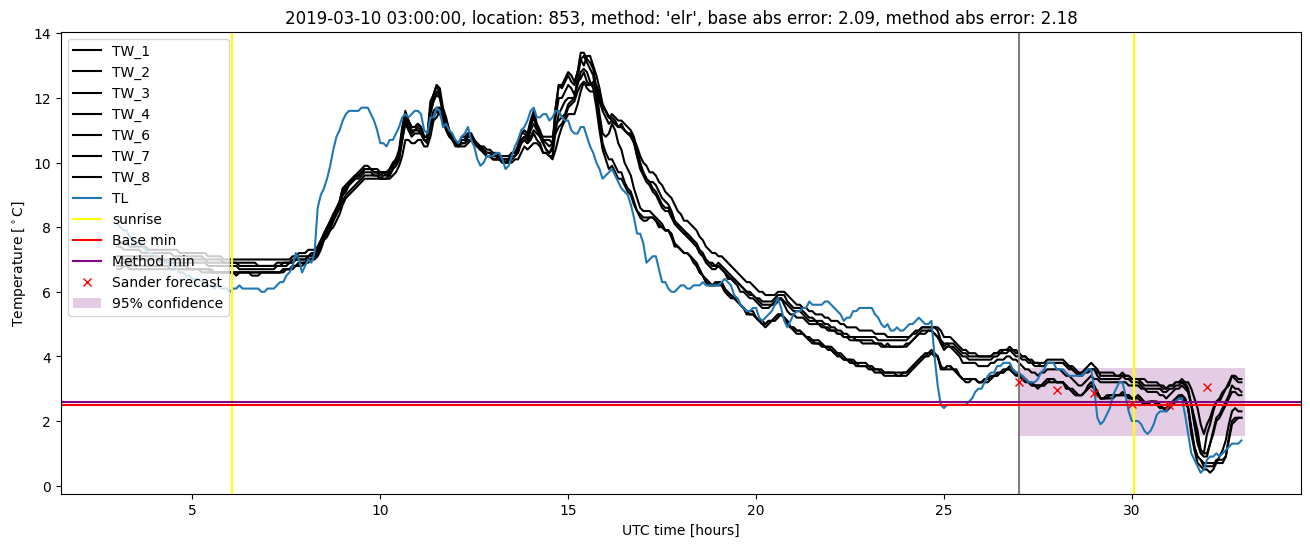
Extended logistic regression results
| names |
period |
power |
significance |
meanSquareError |
absError |
maxError |
CRPS |
IGN |
| baseline |
winter 2016 |
0.979 |
0.067 |
0.369 |
0.439 |
2.087 |
NaN |
NaN |
| elr |
winter 2016 |
0.995 |
0.067 |
0.313 |
0.427 |
1.781 |
0.483 |
1.937 |
| baseline |
winter 2017 |
0.974 |
0.075 |
0.409 |
0.461 |
2.828 |
NaN |
NaN |
| elr |
winter 2017 |
0.974 |
0.100 |
0.337 |
0.431 |
2.201 |
0.511 |
2.309 |
| baseline |
winter 2018 |
0.961 |
0.094 |
0.708 |
0.580 |
5.298 |
NaN |
NaN |
| elr |
winter 2018 |
0.967 |
0.094 |
0.524 |
0.499 |
4.428 |
0.470 |
2.615 |
| baseline |
winter 2019 |
0.986 |
0.000e+00 |
0.445 |
0.475 |
2.466 |
NaN |
NaN |
| elr |
winter 2019 |
0.993 |
0.091 |
0.357 |
0.434 |
2.183 |
0.448 |
1.788 |
| baseline |
all |
0.975 |
0.064 |
0.484 |
0.489 |
5.298 |
NaN |
NaN |
| elr |
all |
0.983 |
0.092 |
0.384 |
0.448 |
4.428 |
0.478 |
2.162 |
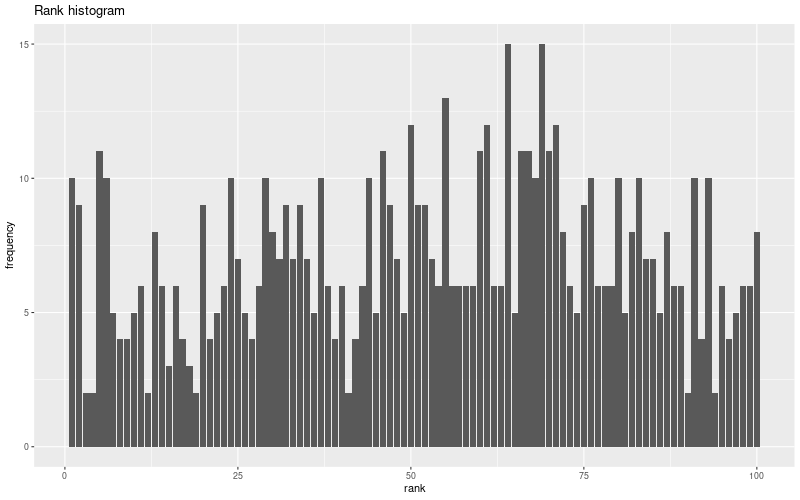
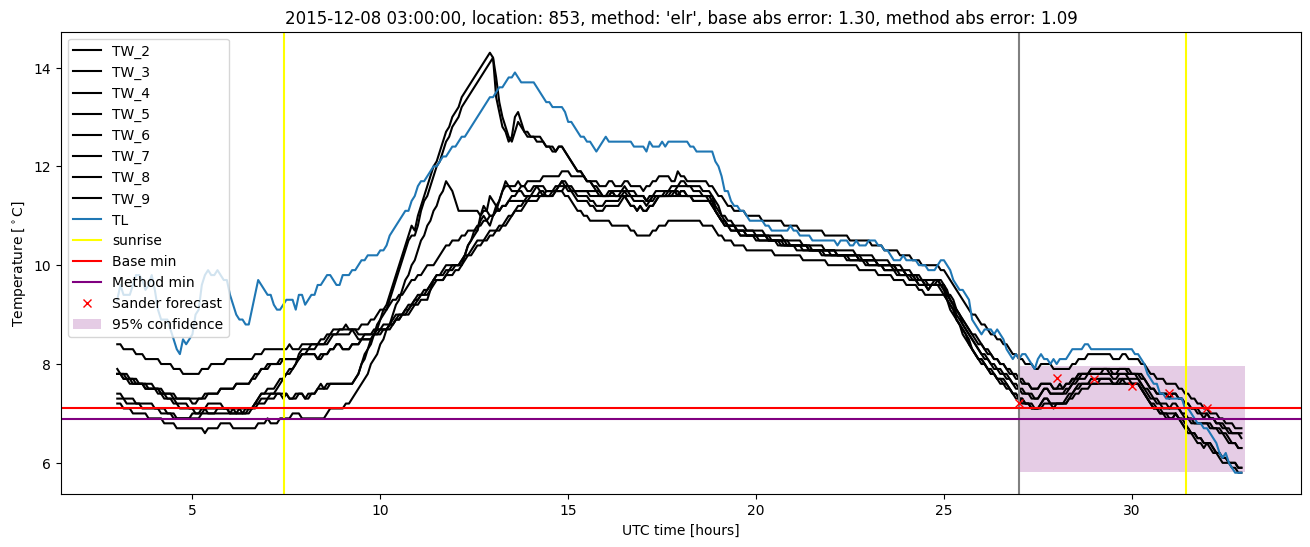
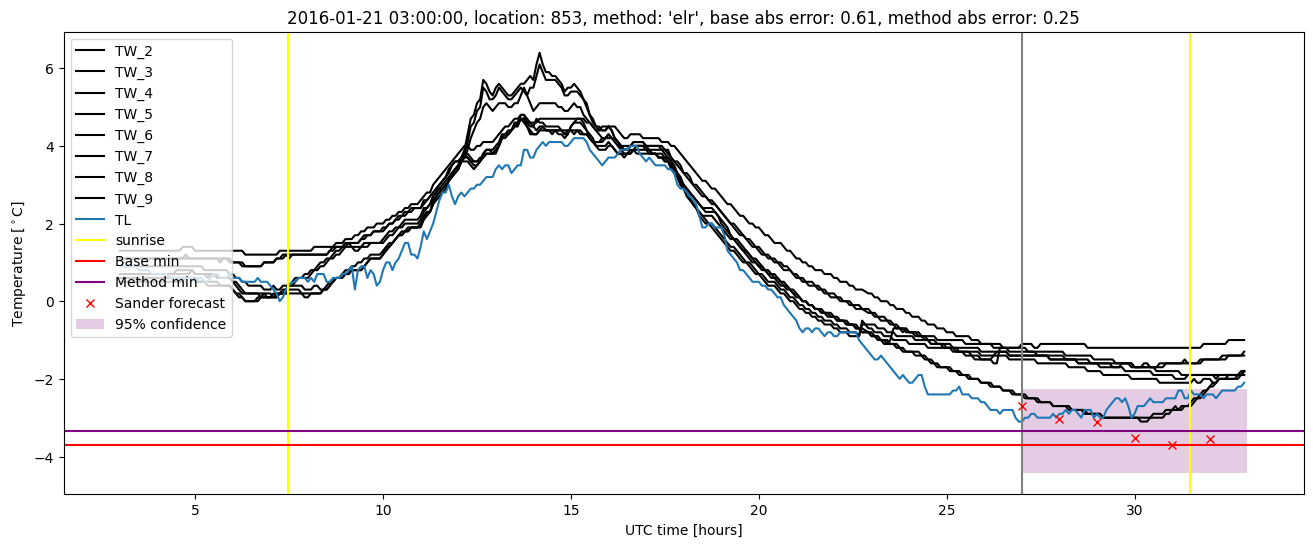
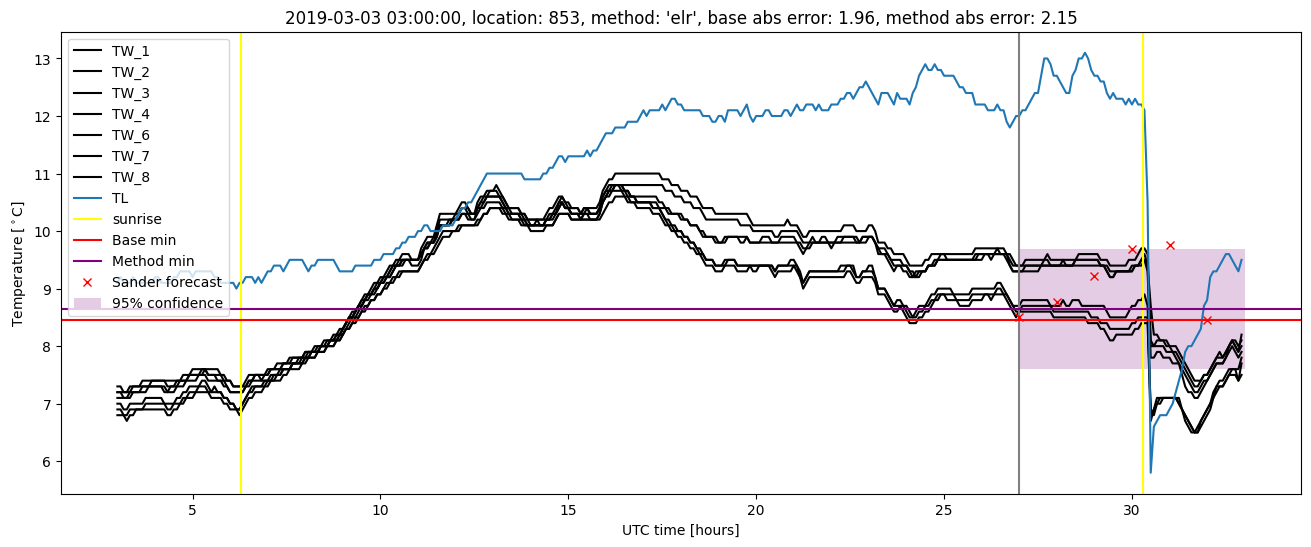
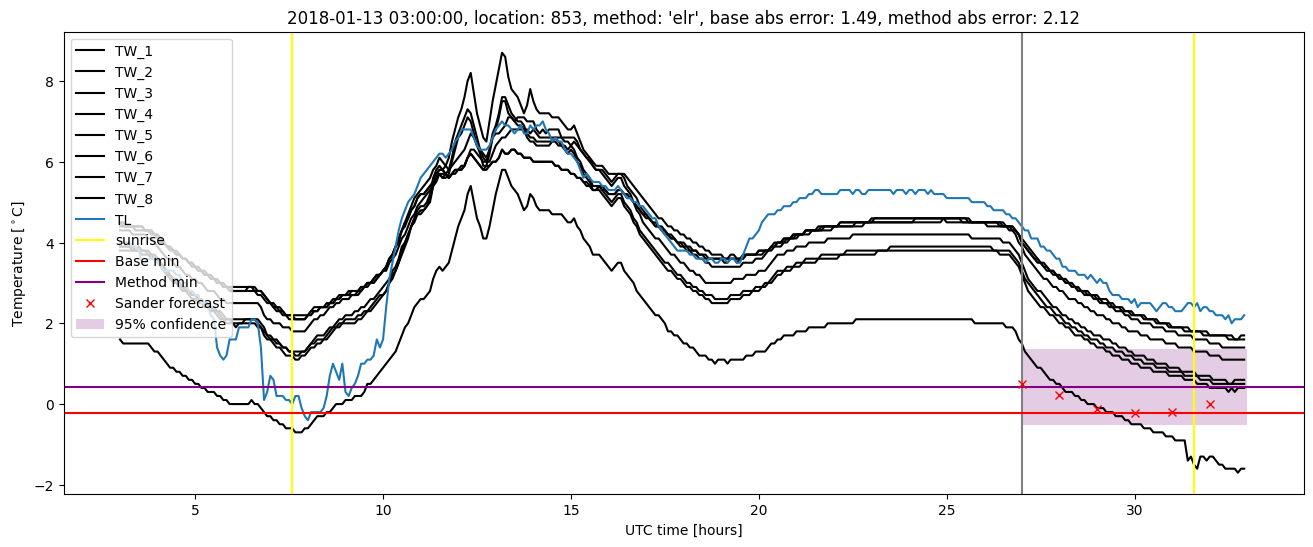
Extended logistic regression plots