GMS location: 852
Random forest results
| names |
period |
power |
significance |
meanSquareError |
absError |
maxError |
CRPS |
IGN |
| baseline |
winter 2016 |
0.981 |
0.045 |
0.567 |
0.549 |
2.906 |
NaN |
NaN |
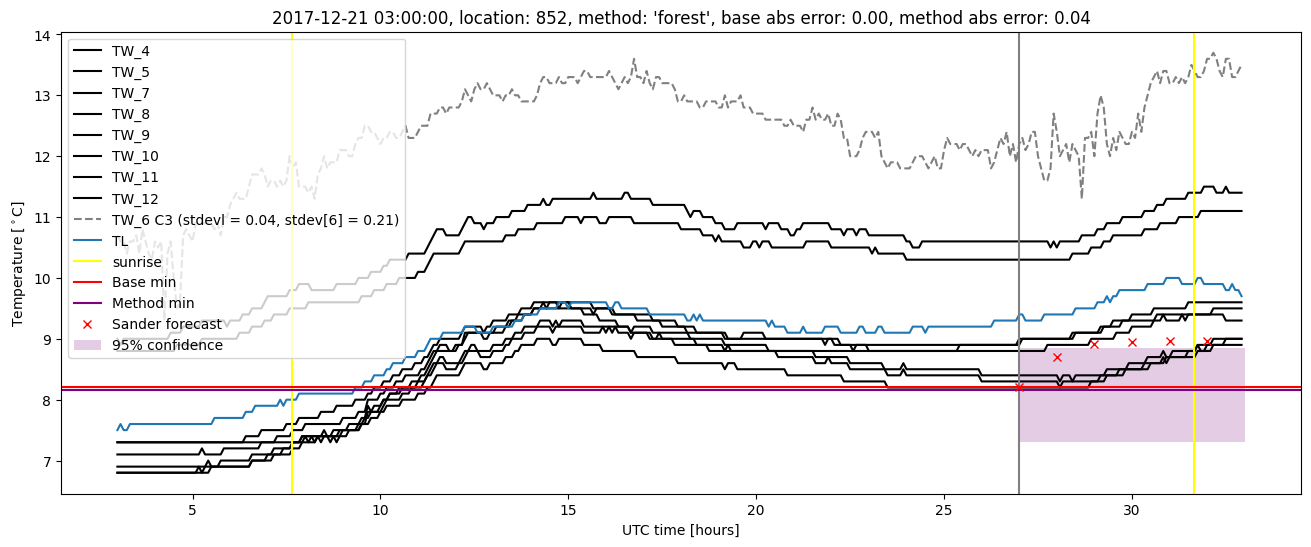
| forest |
winter 2016 |
0.981 |
0.068 |
0.544 |
0.529 |
2.599 |
0.460 |
1.439 |
| baseline |
winter 2017 |
0.970 |
0.113 |
0.872 |
0.664 |
3.465 |
NaN |
NaN |
| forest |
winter 2017 |
0.980 |
0.094 |
0.677 |
0.615 |
3.022 |
0.446 |
1.438 |
| baseline |
winter 2018 |
0.962 |
0.128 |
1.647 |
0.808 |
7.548 |
NaN |
NaN |
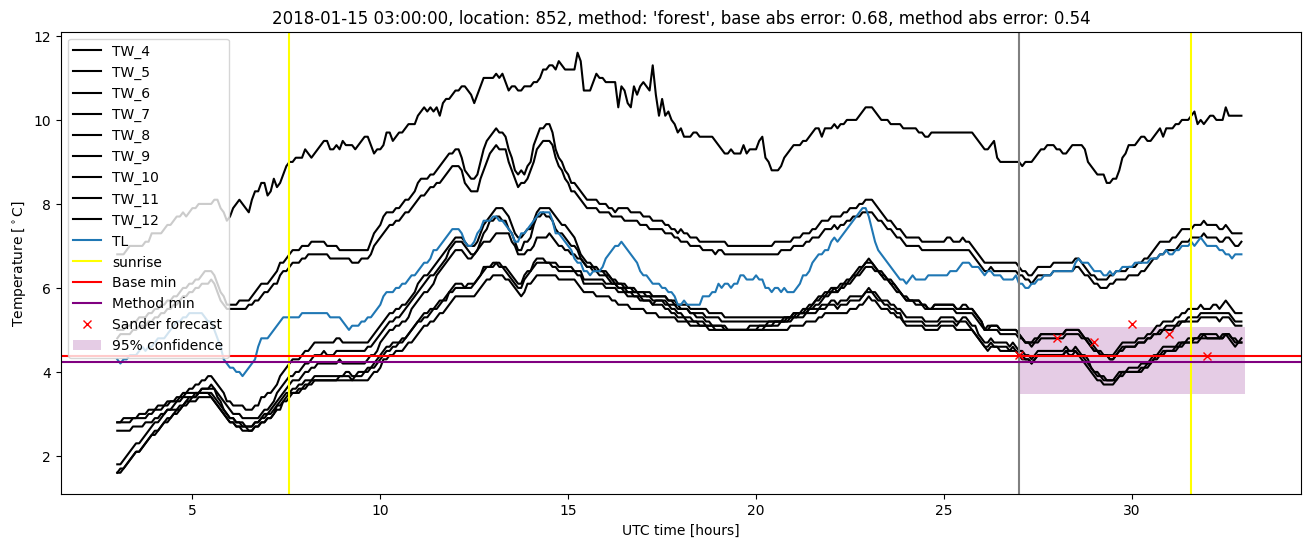
| forest |
winter 2018 |
0.985 |
0.154 |
1.525 |
0.764 |
7.459 |
0.437 |
1.533 |
| baseline |
winter 2019 |
0.972 |
0.029 |
0.573 |
0.491 |
3.942 |
NaN |
NaN |
| forest |
winter 2019 |
0.963 |
0.057 |
0.426 |
0.460 |
2.708 |
0.505 |
1.410 |
| baseline |
all |
0.972 |
0.082 |
0.914 |
0.629 |
7.548 |
NaN |
NaN |
| forest |
all |
0.978 |
0.094 |
0.800 |
0.594 |
7.459 |
0.461 |
1.456 |
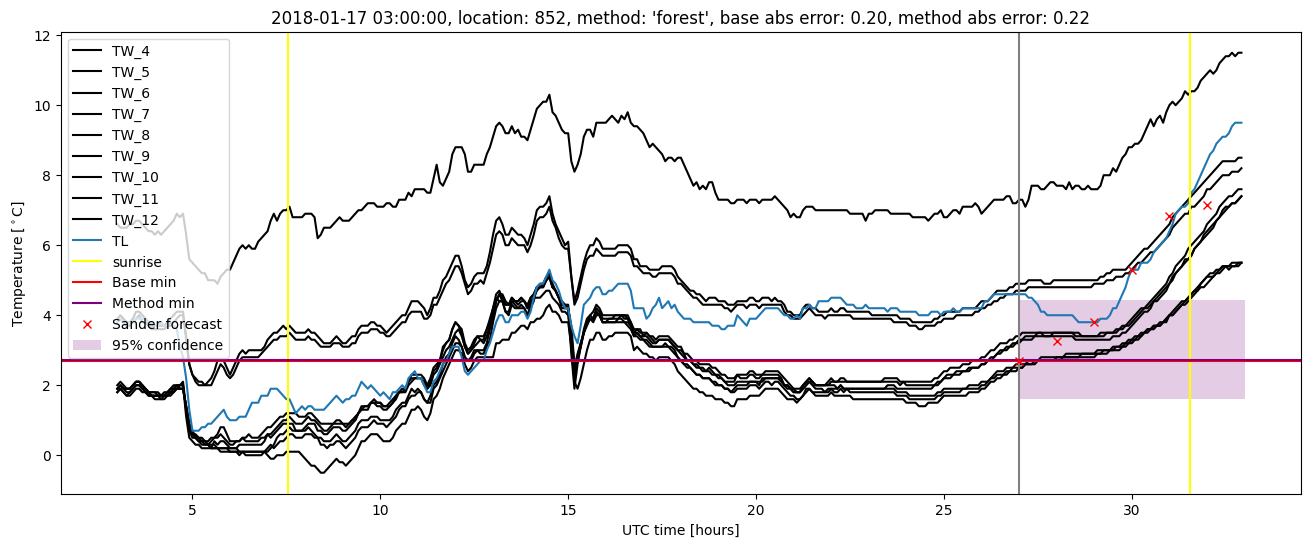
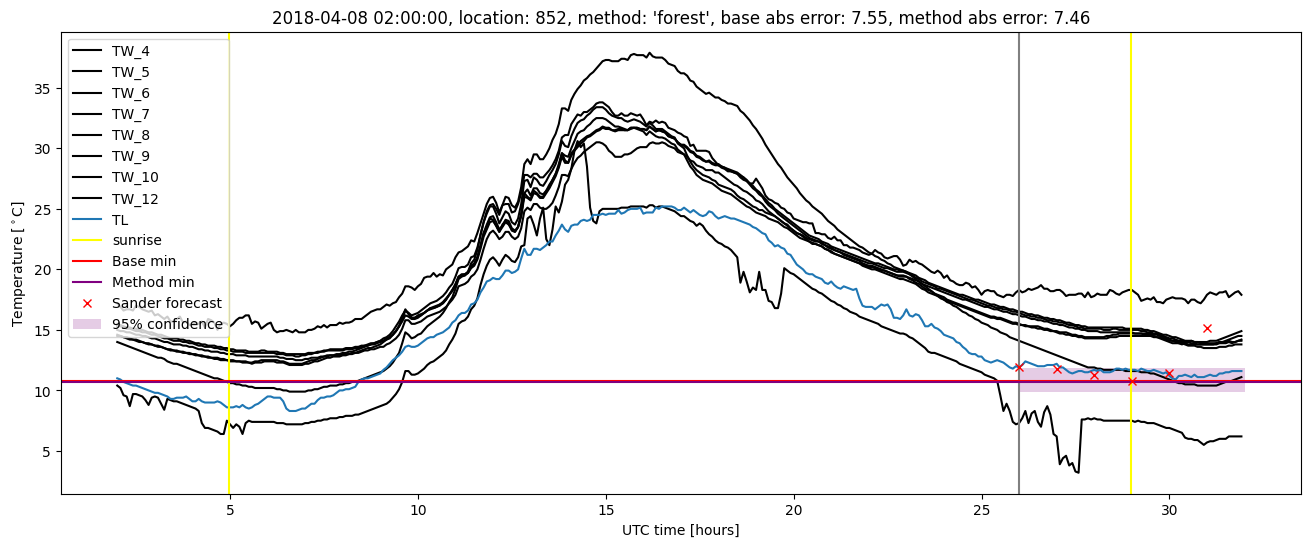
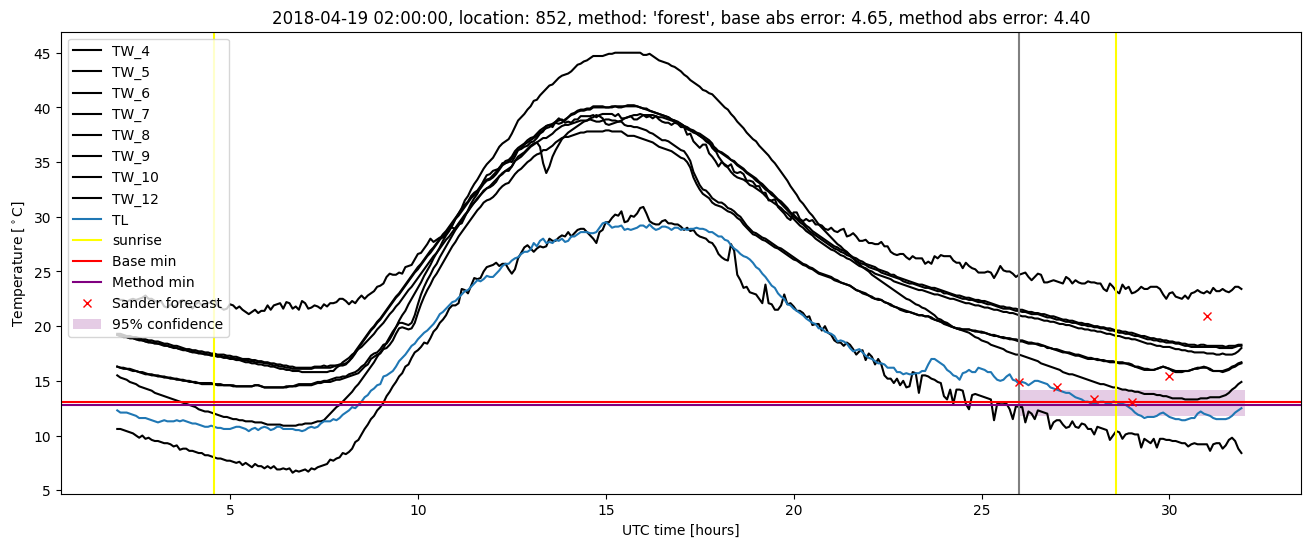
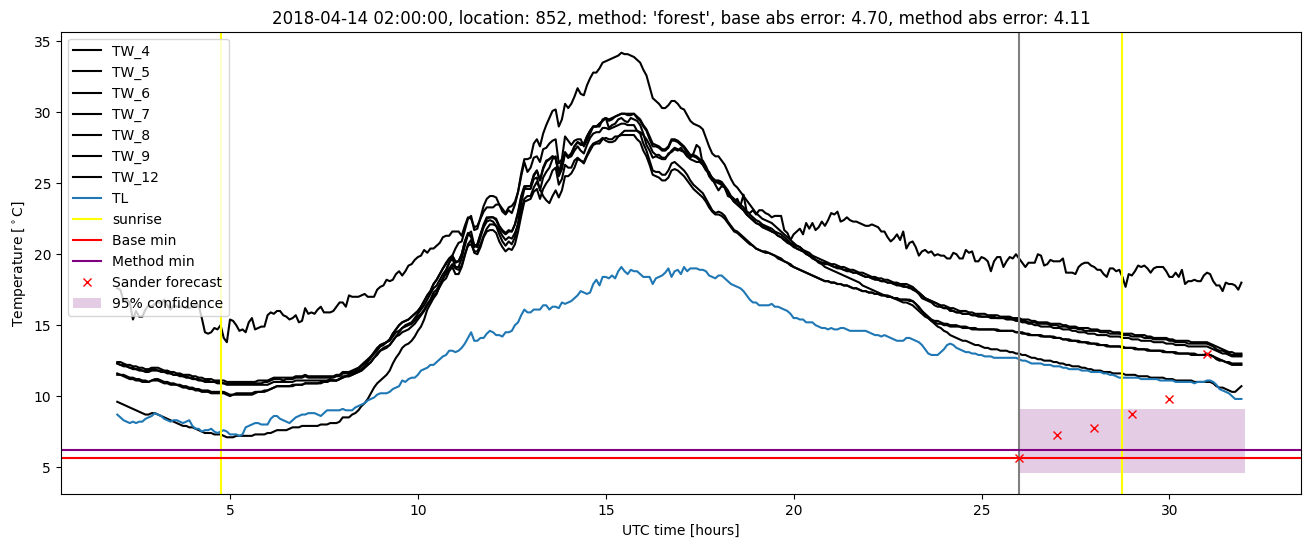
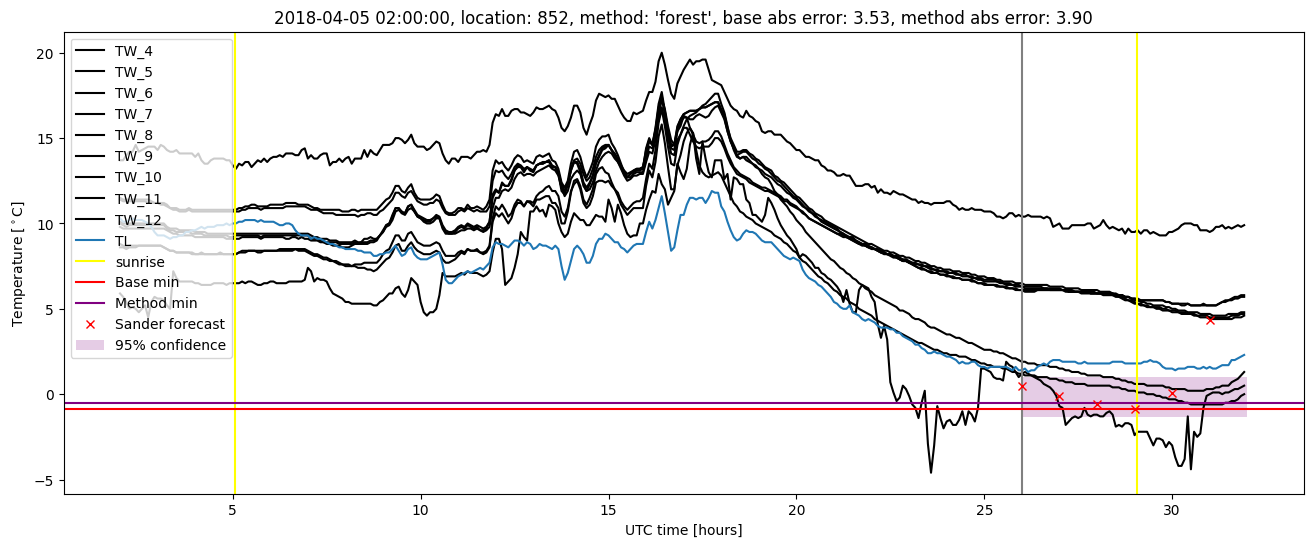
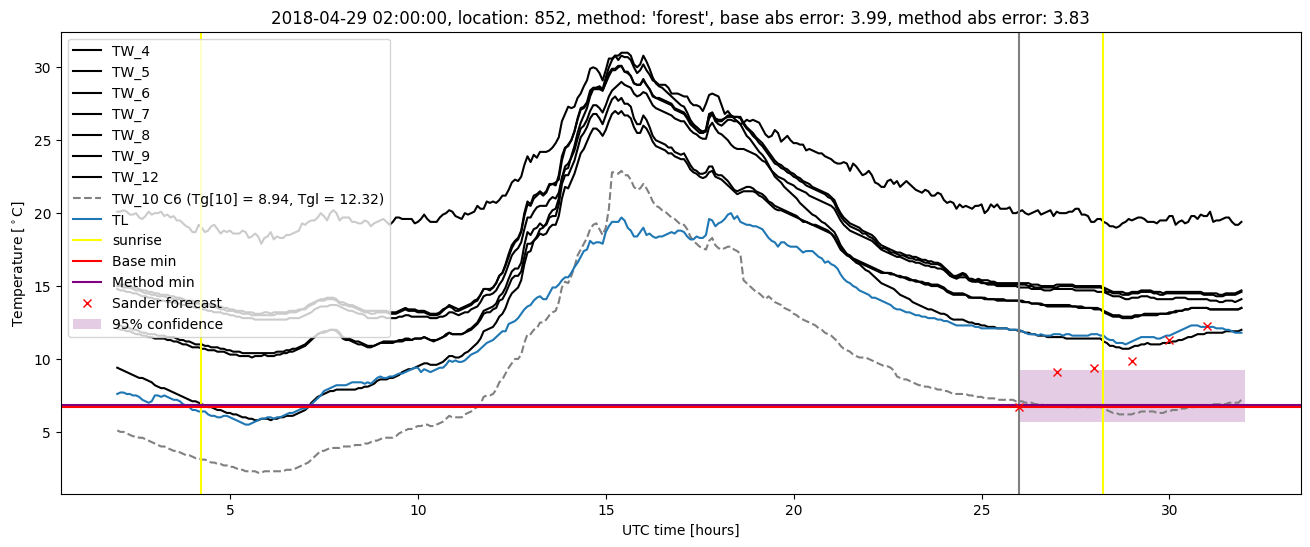
Random forest plots
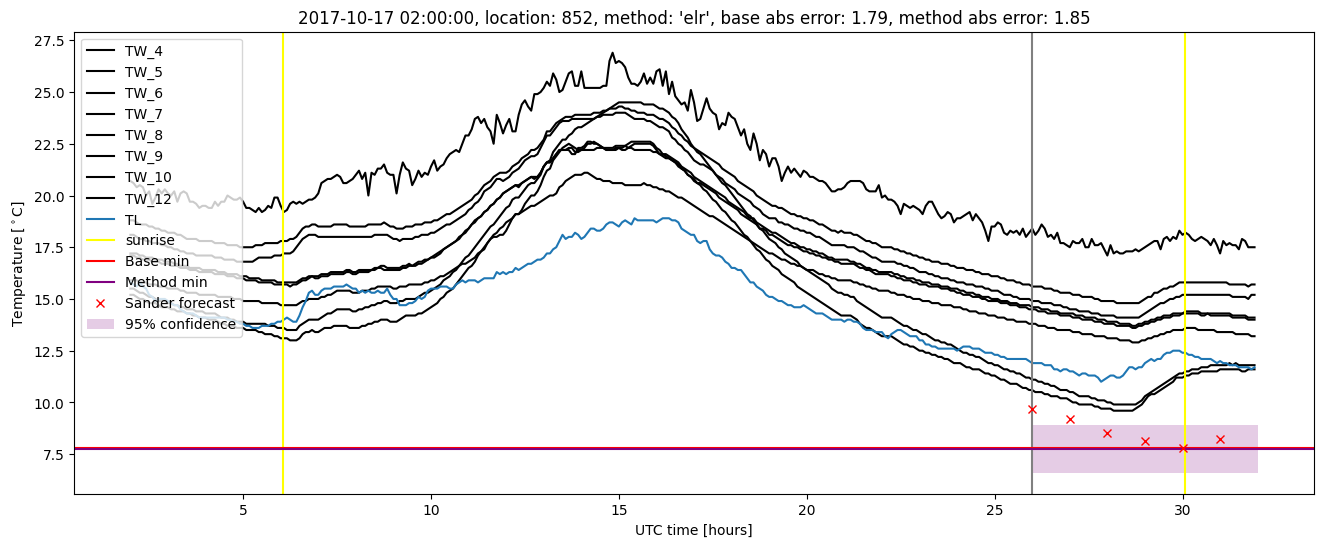
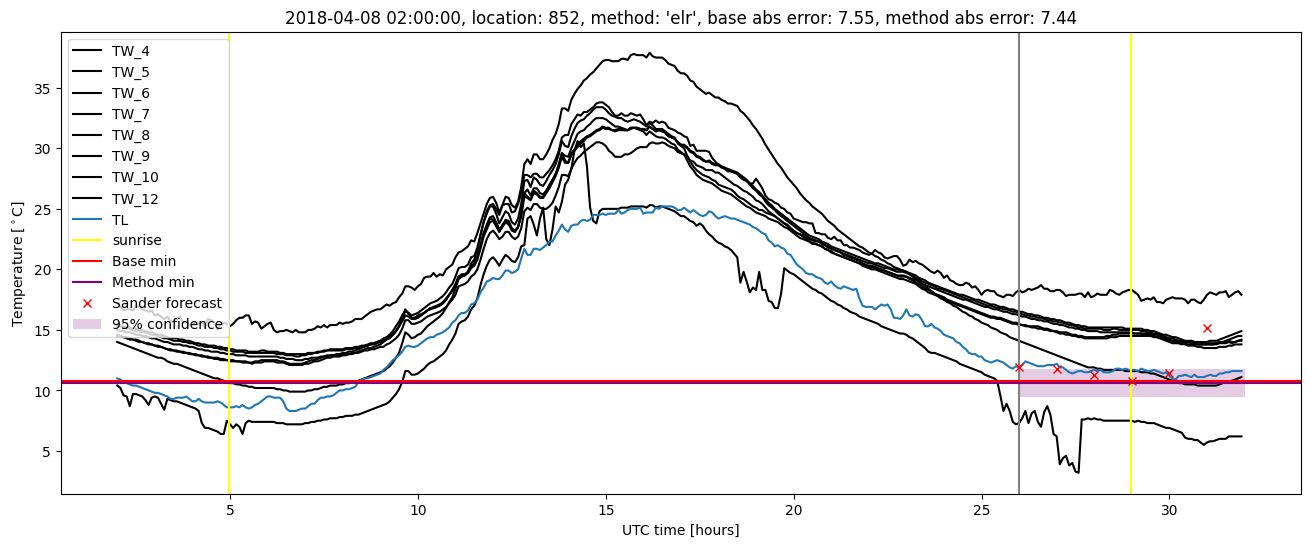
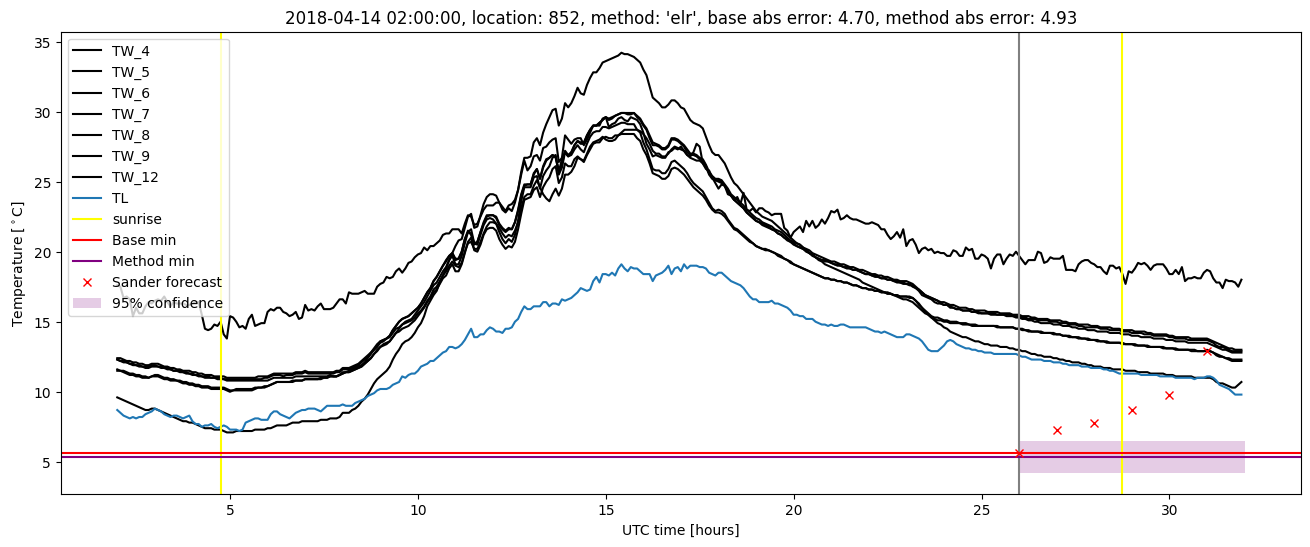
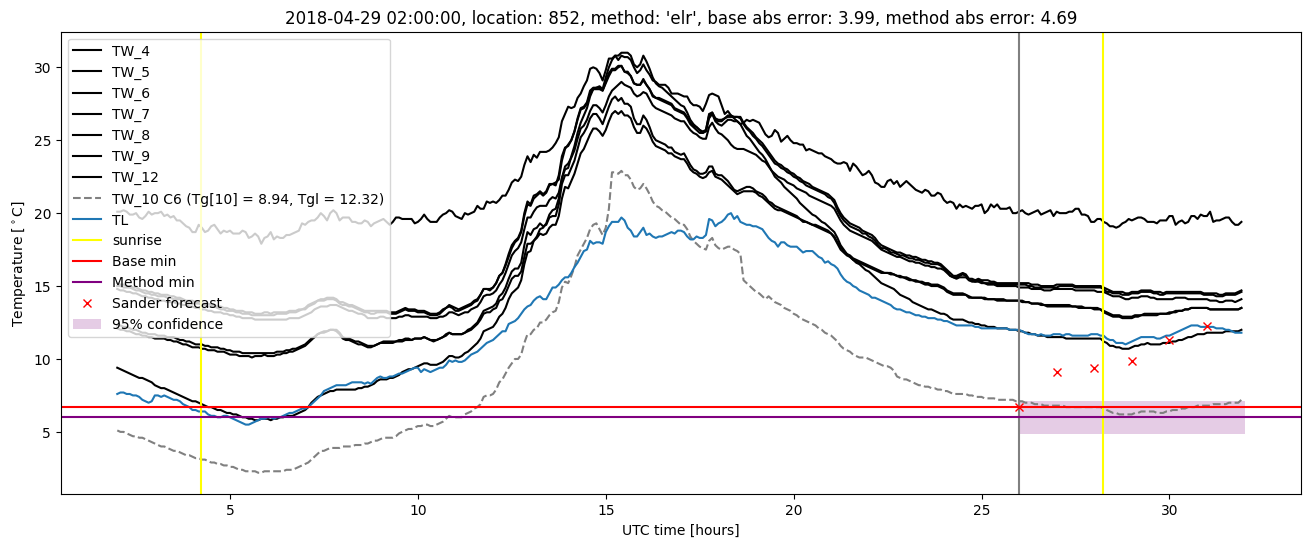
Extended logistic regression results
| names |
period |
power |
significance |
meanSquareError |
absError |
maxError |
CRPS |
IGN |
| baseline |
winter 2016 |
0.981 |
0.045 |
0.567 |
0.549 |
2.906 |
NaN |
NaN |
| elr |
winter 2016 |
0.987 |
0.023 |
0.575 |
0.561 |
2.775 |
0.477 |
1.256 |
| baseline |
winter 2017 |
0.970 |
0.113 |
0.872 |
0.664 |
3.465 |
NaN |
NaN |
| elr |
winter 2017 |
0.990 |
0.057 |
0.696 |
0.649 |
3.082 |
0.502 |
1.357 |
| baseline |
winter 2018 |
0.962 |
0.128 |
1.647 |
0.808 |
7.548 |
NaN |
NaN |
| elr |
winter 2018 |
0.985 |
0.154 |
1.617 |
0.782 |
7.440 |
0.512 |
1.826 |
| baseline |
winter 2019 |
0.972 |
0.029 |
0.573 |
0.491 |
3.942 |
NaN |
NaN |
| elr |
winter 2019 |
0.972 |
0.086 |
0.541 |
0.497 |
3.561 |
0.432 |
1.135 |
| baseline |
all |
0.972 |
0.082 |
0.914 |
0.629 |
7.548 |
NaN |
NaN |
| elr |
all |
0.984 |
0.076 |
0.861 |
0.624 |
7.440 |
0.482 |
1.399 |
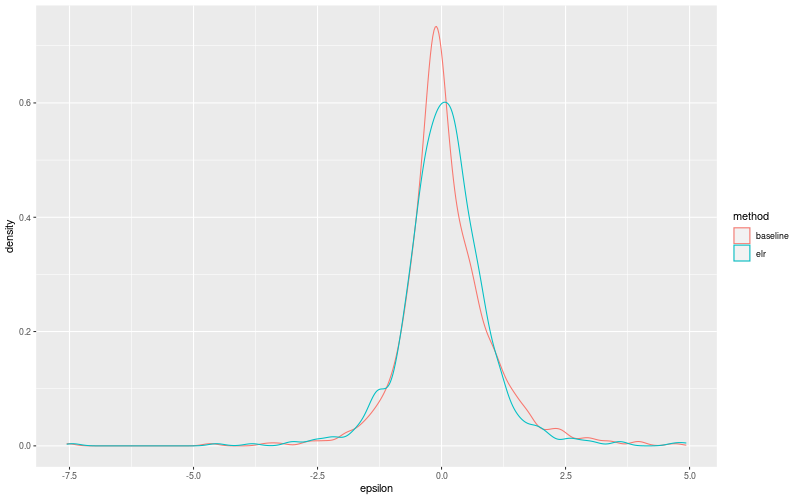
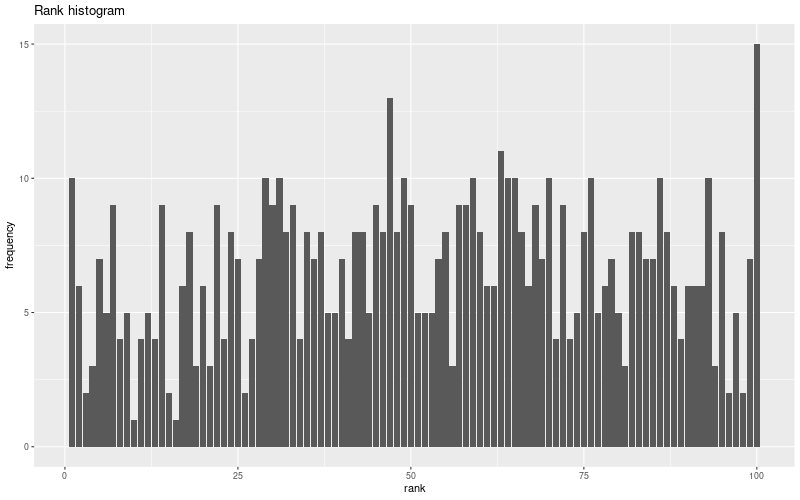
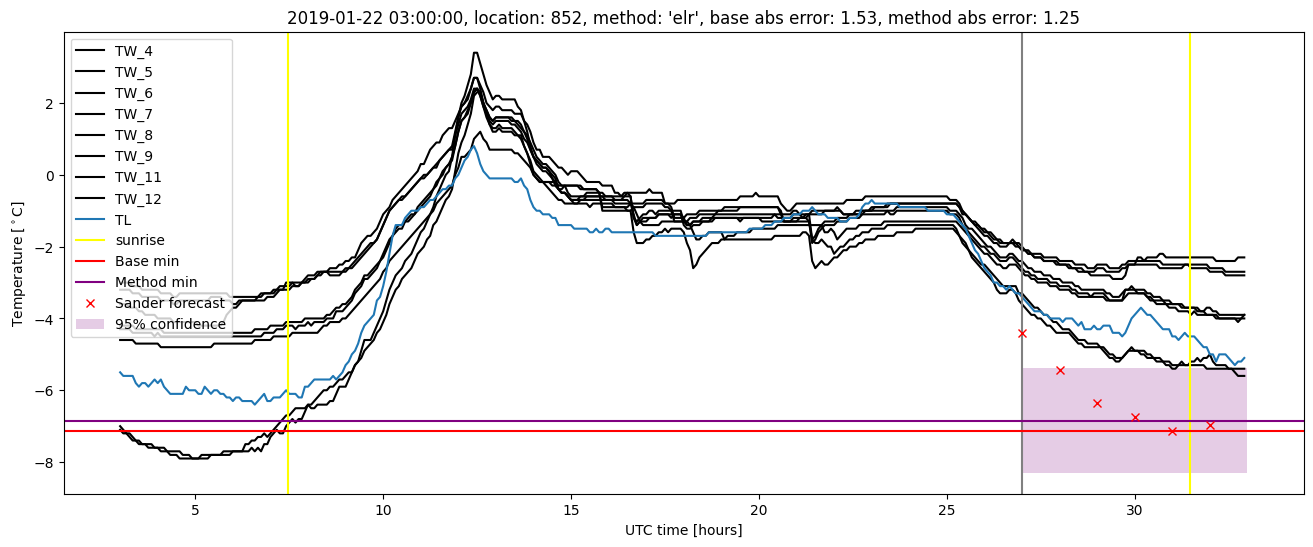
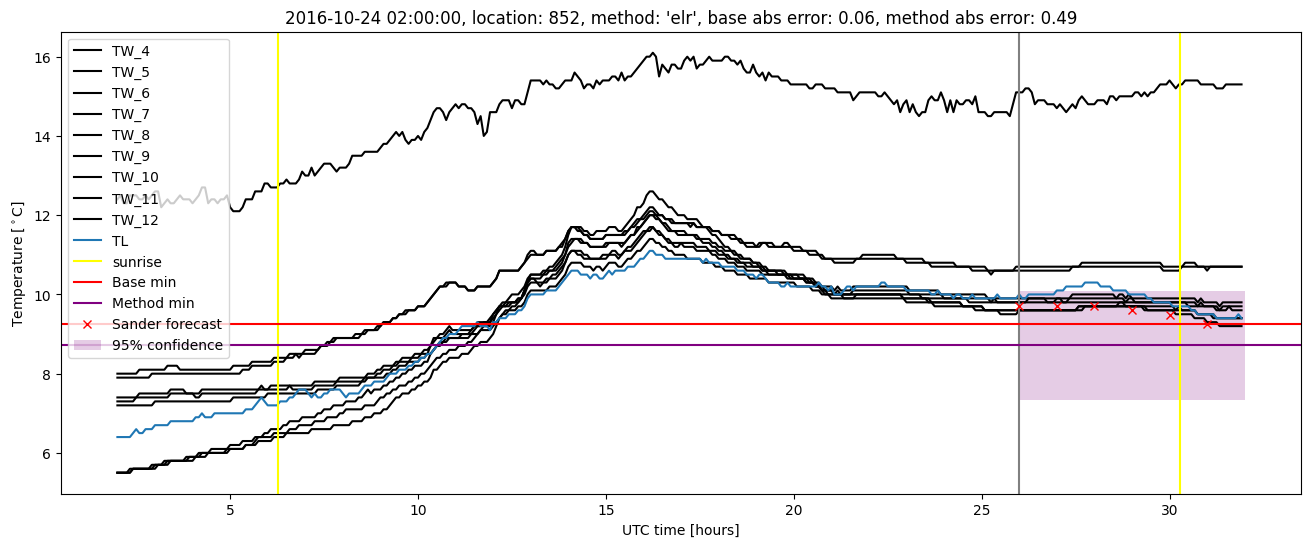
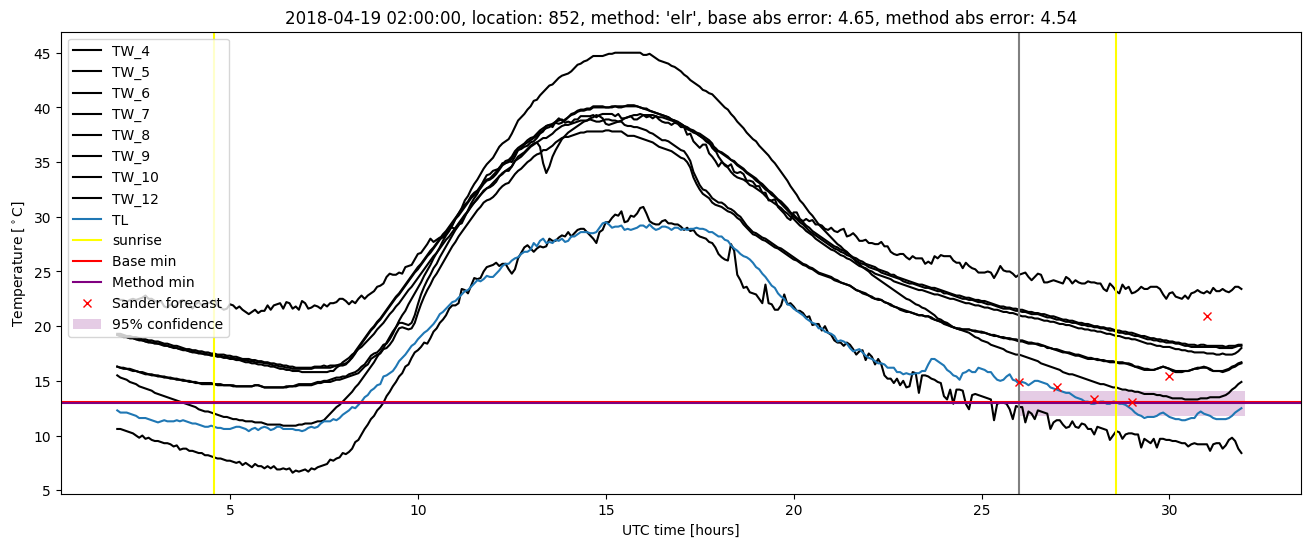
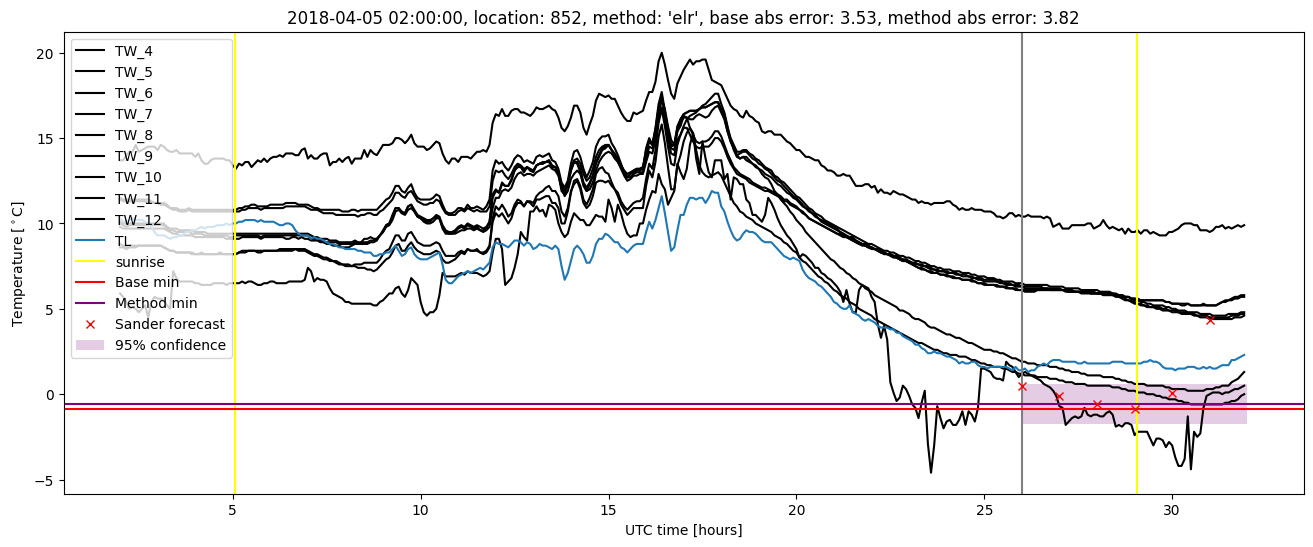
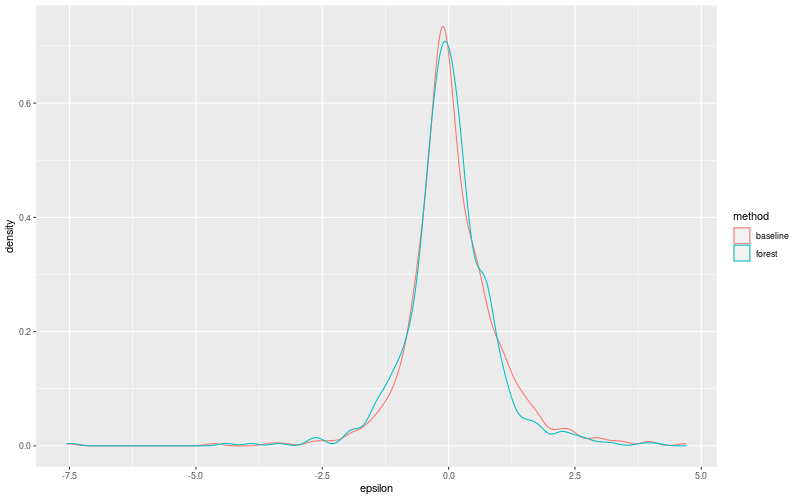
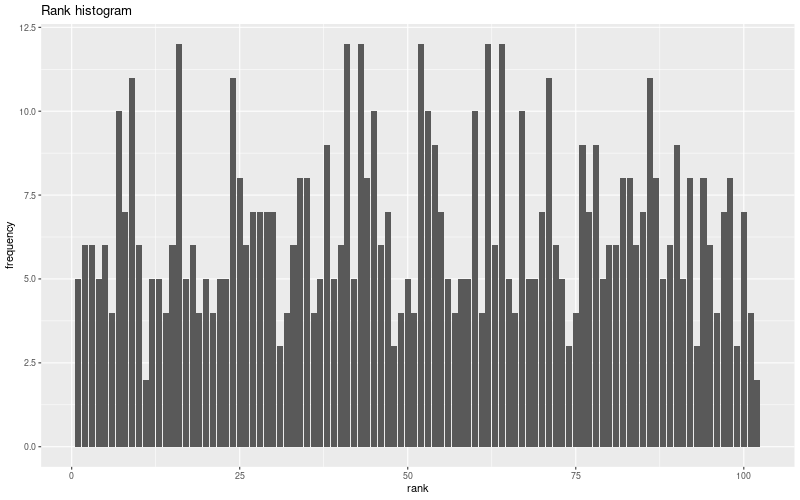
Extended logistic regression plots