GMS location: 851
Random forest results
| names |
period |
power |
significance |
meanSquareError |
absError |
maxError |
CRPS |
IGN |
| baseline |
winter 2016 |
0.965 |
0.143 |
0.448 |
0.494 |
2.591 |
NaN |
NaN |
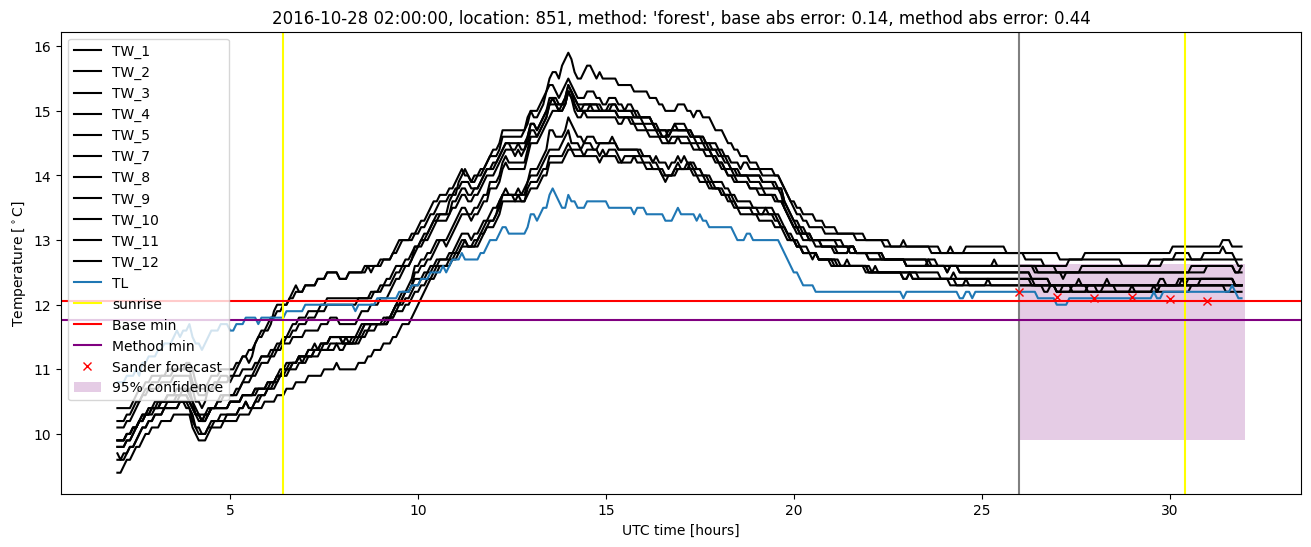
| forest |
winter 2016 |
0.971 |
0.191 |
0.416 |
0.454 |
2.851 |
0.455 |
1.332 |
| baseline |
winter 2017 |
0.983 |
0.081 |
0.591 |
0.526 |
3.139 |
NaN |
NaN |
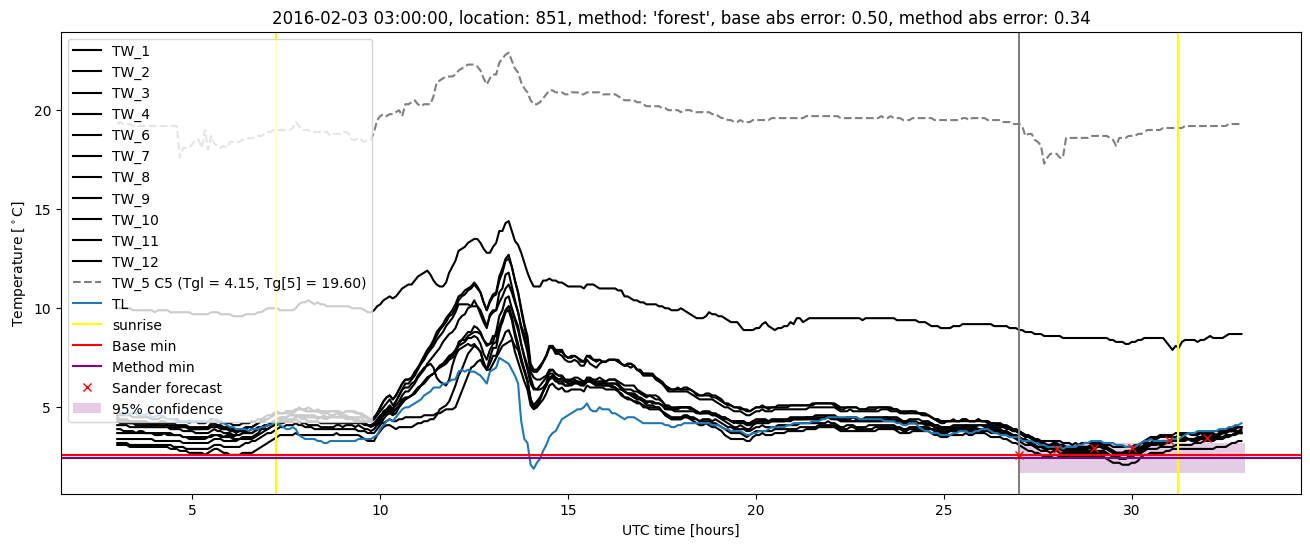
| forest |
winter 2017 |
0.991 |
0.081 |
0.522 |
0.499 |
3.086 |
0.430 |
1.290 |
| baseline |
winter 2018 |
0.978 |
0.179 |
0.769 |
0.587 |
4.442 |
NaN |
NaN |
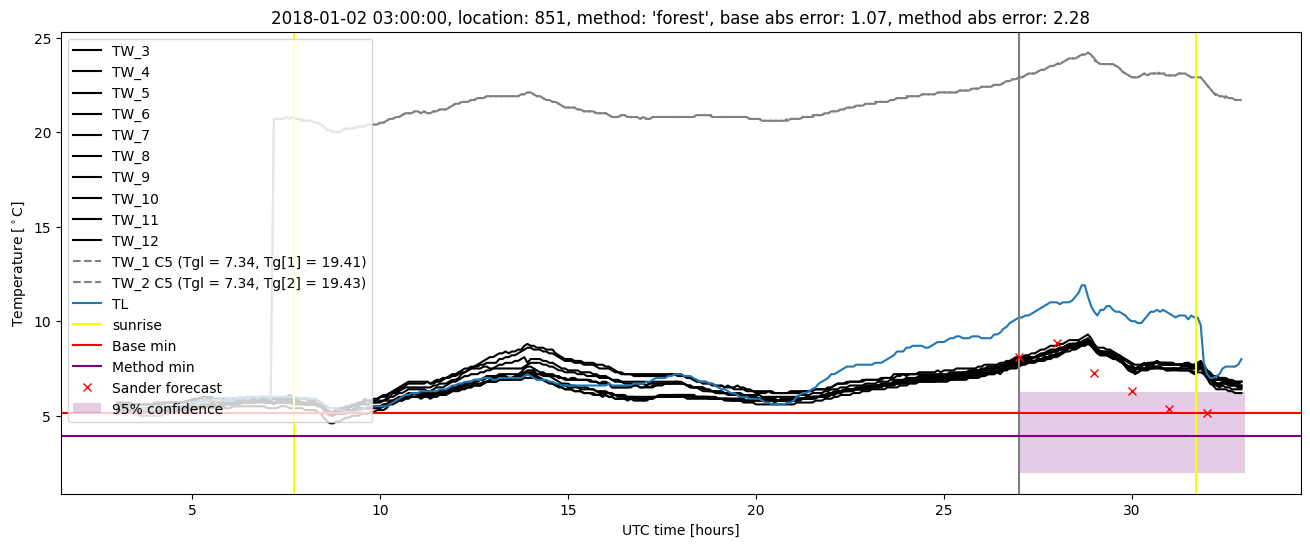
| forest |
winter 2018 |
0.971 |
0.179 |
0.858 |
0.601 |
4.850 |
0.492 |
1.408 |
| baseline |
winter 2019 |
0.985 |
0.045 |
1.083 |
0.608 |
5.369 |
NaN |
NaN |
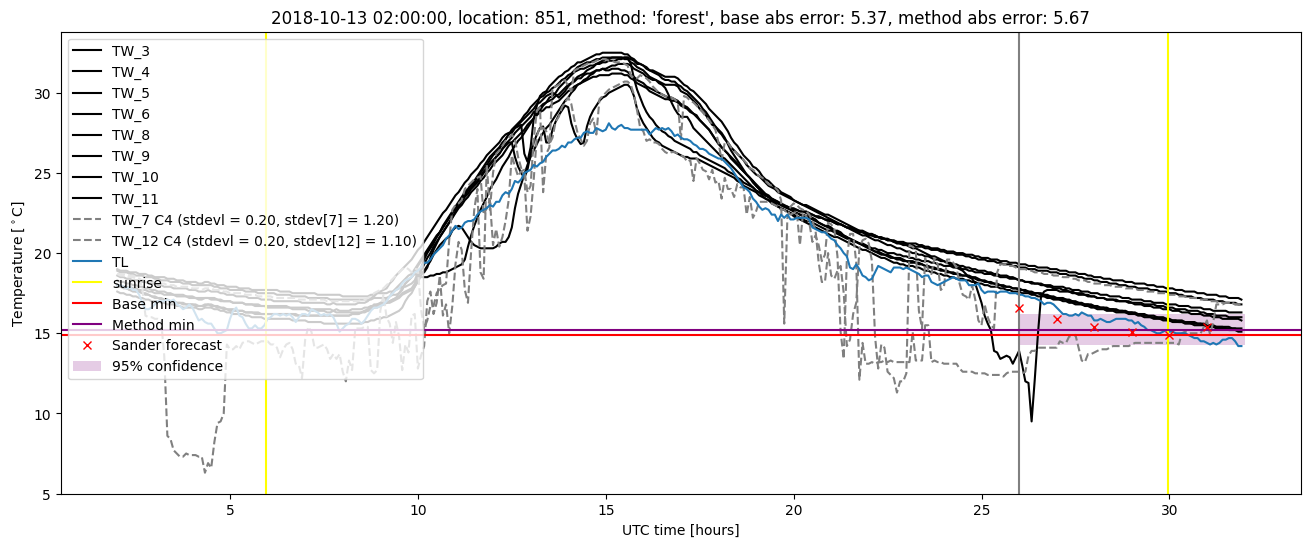
| forest |
winter 2019 |
0.993 |
0.091 |
0.951 |
0.537 |
5.673 |
0.418 |
1.258 |
| baseline |
all |
0.977 |
0.118 |
0.712 |
0.552 |
5.369 |
NaN |
NaN |
| forest |
all |
0.980 |
0.135 |
0.680 |
0.522 |
5.673 |
0.451 |
1.325 |
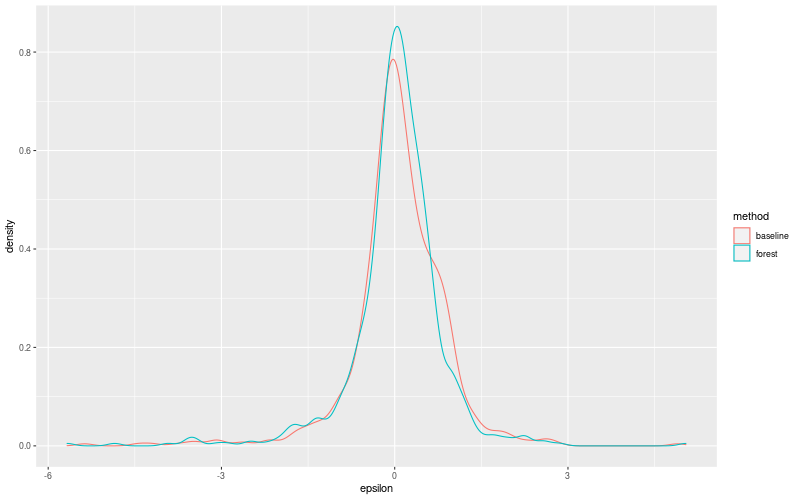
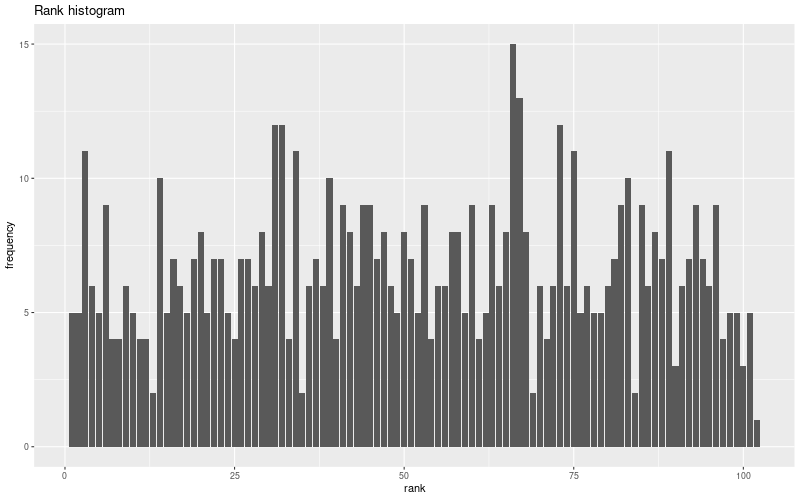
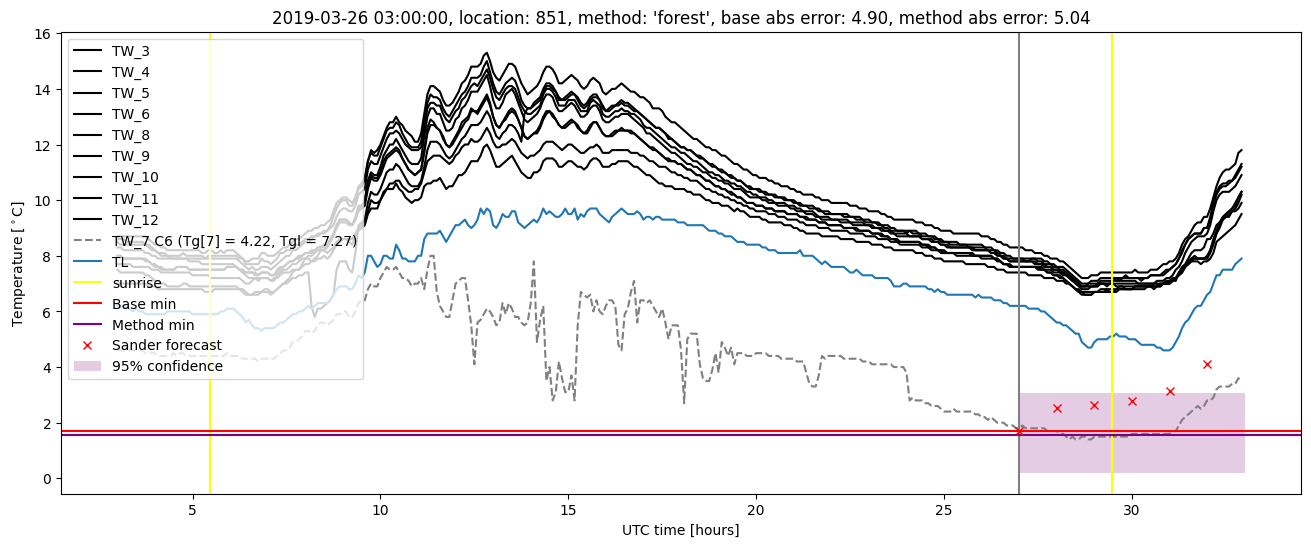
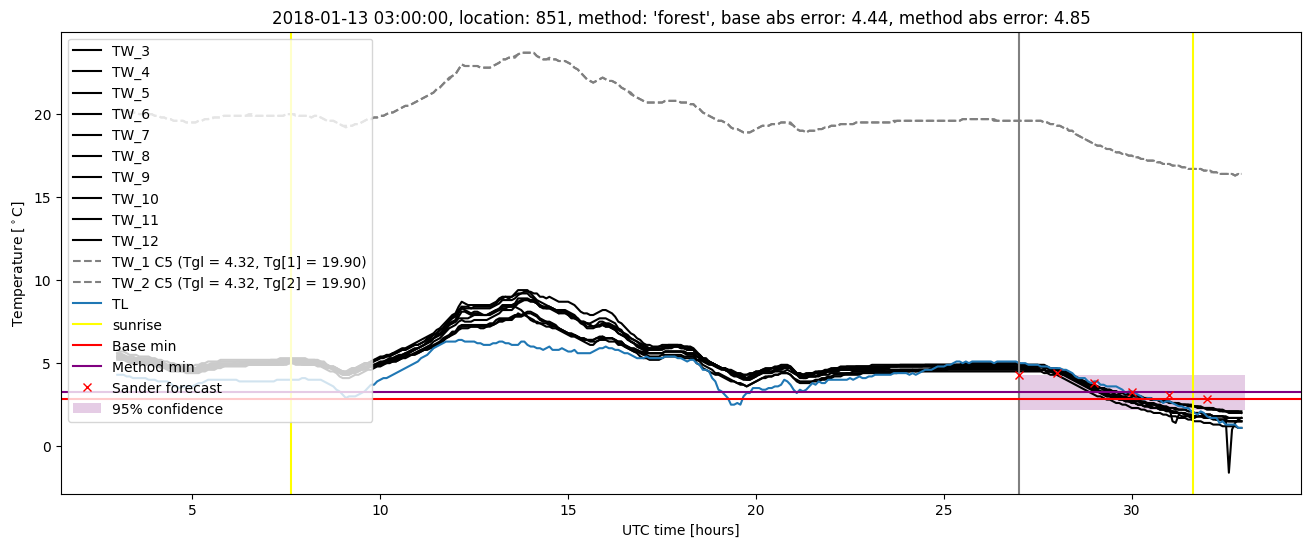
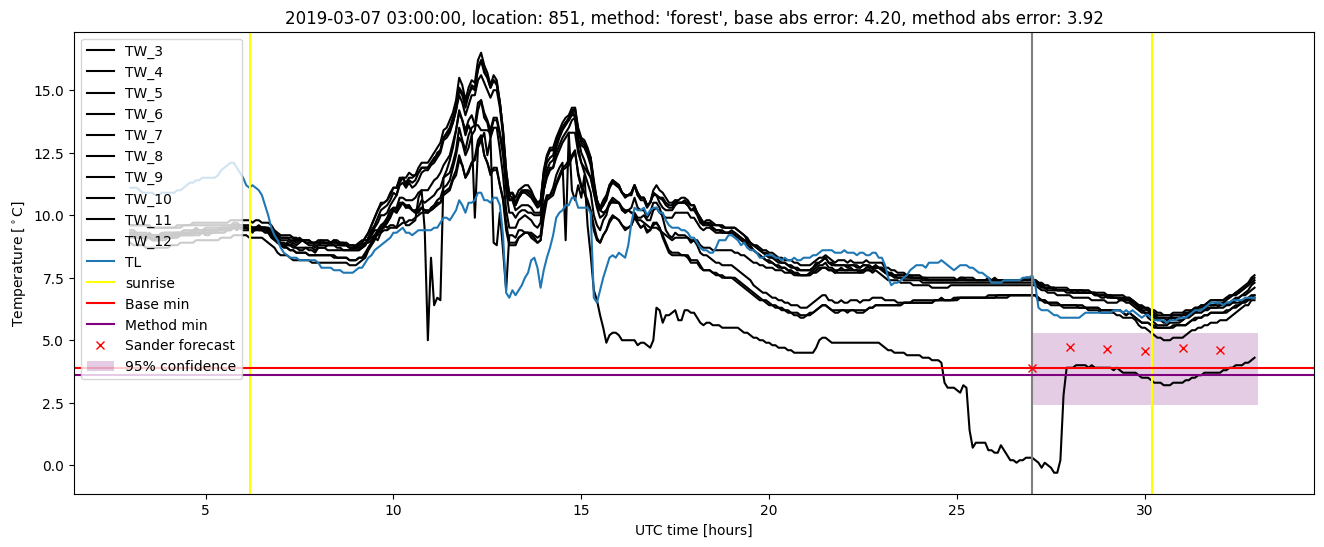
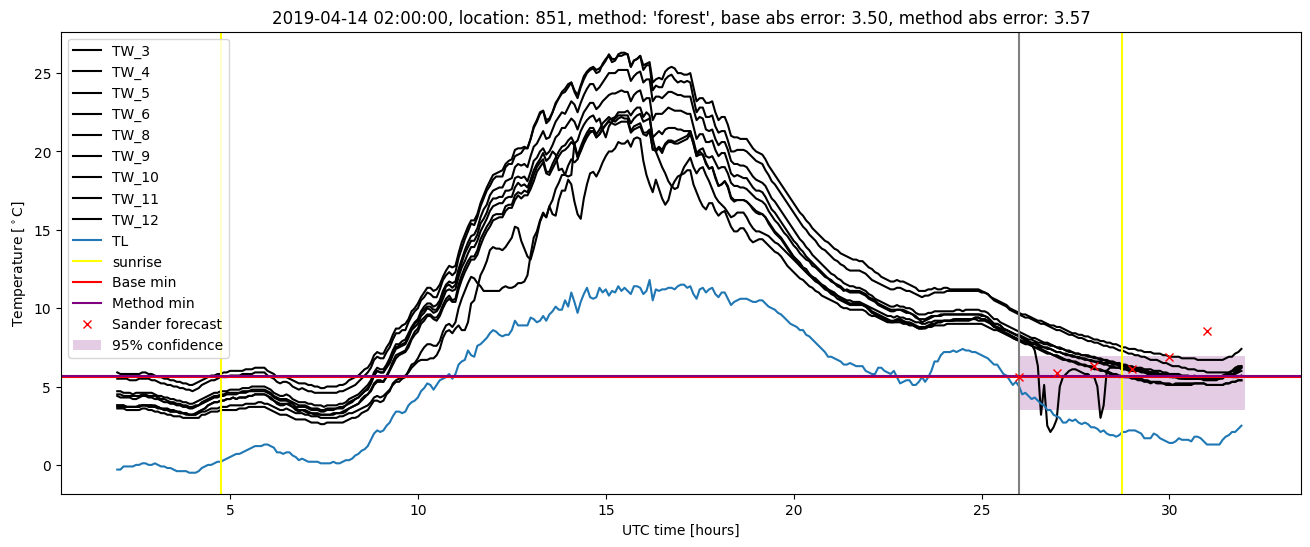
Random forest plots
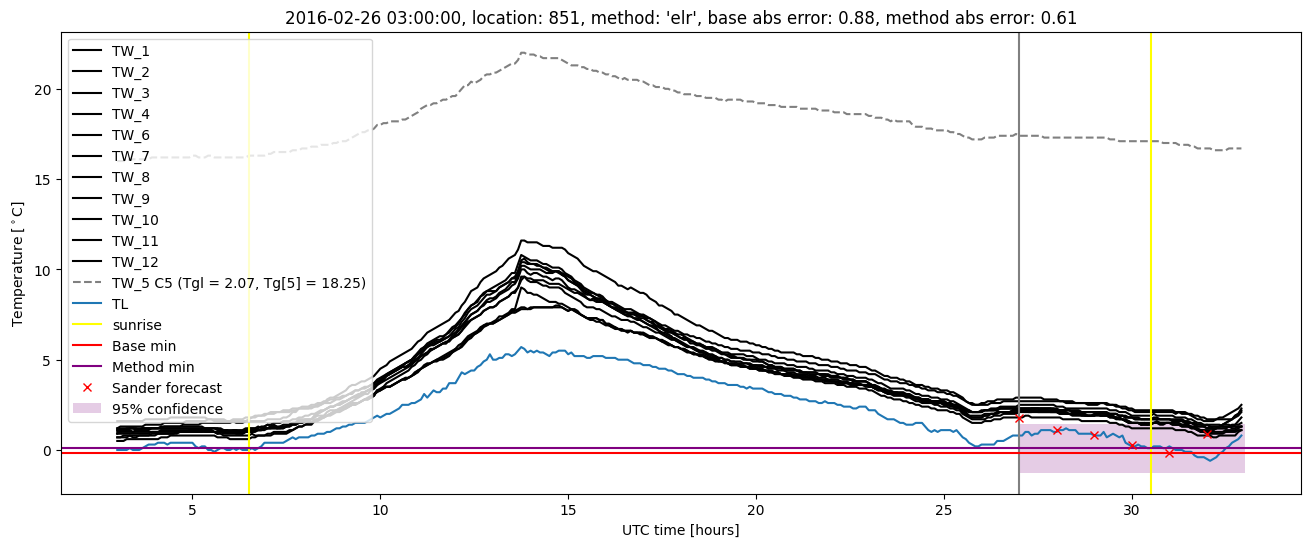
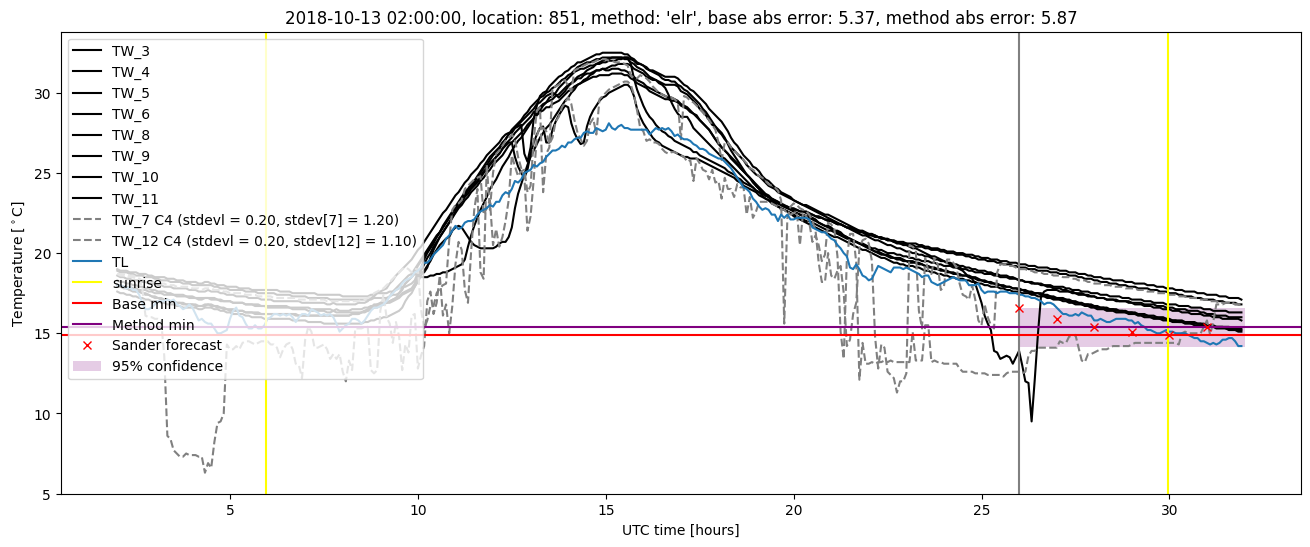
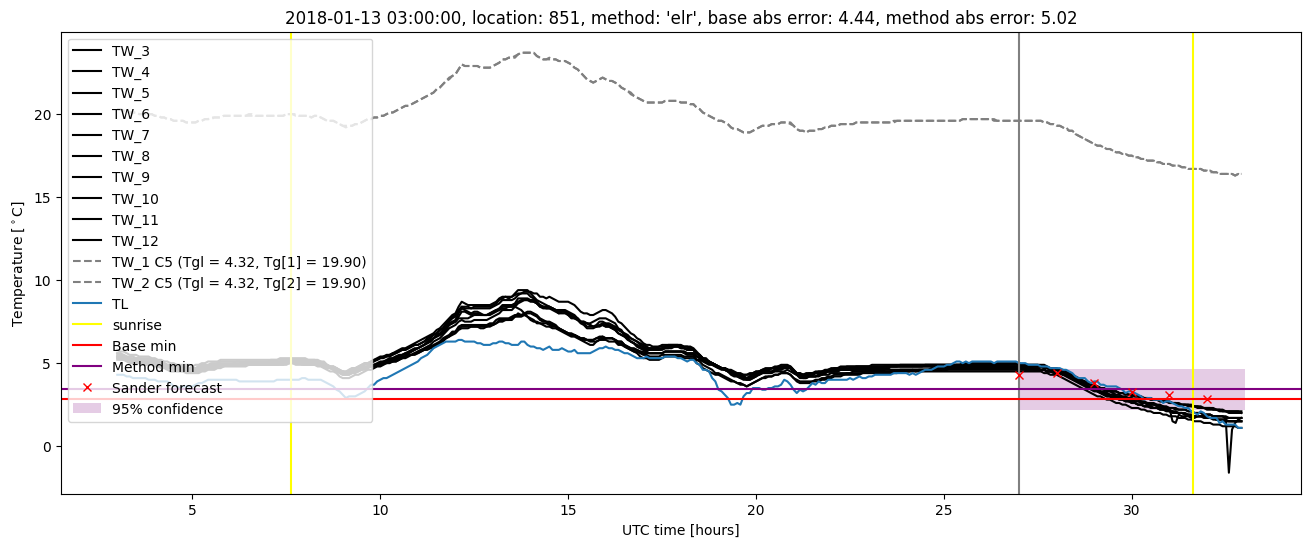
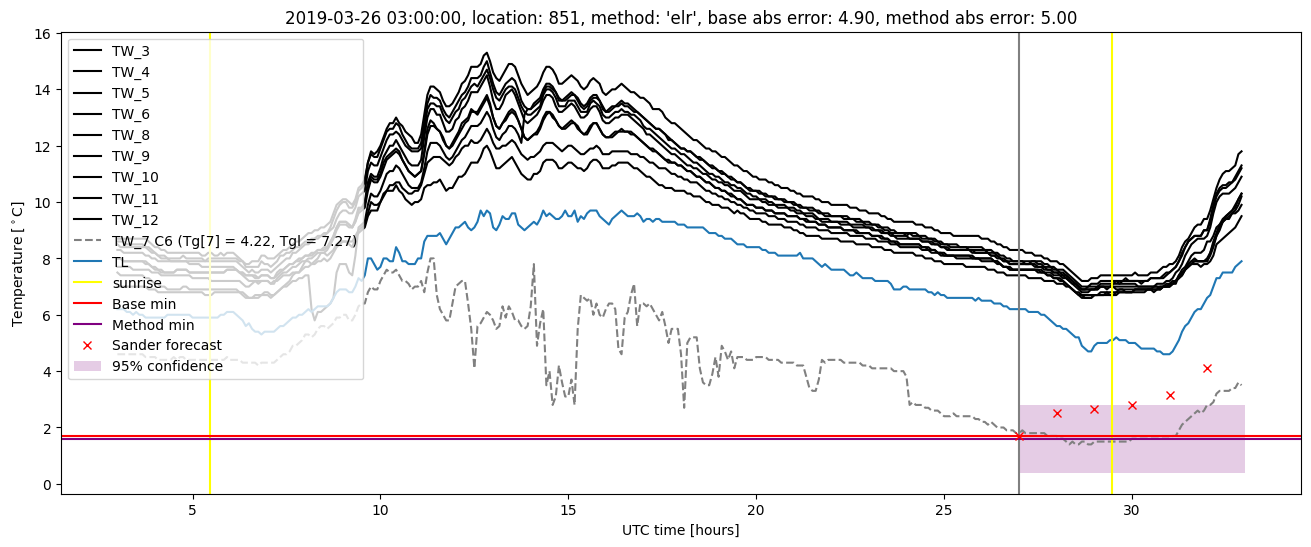
Extended logistic regression results
| names |
period |
power |
significance |
meanSquareError |
absError |
maxError |
CRPS |
IGN |
| baseline |
winter 2016 |
0.965 |
0.143 |
0.448 |
0.494 |
2.591 |
NaN |
NaN |
| elr |
winter 2016 |
0.977 |
0.095 |
0.449 |
0.498 |
3.034 |
0.470 |
1.285 |
| baseline |
winter 2017 |
0.983 |
0.081 |
0.591 |
0.526 |
3.139 |
NaN |
NaN |
| elr |
winter 2017 |
0.974 |
0.108 |
0.527 |
0.512 |
3.311 |
0.478 |
1.349 |
| baseline |
winter 2018 |
0.978 |
0.179 |
0.769 |
0.587 |
4.442 |
NaN |
NaN |
| elr |
winter 2018 |
0.986 |
0.205 |
0.725 |
0.543 |
5.018 |
0.443 |
1.297 |
| baseline |
winter 2019 |
0.985 |
0.045 |
1.083 |
0.608 |
5.369 |
NaN |
NaN |
| elr |
winter 2019 |
0.993 |
0.091 |
1.021 |
0.560 |
5.868 |
0.424 |
1.254 |
| baseline |
all |
0.977 |
0.118 |
0.712 |
0.552 |
5.369 |
NaN |
NaN |
| elr |
all |
0.982 |
0.135 |
0.672 |
0.527 |
5.868 |
0.454 |
1.295 |
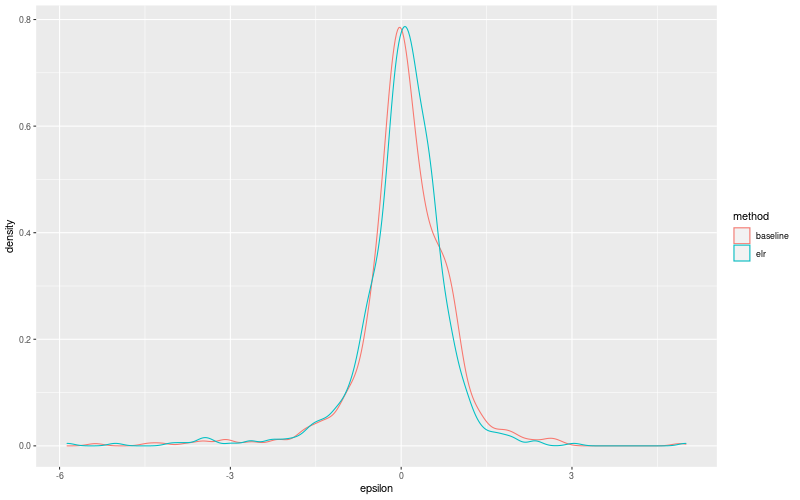
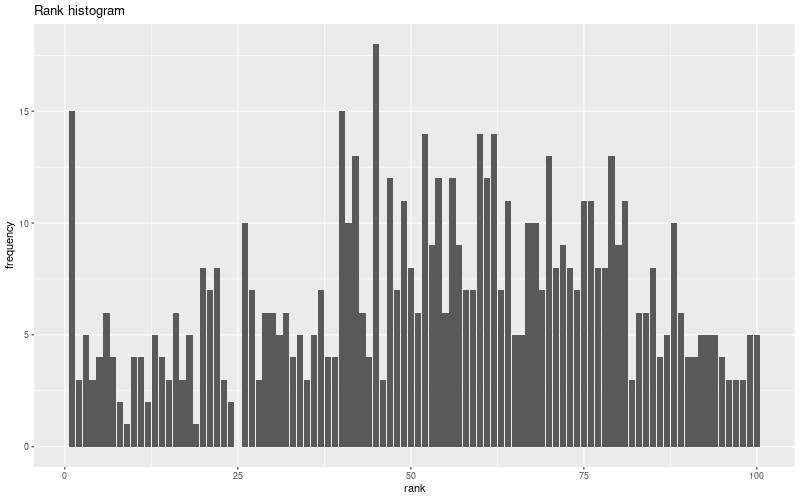
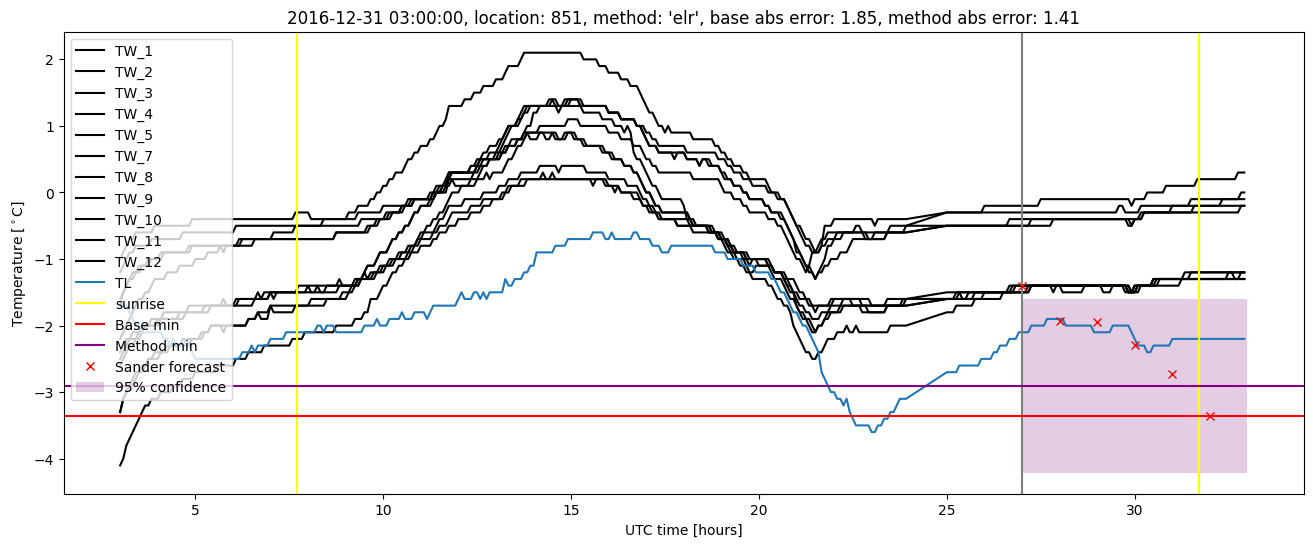
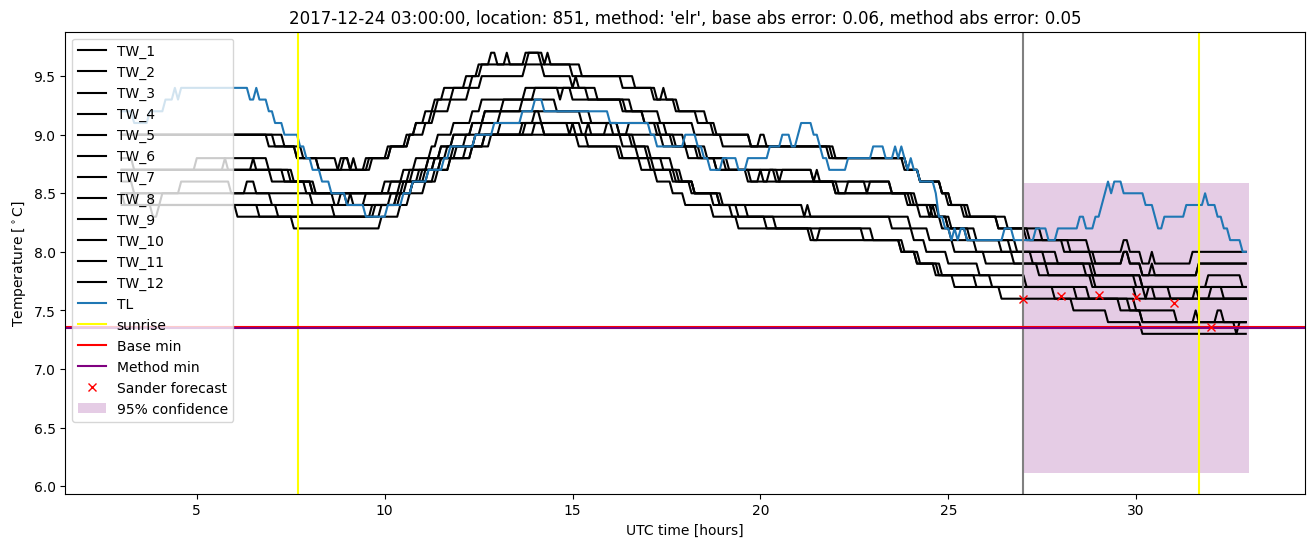
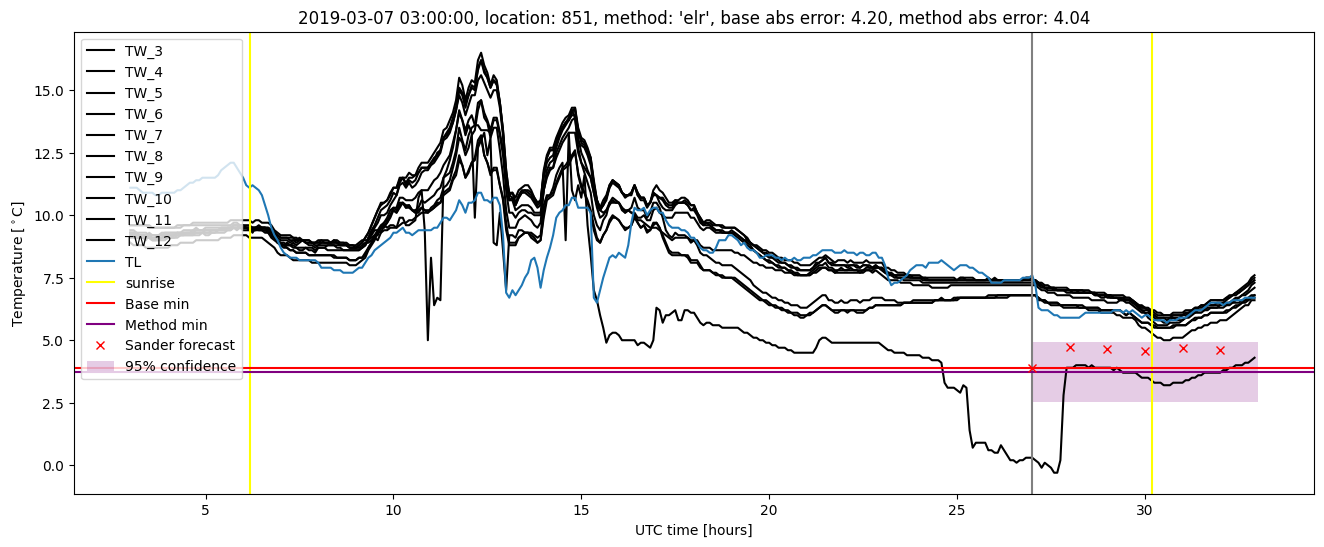
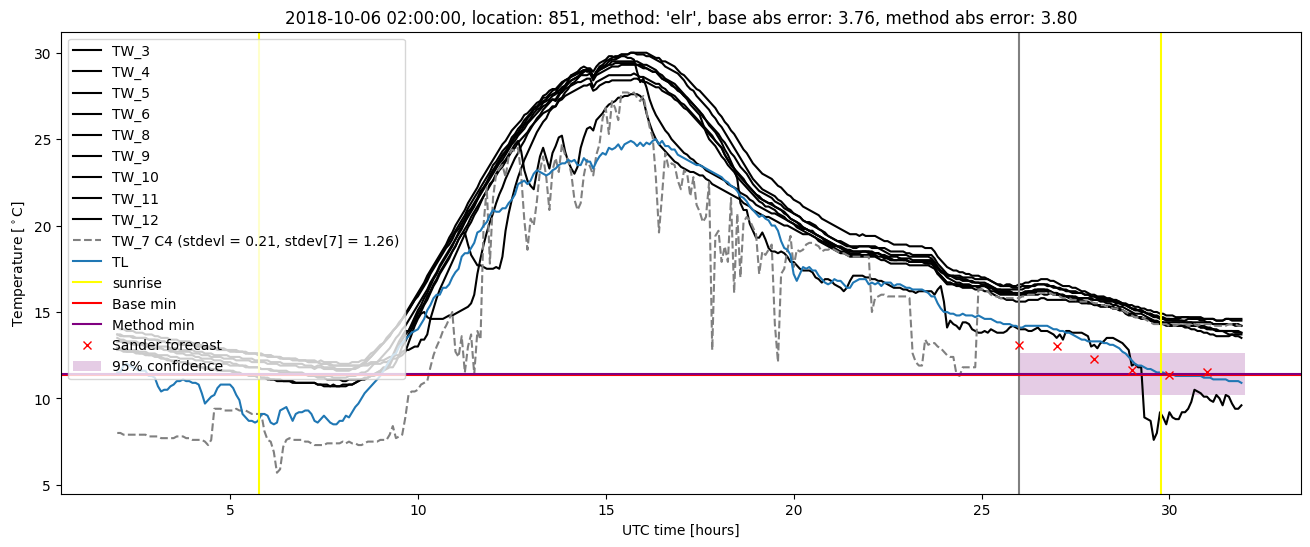
Extended logistic regression plots