GMS location: 850
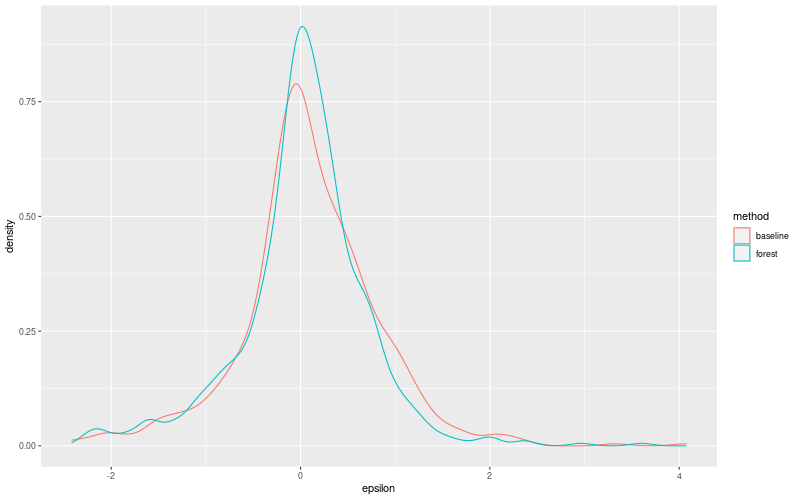
Random forest results
| names |
period |
power |
significance |
meanSquareError |
absError |
maxError |
CRPS |
IGN |
| baseline |
winter 2016 |
0.972 |
0.087 |
0.466 |
0.491 |
2.400 |
NaN |
NaN |
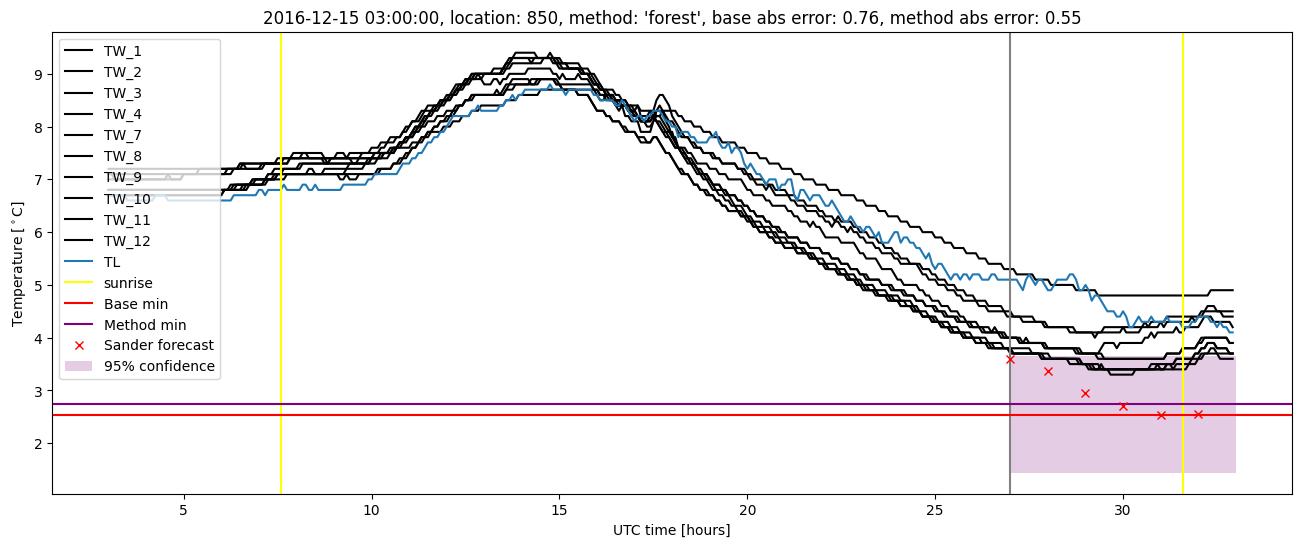
| forest |
winter 2016 |
0.983 |
0.043 |
0.401 |
0.449 |
2.375 |
0.444 |
1.654 |
| baseline |
winter 2017 |
0.972 |
0.051 |
0.411 |
0.461 |
2.416 |
NaN |
NaN |
| forest |
winter 2017 |
0.963 |
0.000e+00 |
0.333 |
0.413 |
2.091 |
0.428 |
1.406 |
| baseline |
winter 2018 |
0.993 |
0.035 |
0.478 |
0.519 |
2.210 |
NaN |
NaN |
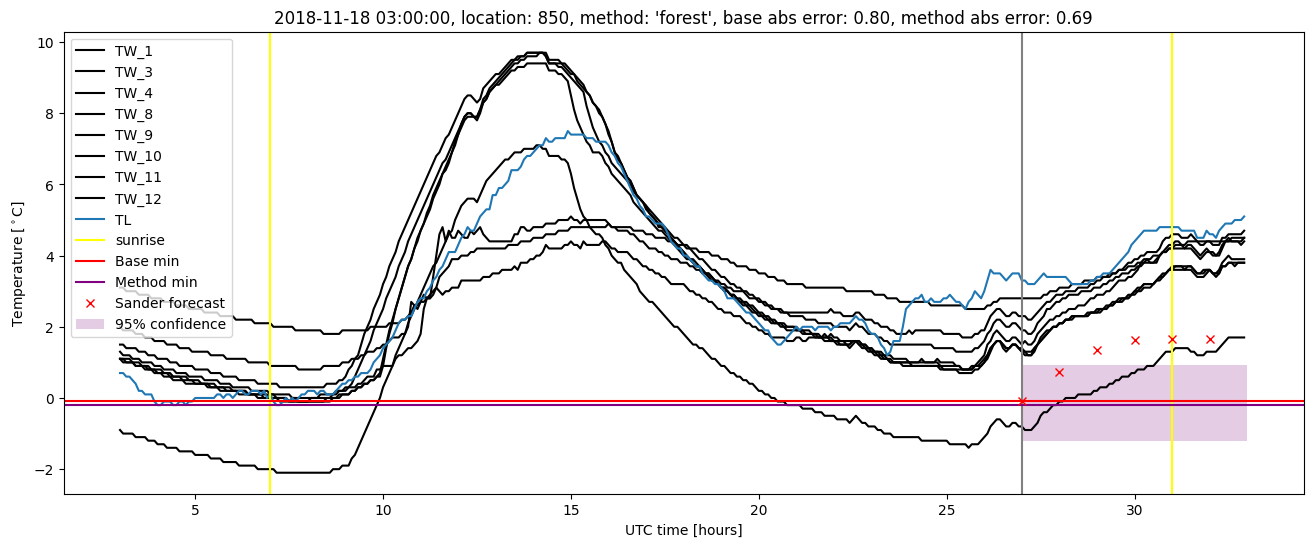
| forest |
winter 2018 |
0.985 |
0.000e+00 |
0.395 |
0.474 |
2.049 |
0.433 |
1.290 |
| baseline |
winter 2019 |
0.980 |
0.095 |
0.945 |
0.683 |
4.074 |
NaN |
NaN |
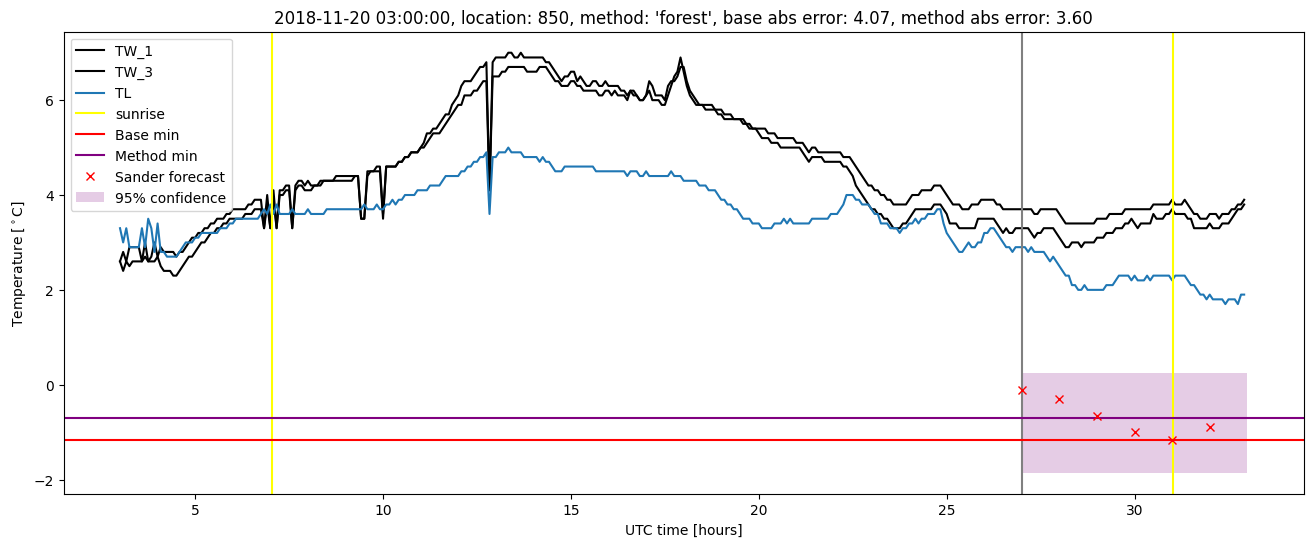
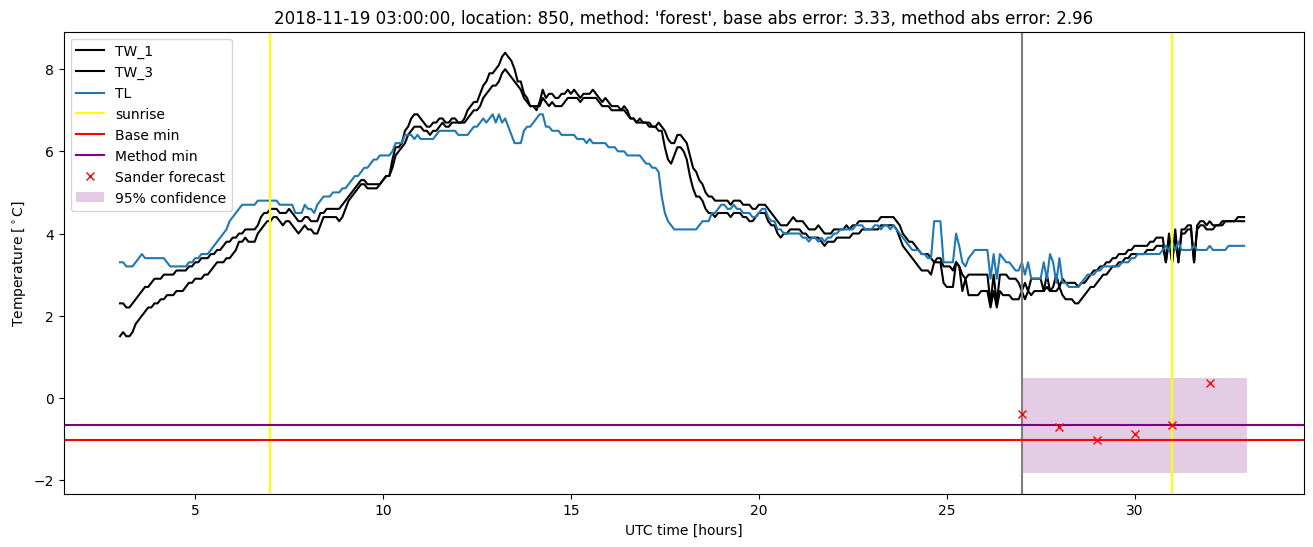
| forest |
winter 2019 |
0.980 |
0.143 |
0.835 |
0.606 |
3.604 |
0.403 |
1.546 |
| baseline |
all |
0.979 |
0.062 |
0.548 |
0.528 |
4.074 |
NaN |
NaN |
| forest |
all |
0.979 |
0.036 |
0.467 |
0.477 |
3.604 |
0.430 |
1.481 |
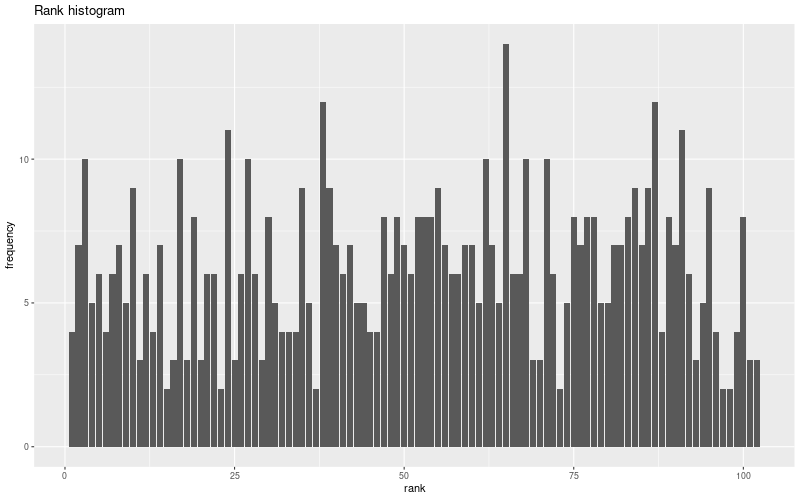
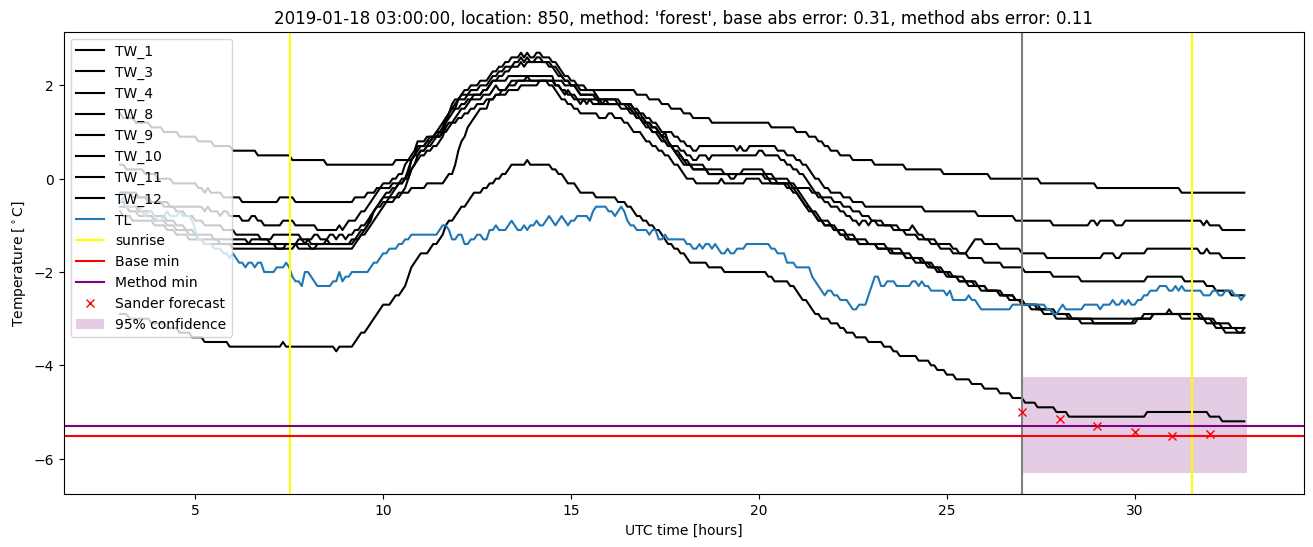
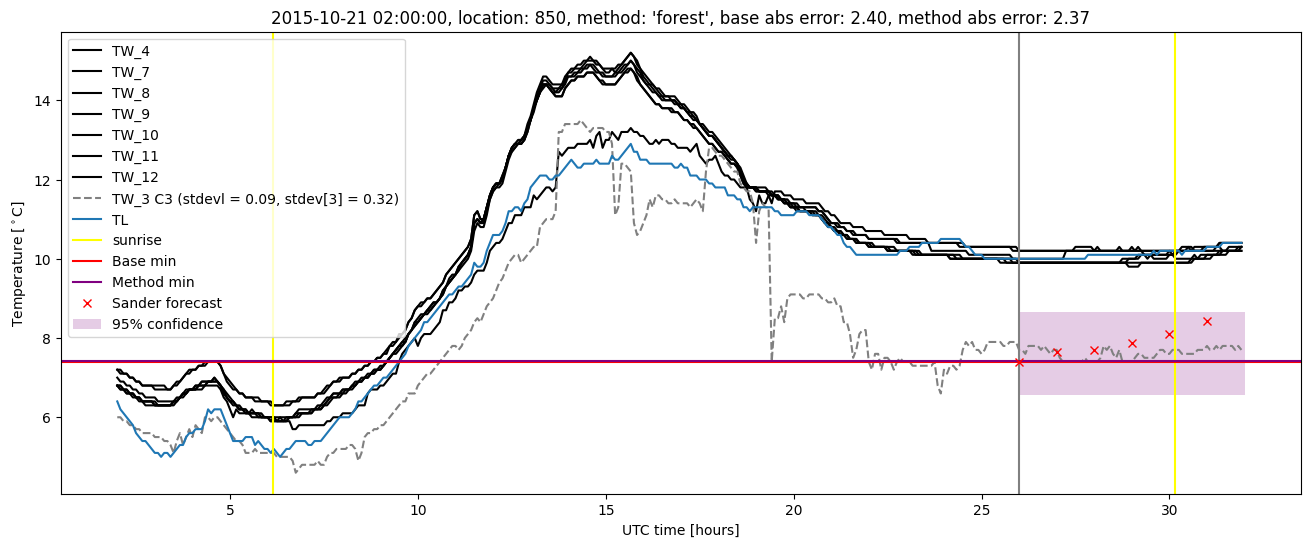
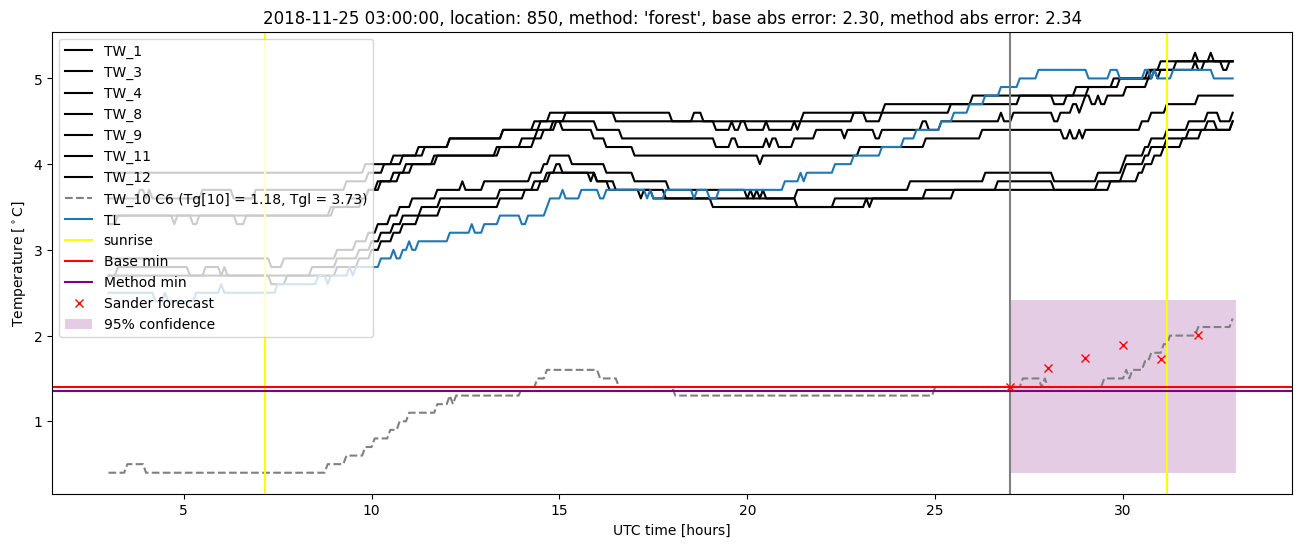
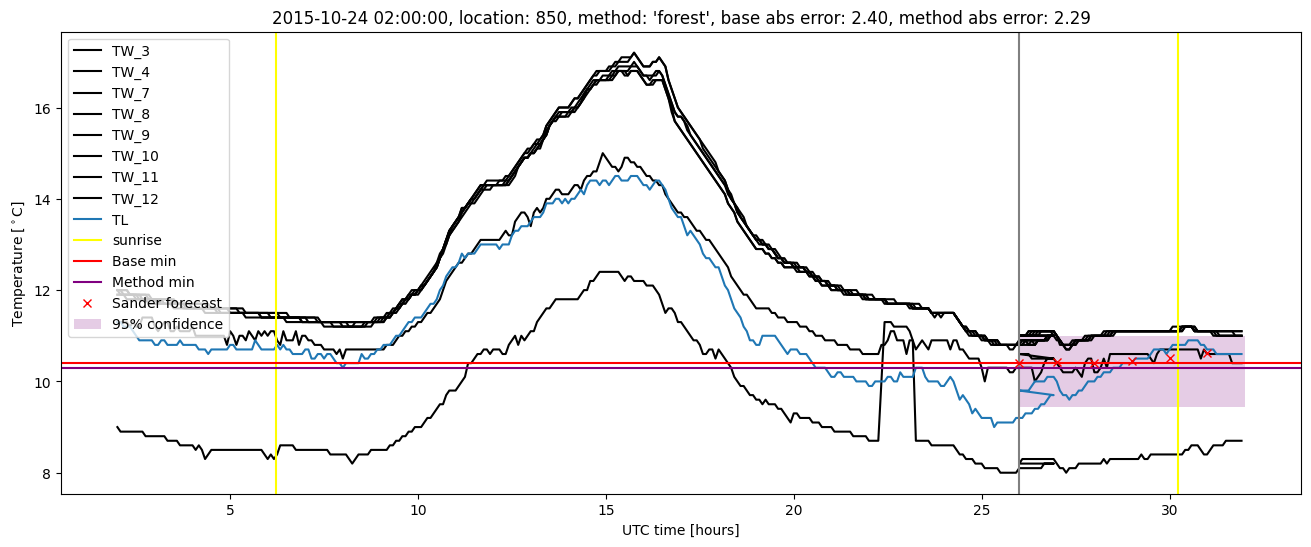
Random forest plots
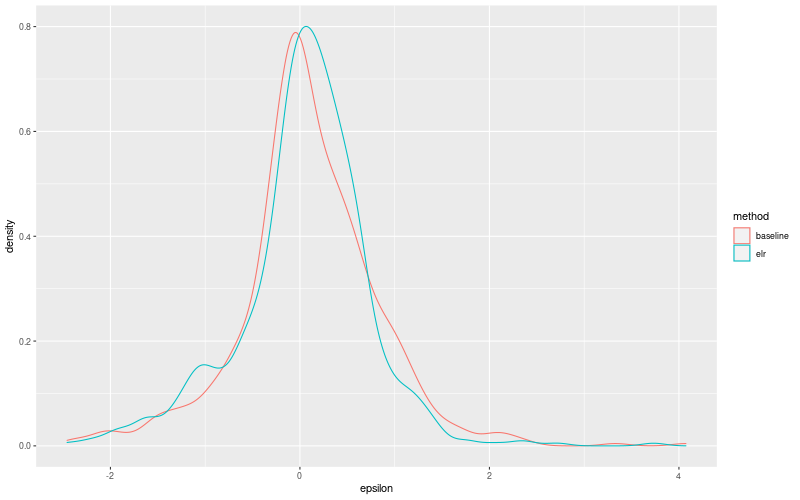
Extended logistic regression results
| names |
period |
power |
significance |
meanSquareError |
absError |
maxError |
CRPS |
IGN |
| baseline |
winter 2016 |
0.972 |
0.087 |
0.466 |
0.491 |
2.400 |
NaN |
NaN |
| elr |
winter 2016 |
0.967 |
0.043 |
0.415 |
0.484 |
2.396 |
0.501 |
1.774 |
| baseline |
winter 2017 |
0.972 |
0.051 |
0.411 |
0.461 |
2.416 |
NaN |
NaN |
| elr |
winter 2017 |
0.972 |
0.026 |
0.346 |
0.434 |
2.237 |
0.465 |
1.511 |
| baseline |
winter 2018 |
0.993 |
0.035 |
0.478 |
0.519 |
2.210 |
NaN |
NaN |
| elr |
winter 2018 |
0.978 |
0.069 |
0.395 |
0.476 |
1.942 |
0.475 |
1.643 |
| baseline |
winter 2019 |
0.980 |
0.095 |
0.945 |
0.683 |
4.074 |
NaN |
NaN |
| elr |
winter 2019 |
0.980 |
0.191 |
0.820 |
0.625 |
3.732 |
0.457 |
1.974 |
| baseline |
all |
0.979 |
0.062 |
0.548 |
0.528 |
4.074 |
NaN |
NaN |
| elr |
all |
0.973 |
0.071 |
0.471 |
0.497 |
3.732 |
0.477 |
1.717 |
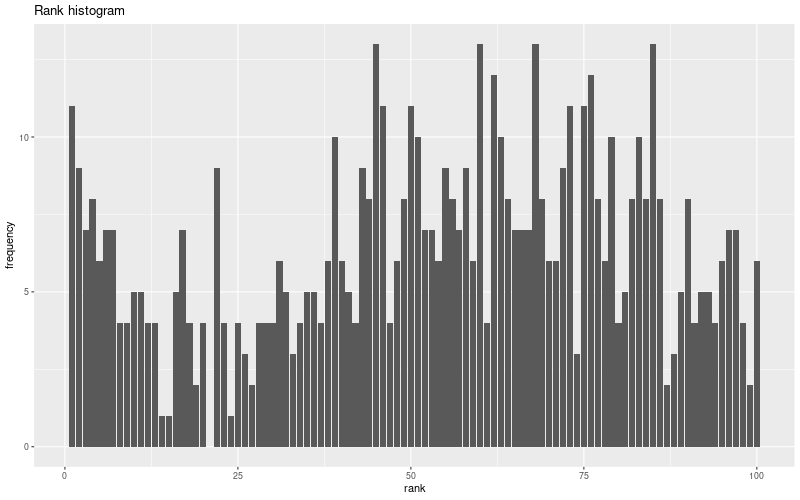
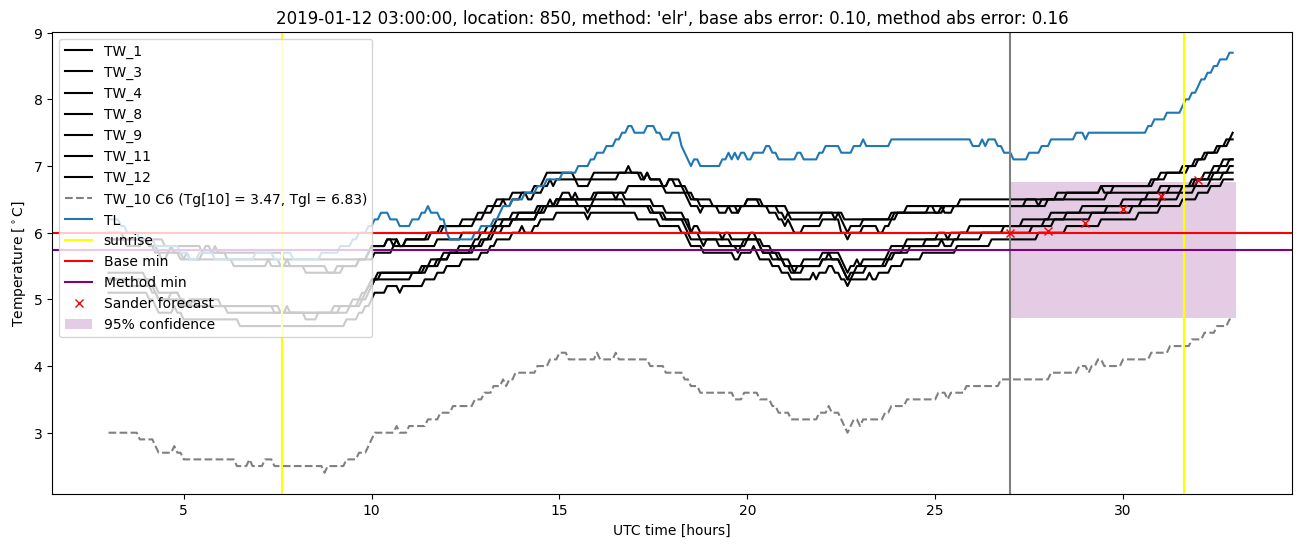
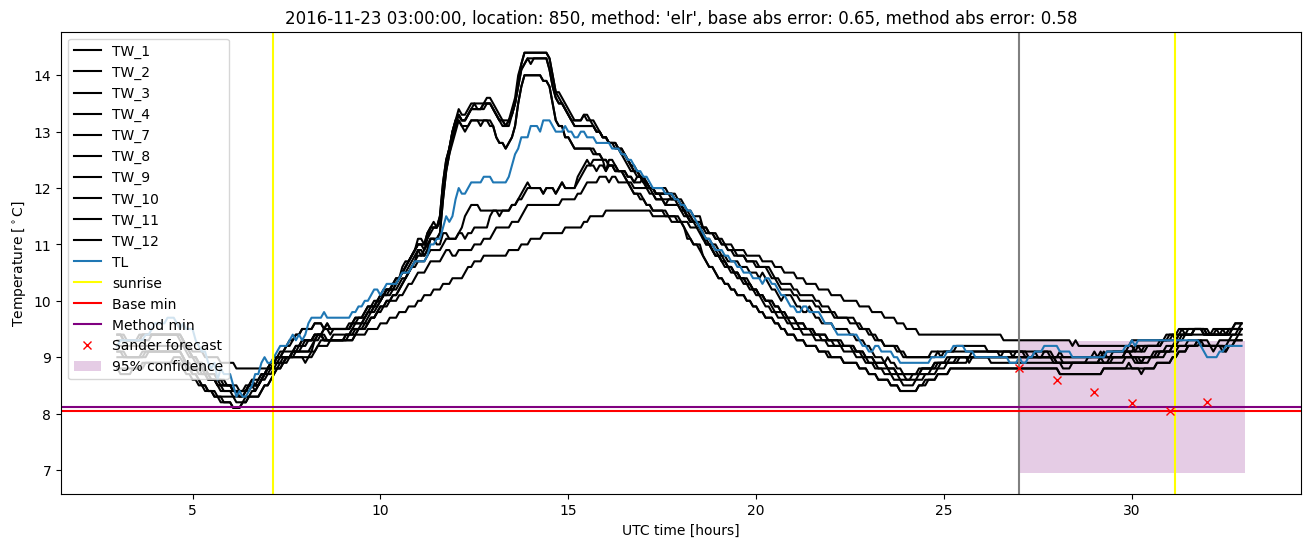
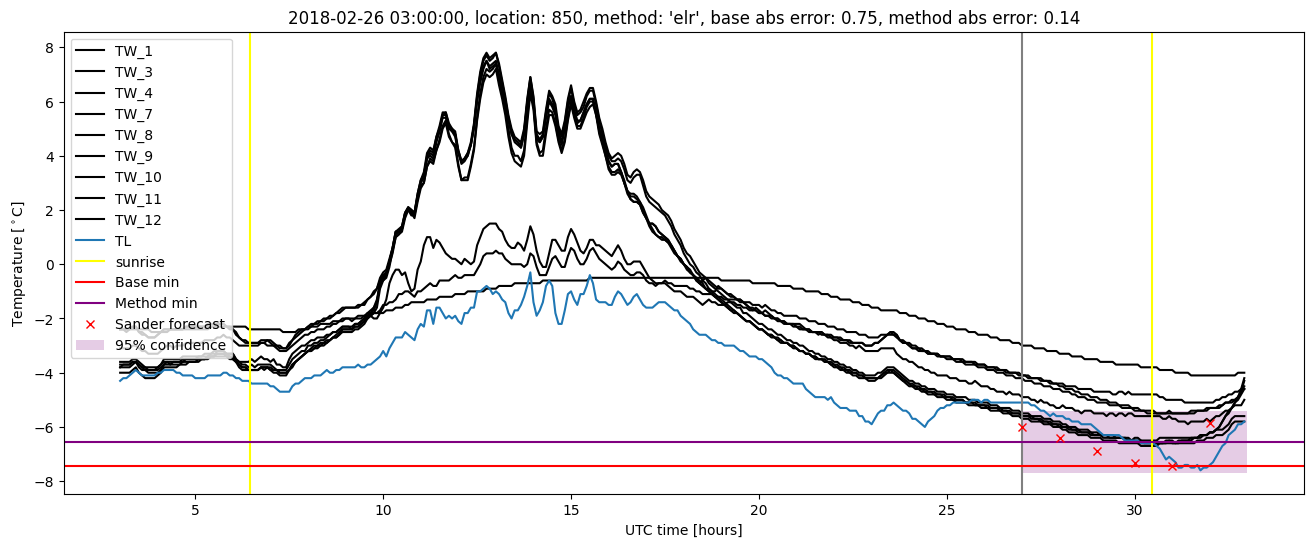
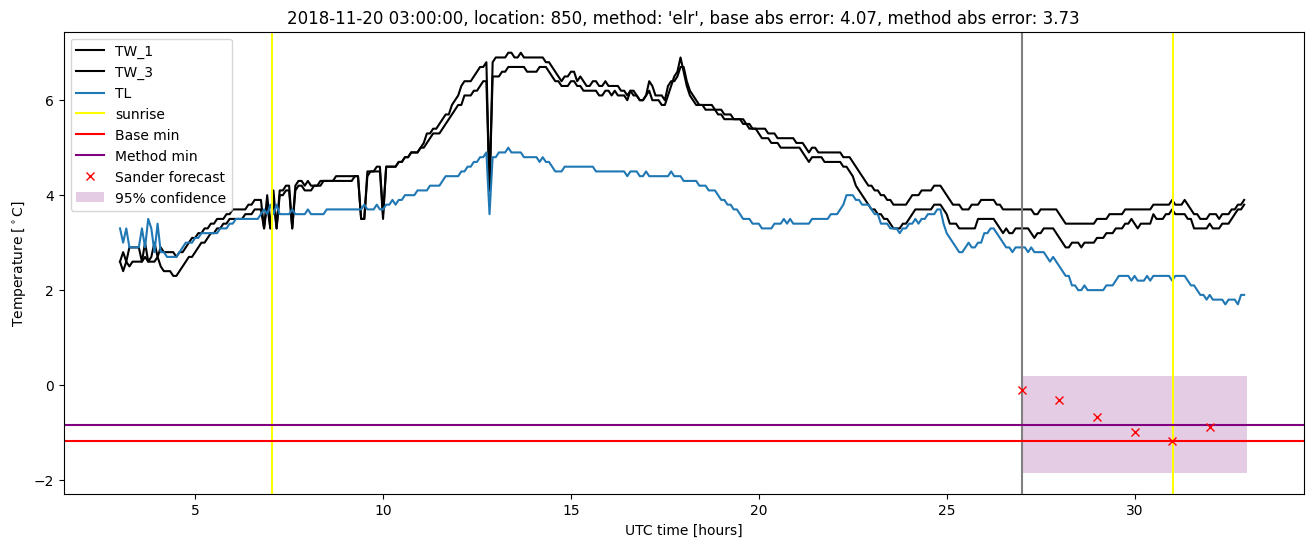
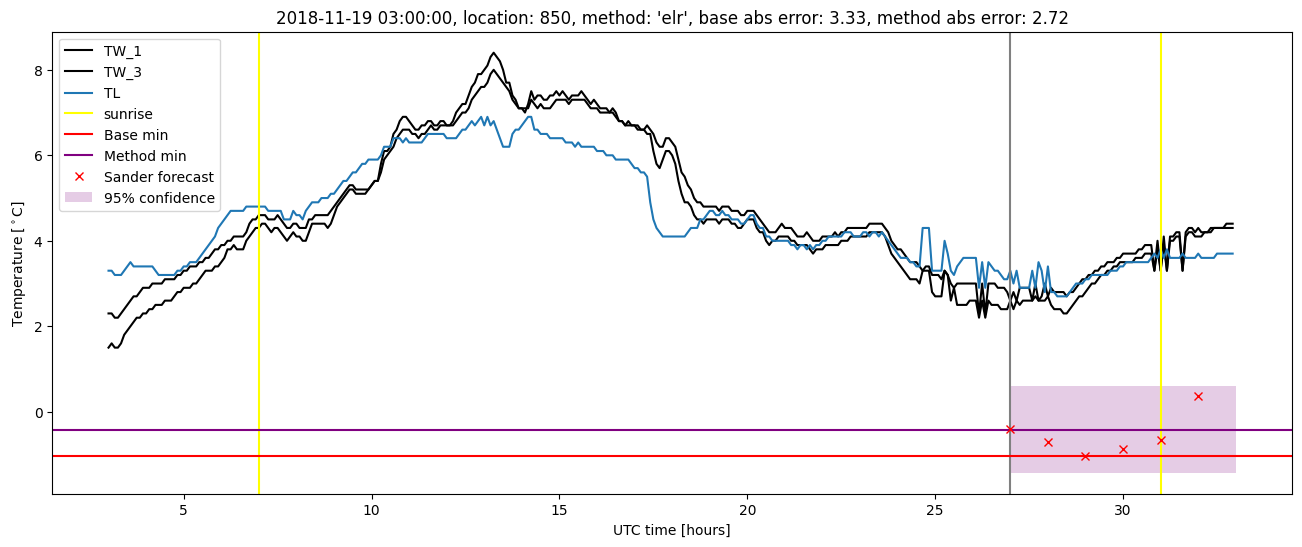
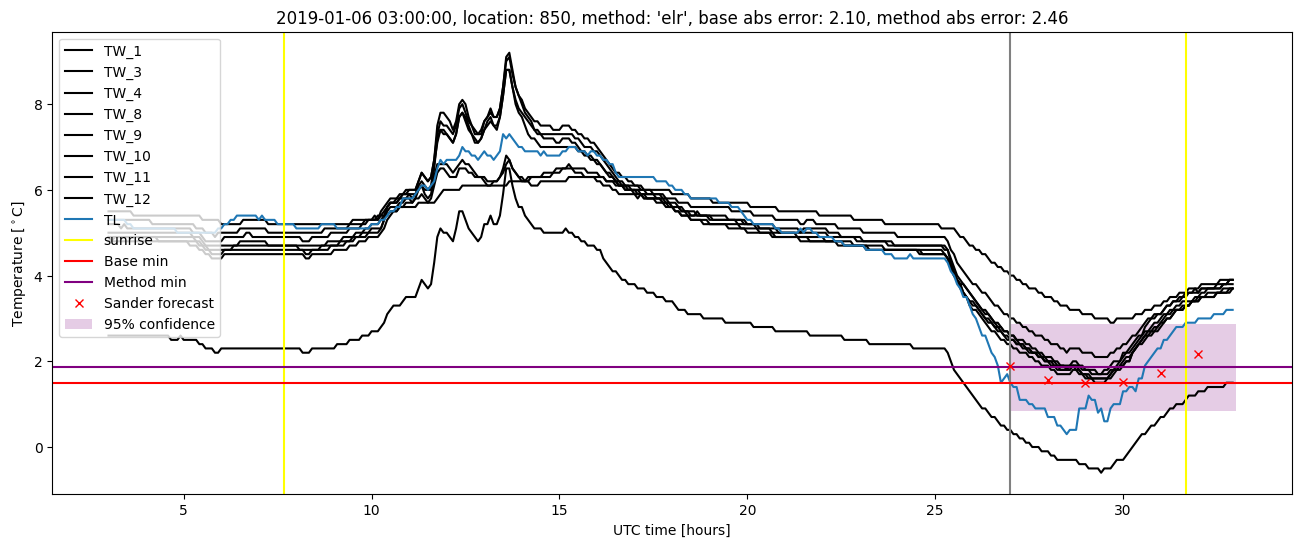
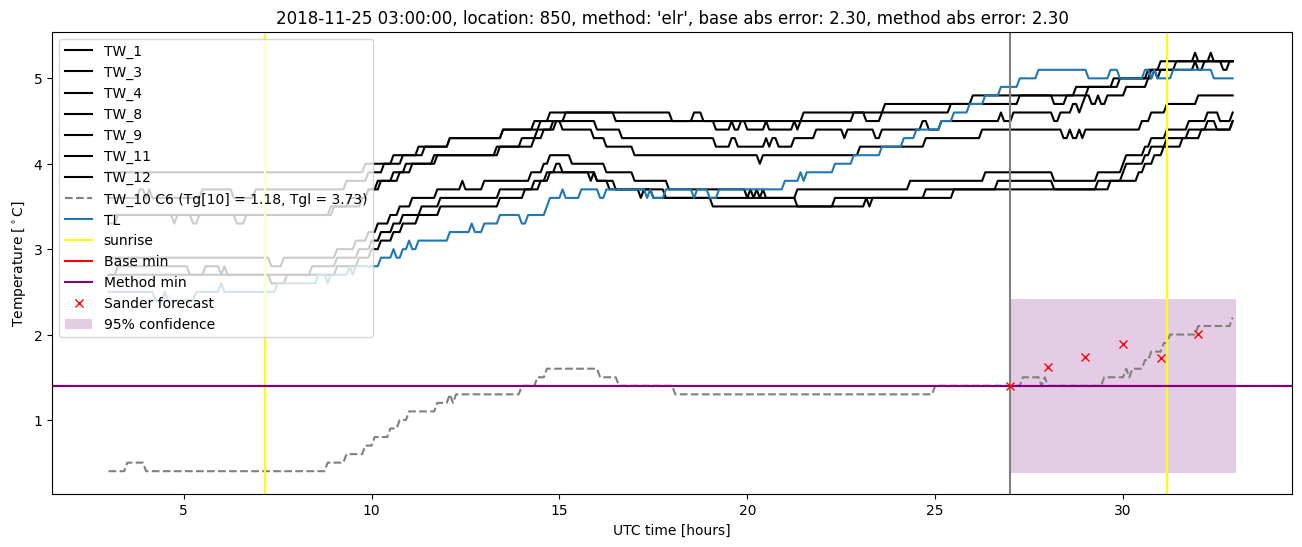
Extended logistic regression plots