GMS location: 841
Random forest results
| names |
period |
power |
significance |
meanSquareError |
absError |
maxError |
CRPS |
IGN |
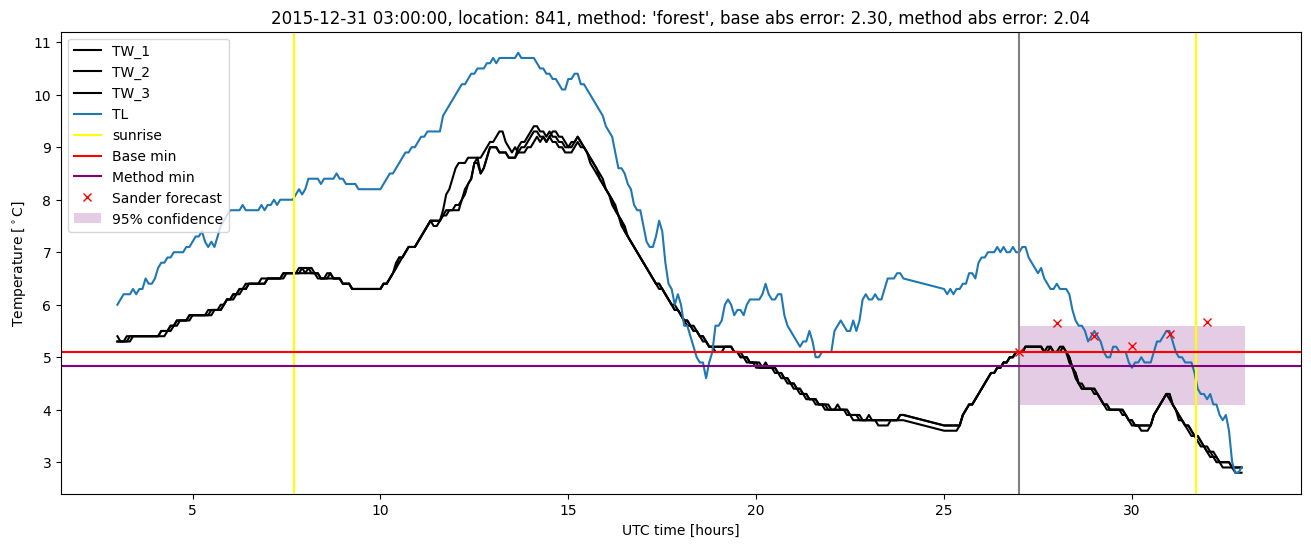
| baseline |
winter 2016 |
0.972 |
0.000e+00 |
0.306 |
0.381 |
2.300 |
NaN |
NaN |
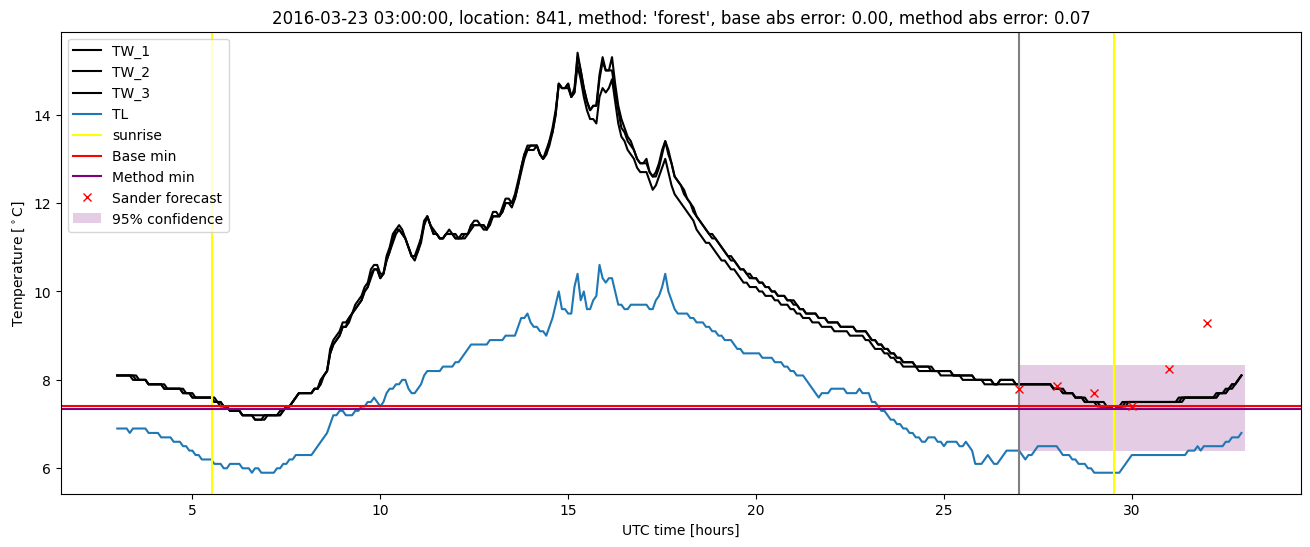
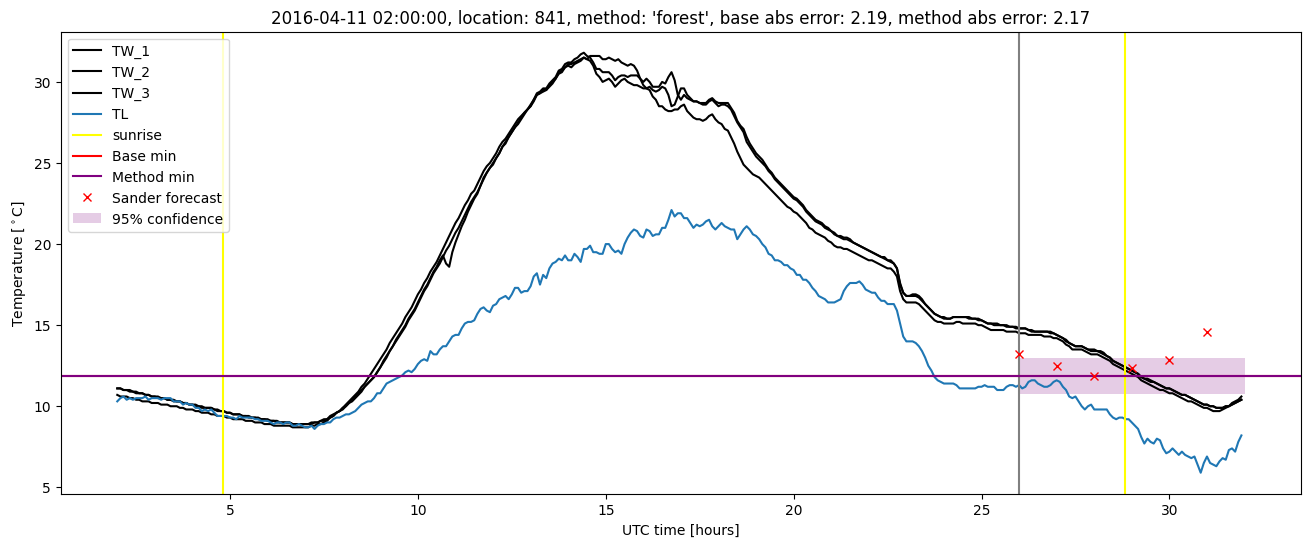
| forest |
winter 2016 |
0.989 |
0.067 |
0.282 |
0.361 |
2.166 |
0.456 |
3.290 |
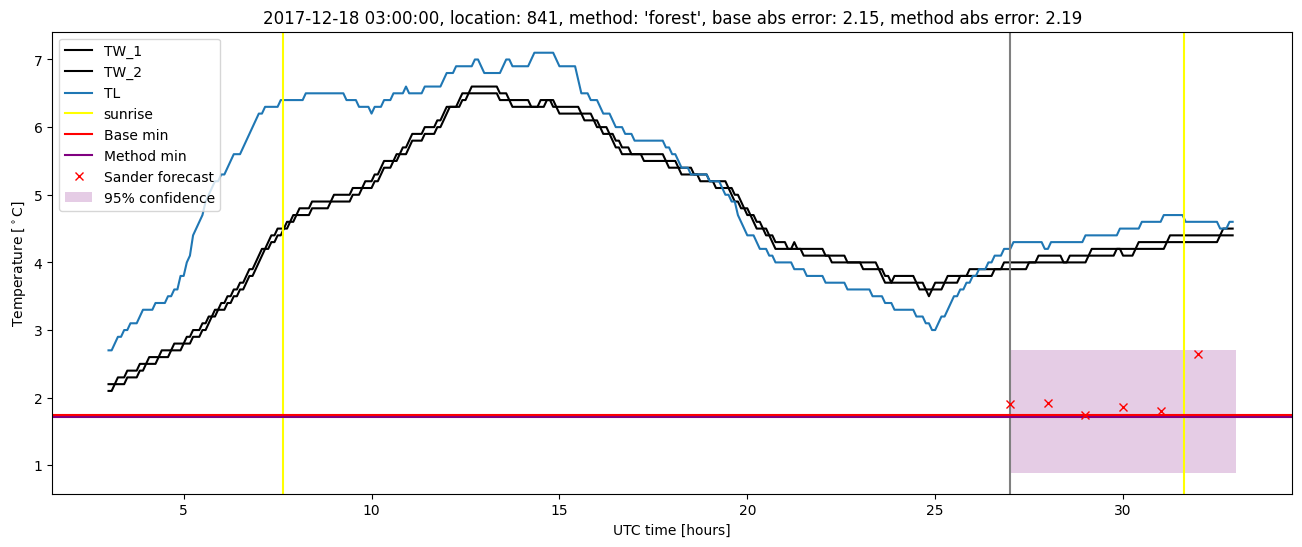
| baseline |
winter 2017 |
0.983 |
0.088 |
0.344 |
0.412 |
2.200 |
NaN |
NaN |
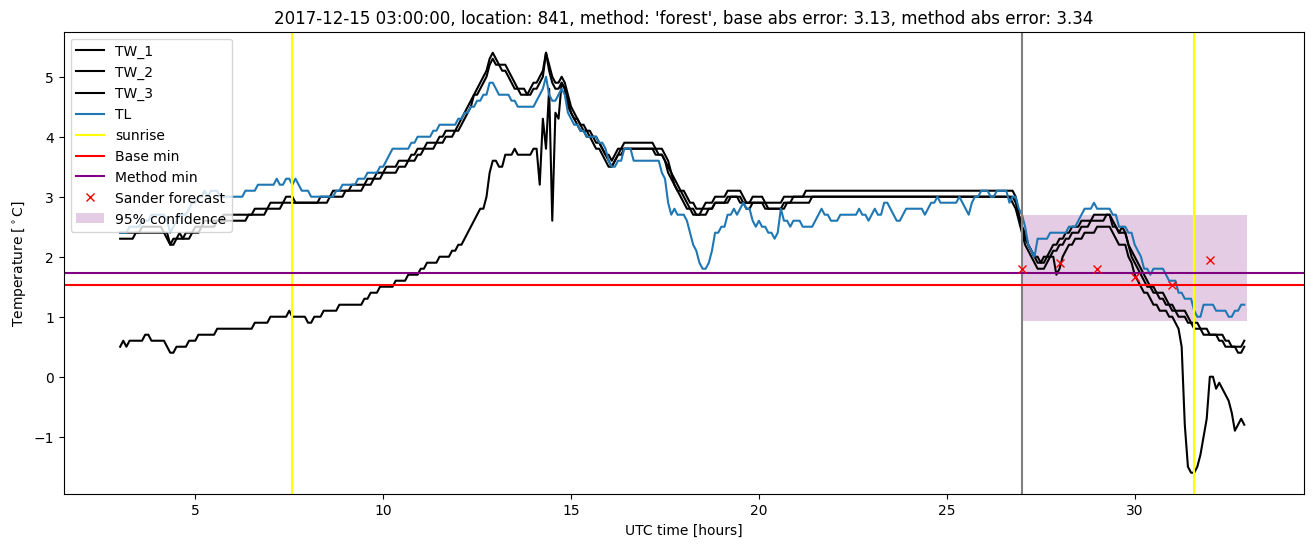
| forest |
winter 2017 |
0.983 |
0.088 |
0.295 |
0.383 |
1.823 |
0.432 |
2.347 |
| baseline |
winter 2018 |
0.980 |
0.074 |
0.429 |
0.455 |
3.126 |
NaN |
NaN |
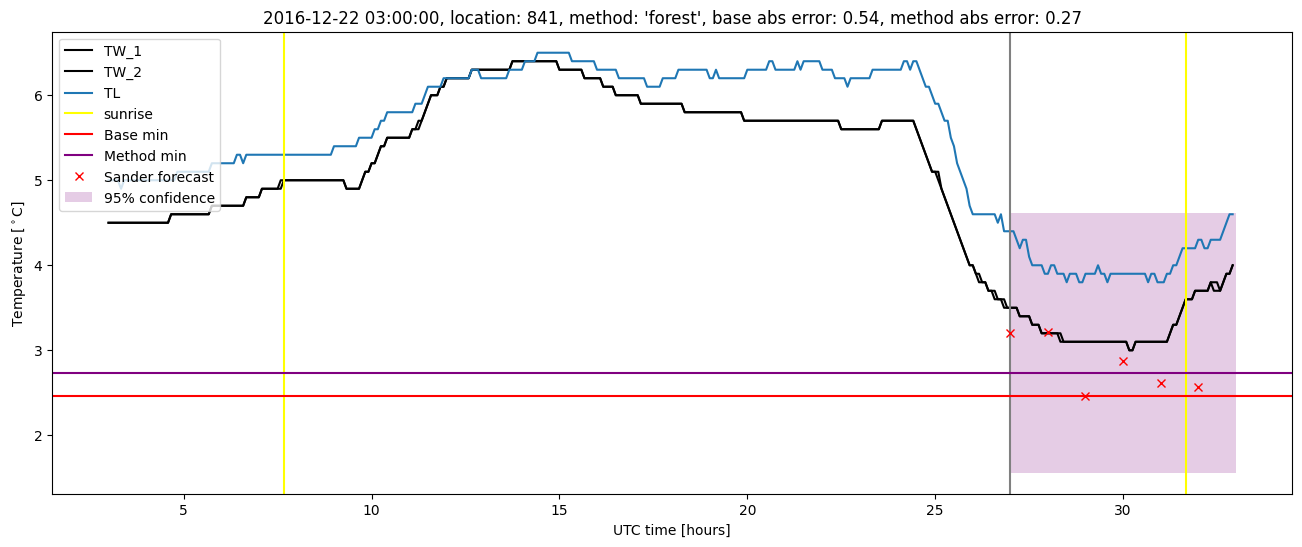
| forest |
winter 2018 |
0.980 |
0.111 |
0.411 |
0.455 |
3.336 |
0.446 |
3.077 |
| baseline |
winter 2019 |
0.979 |
0.000e+00 |
0.316 |
0.399 |
2.402 |
NaN |
NaN |
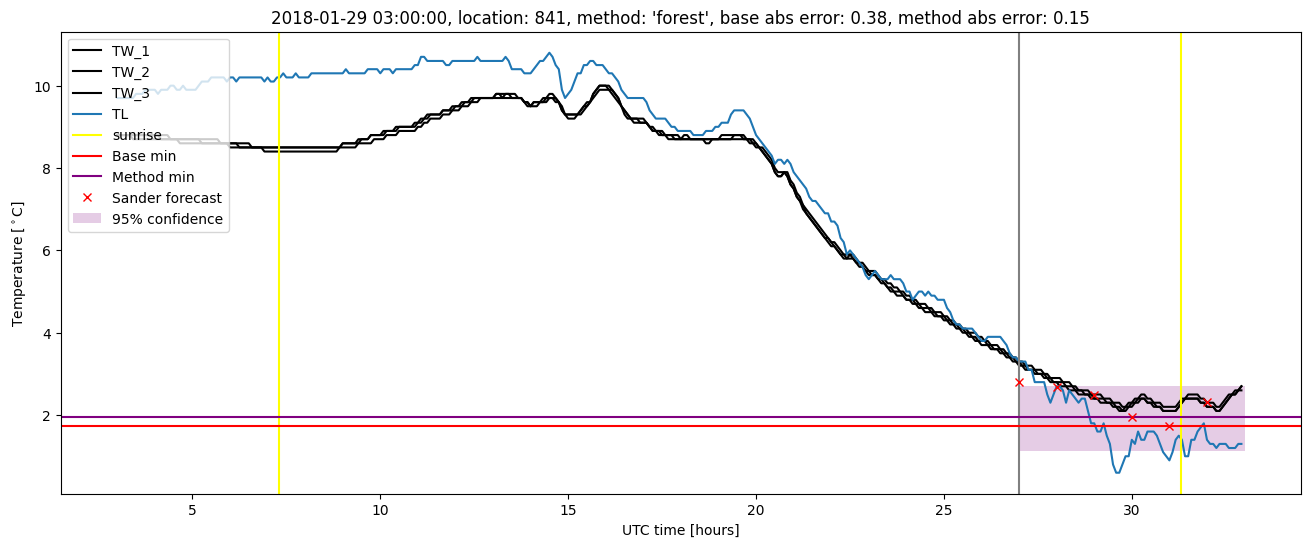
| forest |
winter 2019 |
0.986 |
0.118 |
0.266 |
0.388 |
1.636 |
0.442 |
2.156 |
| baseline |
all |
0.978 |
0.054 |
0.349 |
0.411 |
3.126 |
NaN |
NaN |
| forest |
all |
0.985 |
0.097 |
0.315 |
0.397 |
3.336 |
0.445 |
2.757 |
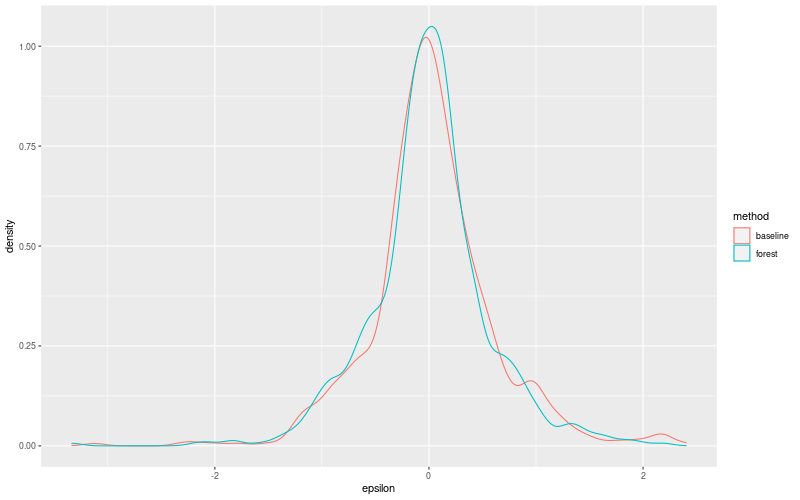
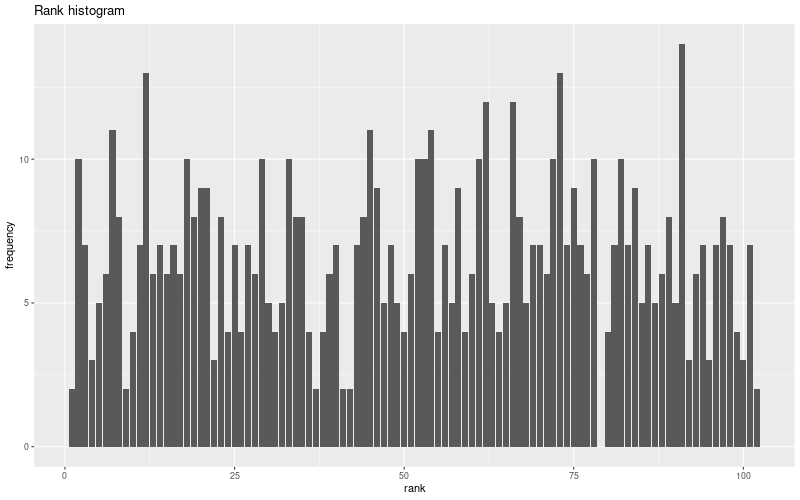
Random forest plots

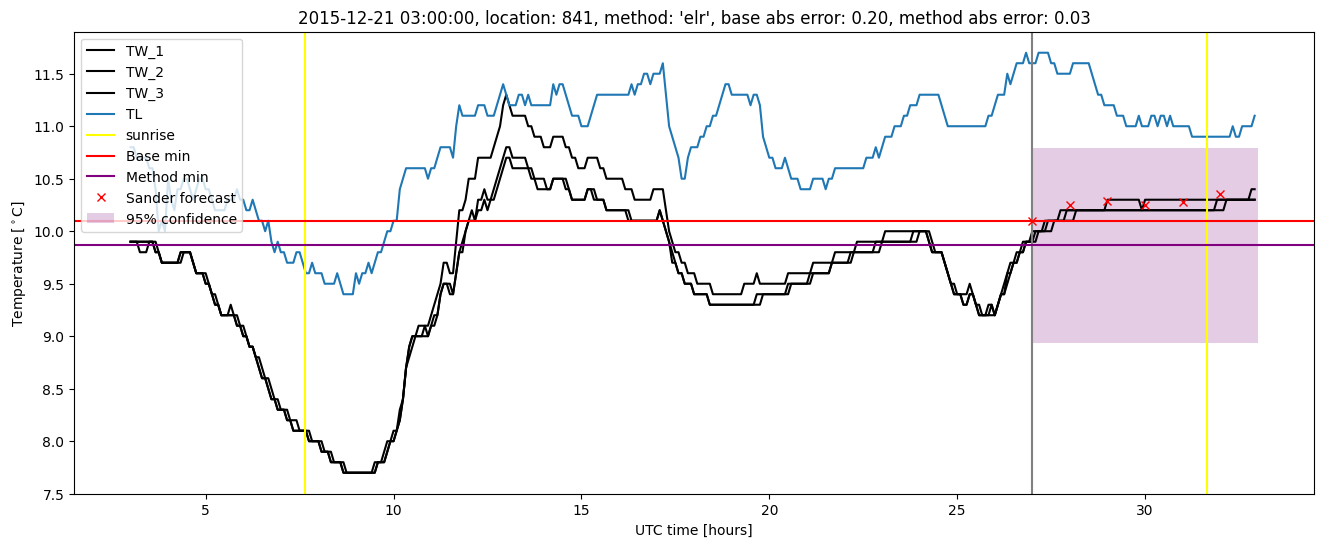
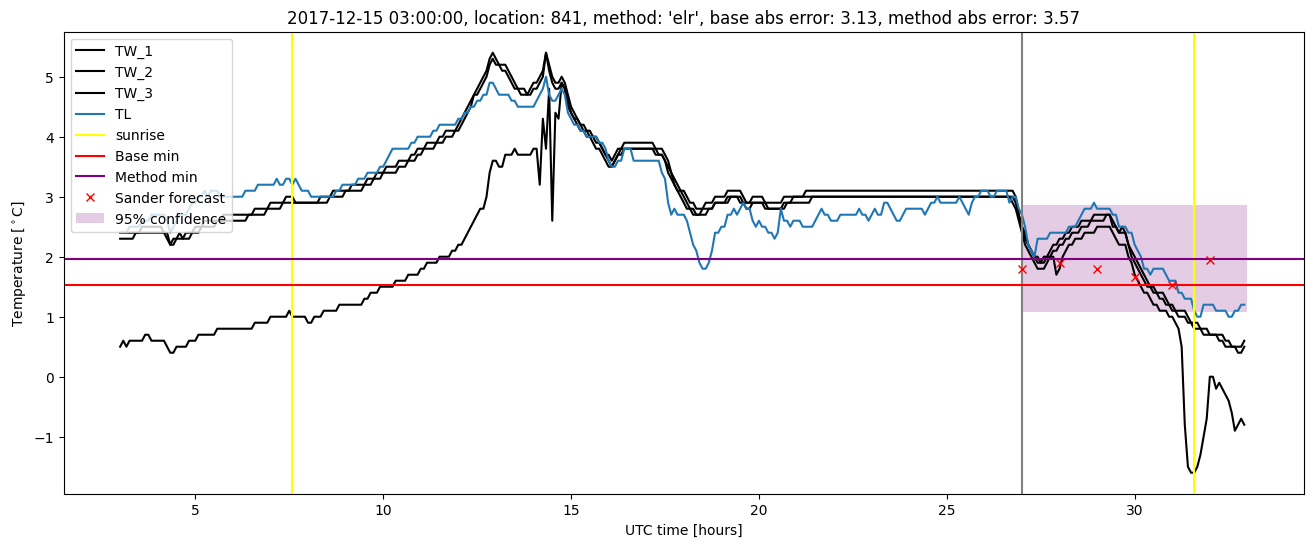
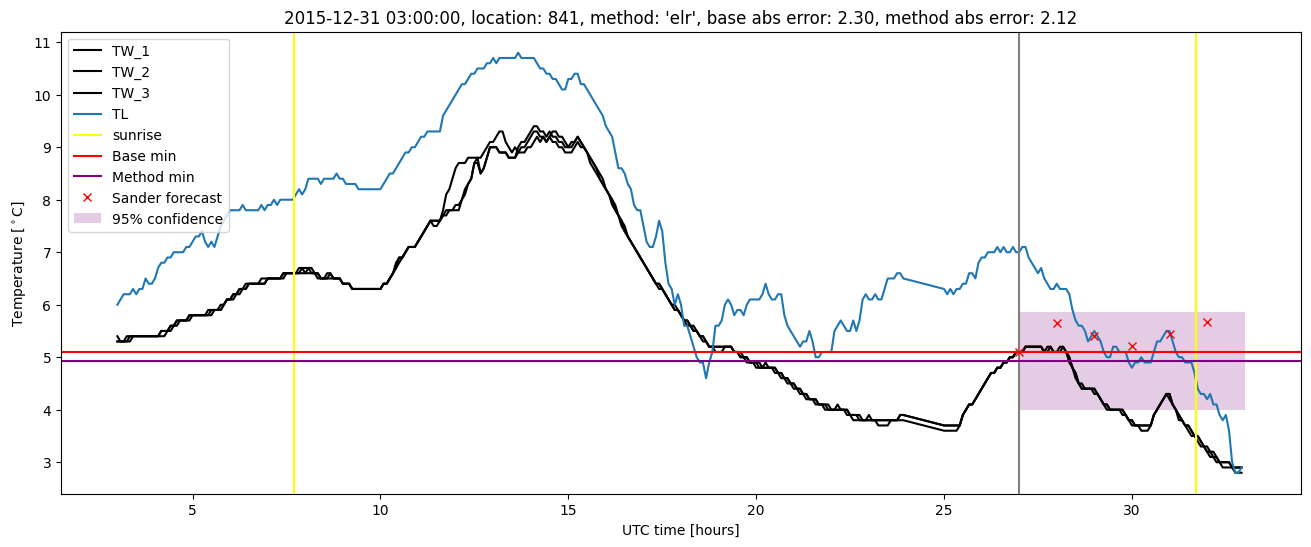
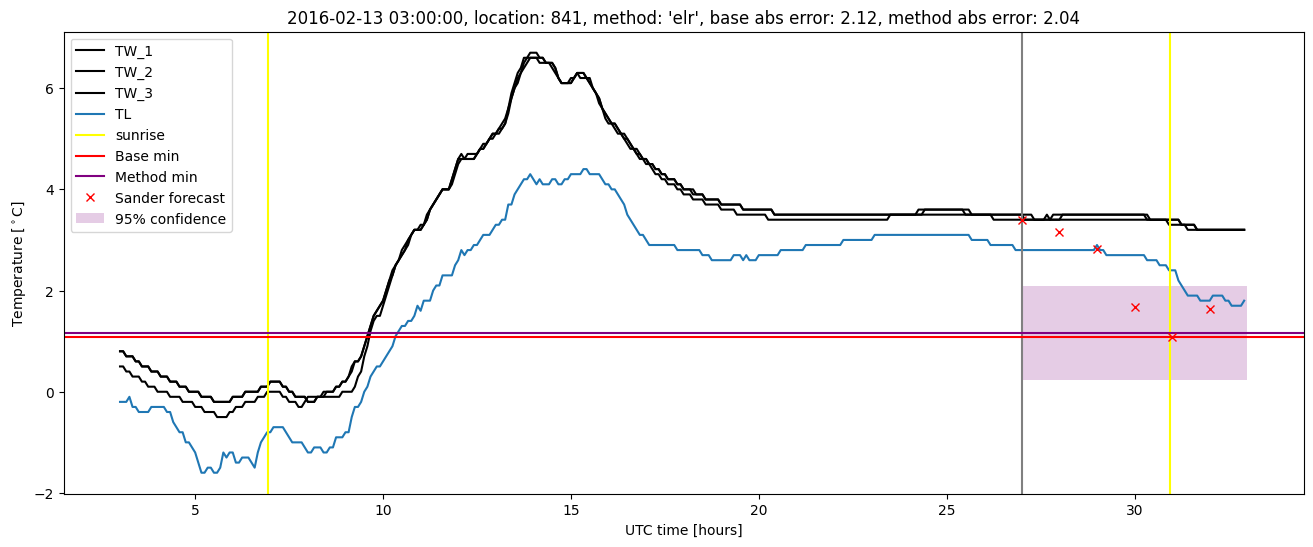
Extended logistic regression results
| names |
period |
power |
significance |
meanSquareError |
absError |
maxError |
CRPS |
IGN |
| baseline |
winter 2016 |
0.972 |
0.000e+00 |
0.306 |
0.381 |
2.300 |
NaN |
NaN |
| elr |
winter 2016 |
0.960 |
0.000e+00 |
0.322 |
0.406 |
2.125 |
0.514 |
3.300 |
| baseline |
winter 2017 |
0.983 |
0.088 |
0.344 |
0.412 |
2.200 |
NaN |
NaN |
| elr |
winter 2017 |
0.983 |
0.118 |
0.275 |
0.389 |
1.843 |
0.477 |
2.610 |
| baseline |
winter 2018 |
0.980 |
0.074 |
0.429 |
0.455 |
3.126 |
NaN |
NaN |
| elr |
winter 2018 |
0.980 |
0.111 |
0.392 |
0.446 |
3.567 |
0.480 |
3.352 |
| baseline |
winter 2019 |
0.979 |
0.000e+00 |
0.316 |
0.399 |
2.402 |
NaN |
NaN |
| elr |
winter 2019 |
0.979 |
0.118 |
0.242 |
0.376 |
1.321 |
0.457 |
2.273 |
| baseline |
all |
0.978 |
0.054 |
0.349 |
0.411 |
3.126 |
NaN |
NaN |
| elr |
all |
0.974 |
0.097 |
0.311 |
0.406 |
3.567 |
0.484 |
2.918 |
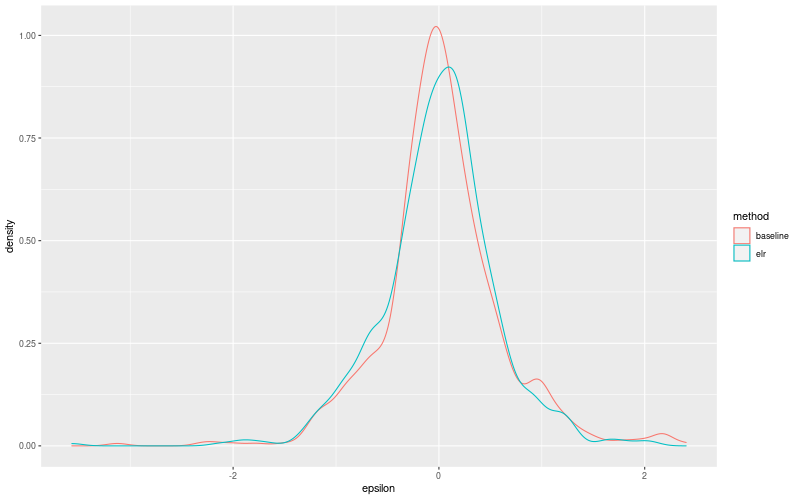
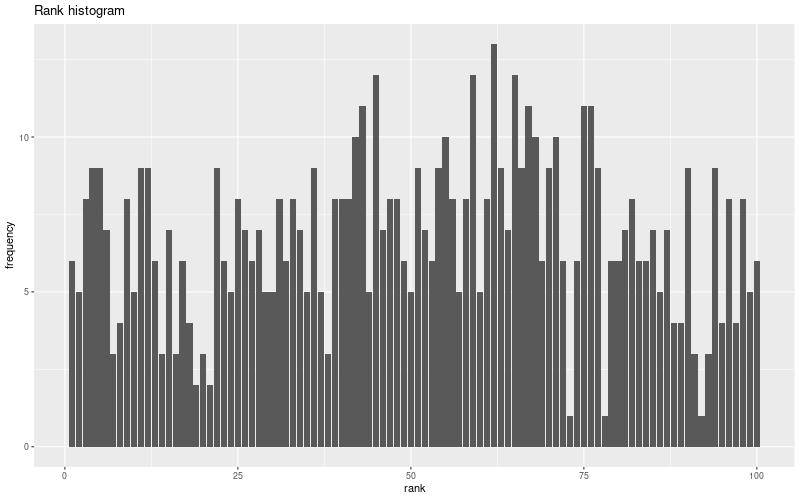
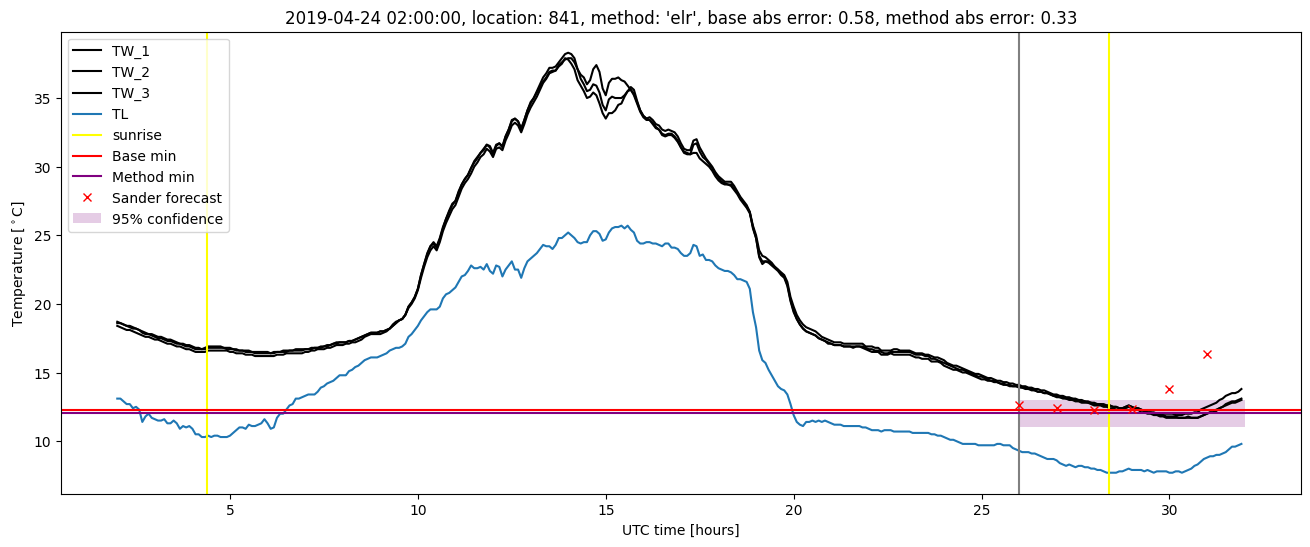
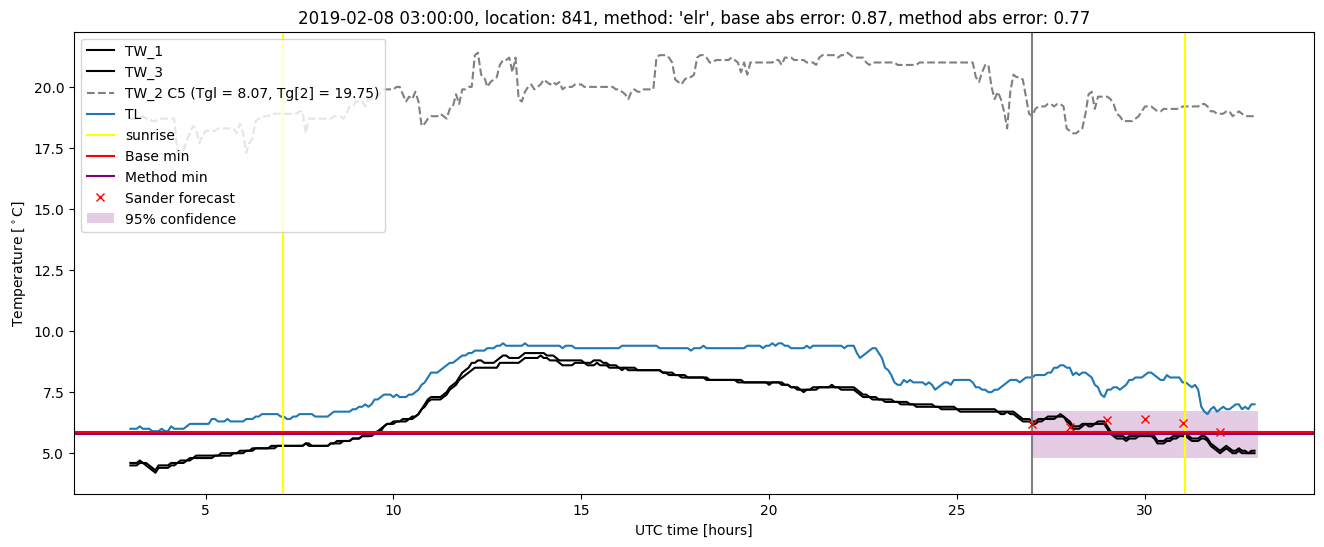
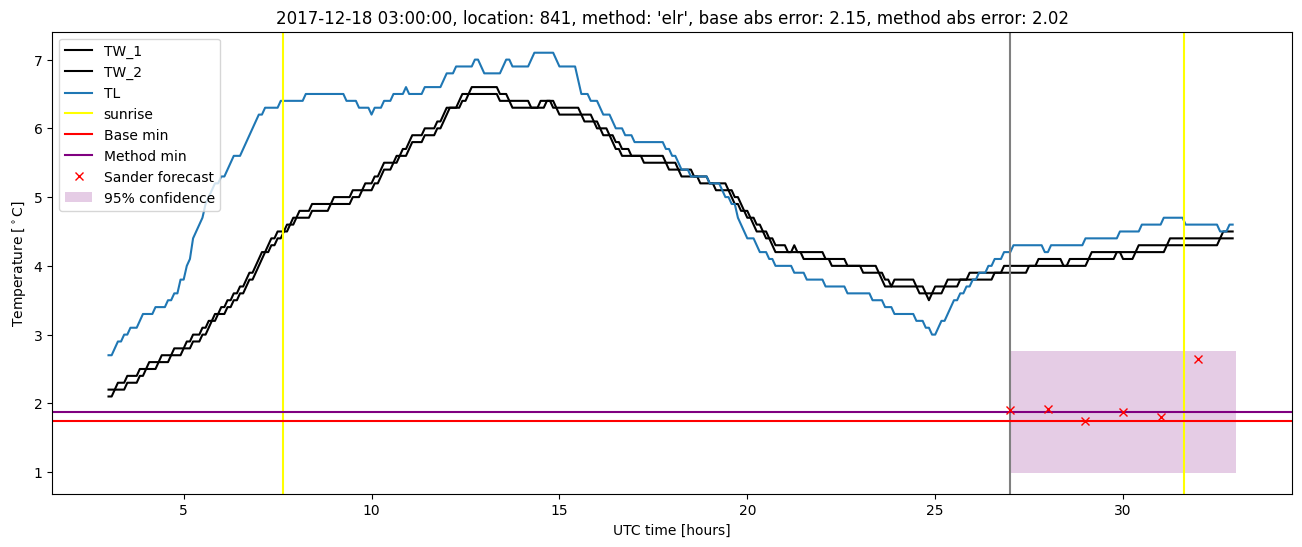
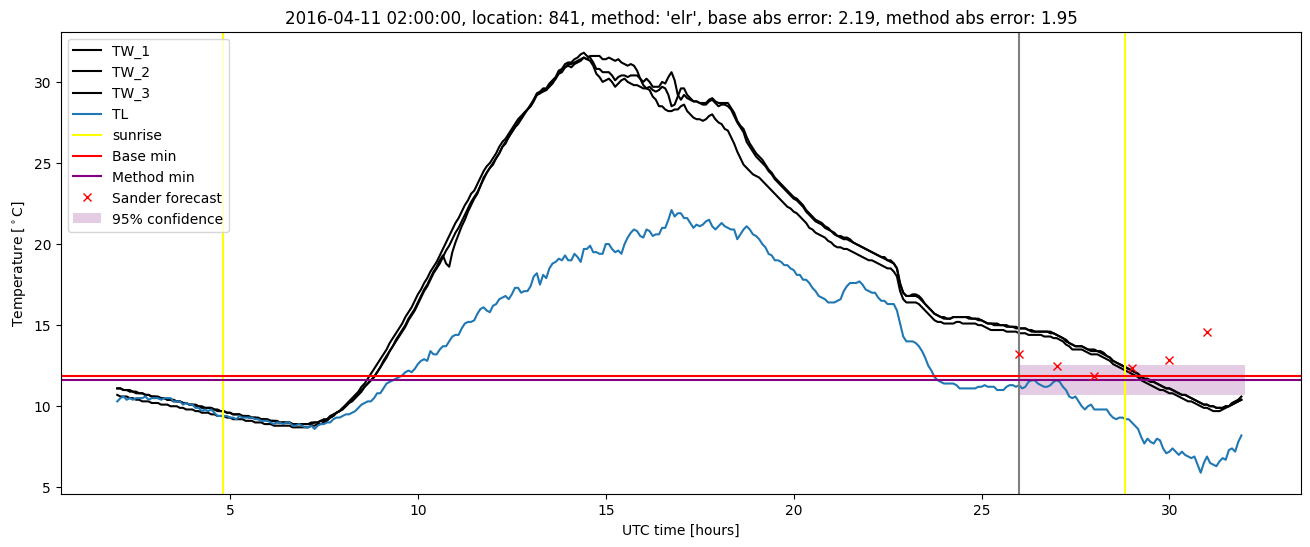
Extended logistic regression plots