GMS location: 840
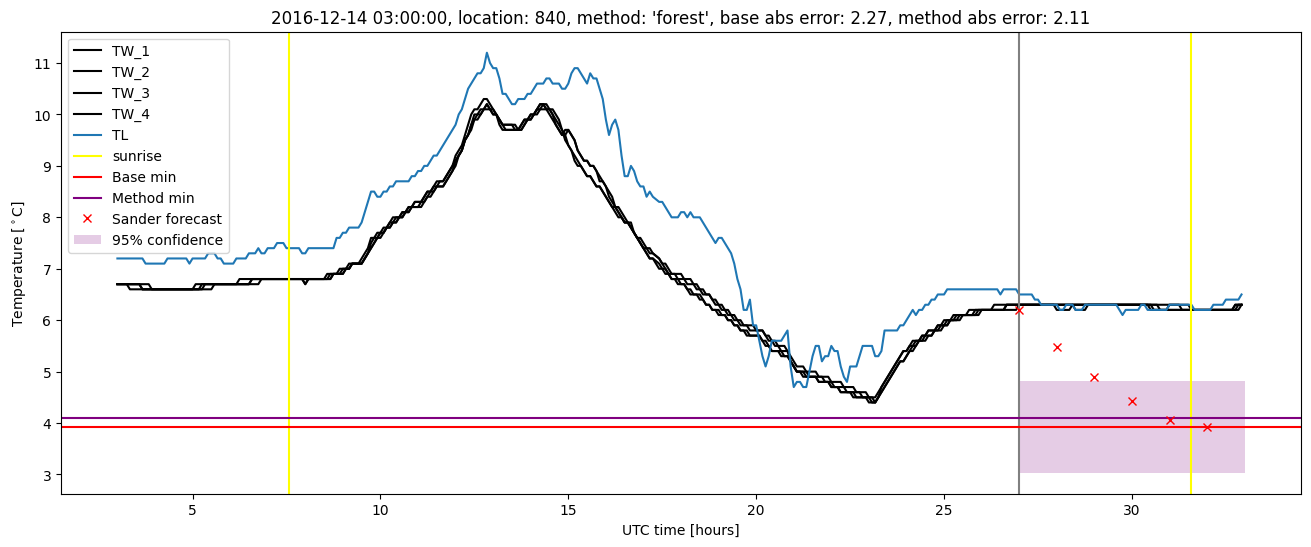
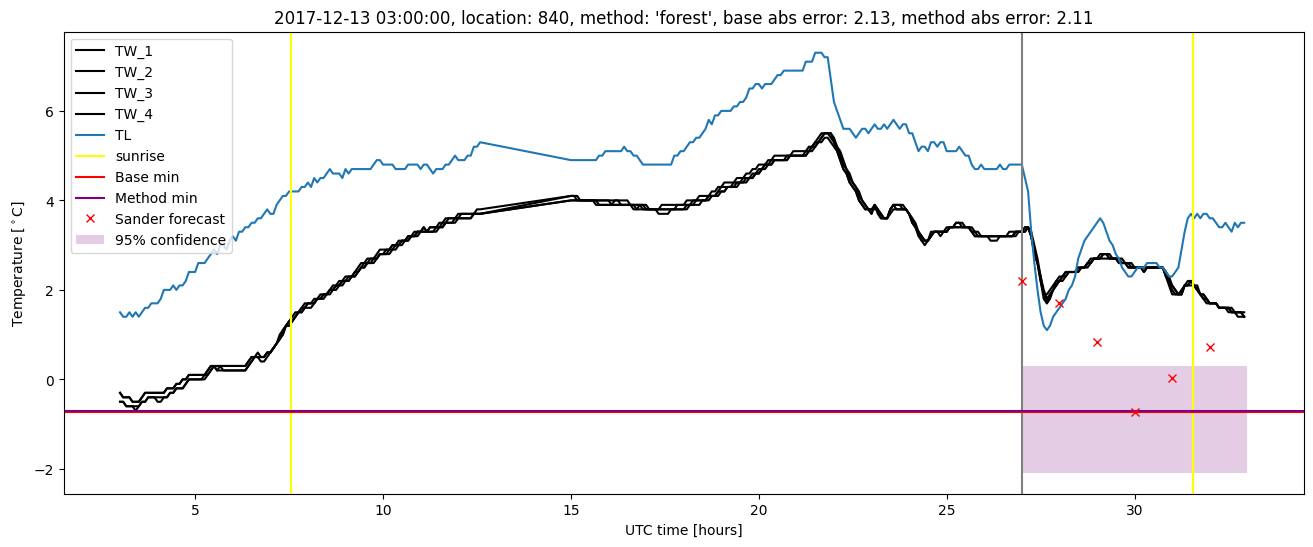
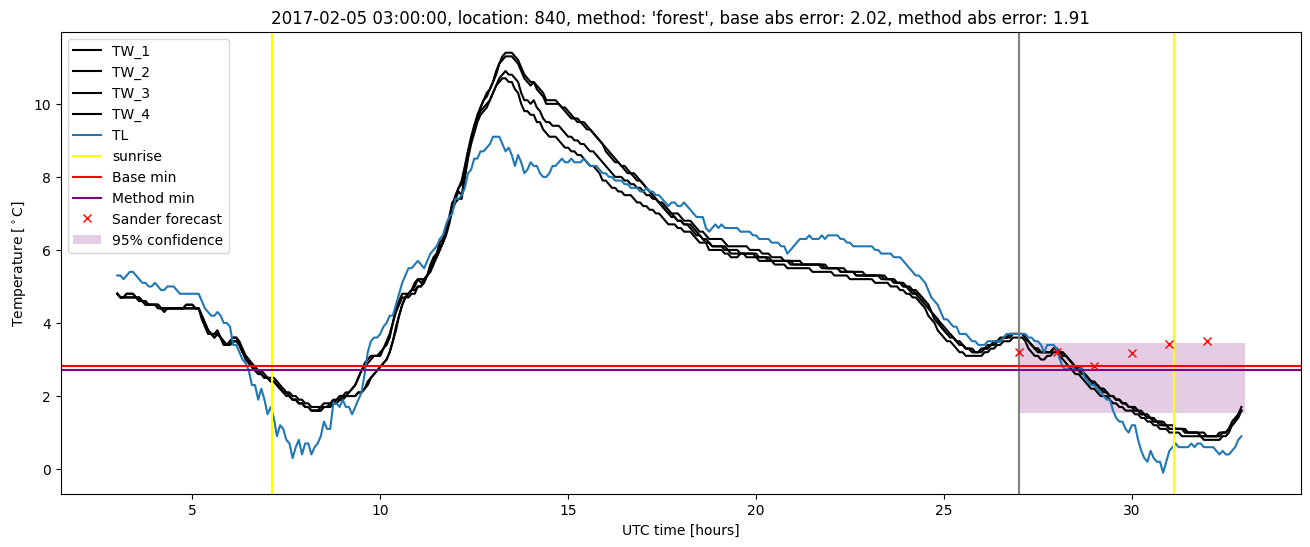
Random forest results
| names |
period |
power |
significance |
meanSquareError |
absError |
maxError |
CRPS |
IGN |
| baseline |
winter 2016 |
0.994 |
0.100 |
0.308 |
0.390 |
2.467 |
NaN |
NaN |
| forest |
winter 2016 |
0.988 |
0.100 |
0.276 |
0.367 |
2.351 |
0.510 |
4.508 |
| baseline |
winter 2017 |
0.982 |
0.050 |
0.331 |
0.410 |
2.273 |
NaN |
NaN |
| forest |
winter 2017 |
0.982 |
0.050 |
0.305 |
0.400 |
2.108 |
0.490 |
4.058 |
| baseline |
winter 2018 |
0.973 |
0.065 |
0.368 |
0.457 |
2.134 |
NaN |
NaN |
| forest |
winter 2018 |
0.980 |
0.065 |
0.296 |
0.388 |
2.106 |
0.491 |
3.374 |
| baseline |
winter 2019 |
0.978 |
0.048 |
0.332 |
0.422 |
1.978 |
NaN |
NaN |
| forest |
winter 2019 |
0.978 |
0.048 |
0.269 |
0.386 |
1.623 |
0.482 |
3.052 |
| baseline |
all |
0.982 |
0.062 |
0.335 |
0.420 |
2.467 |
NaN |
NaN |
| forest |
all |
0.982 |
0.062 |
0.286 |
0.384 |
2.351 |
0.494 |
3.761 |
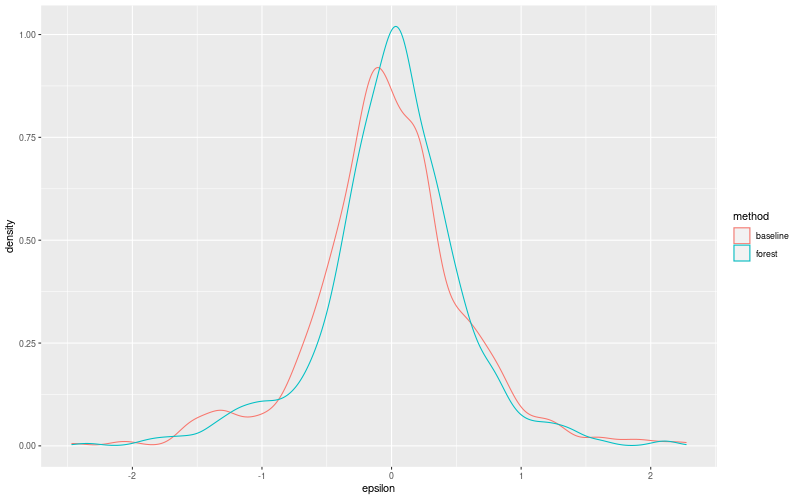
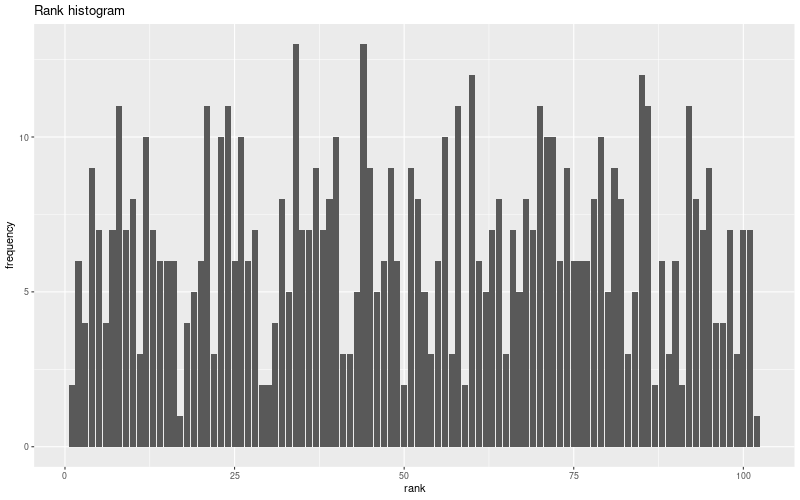
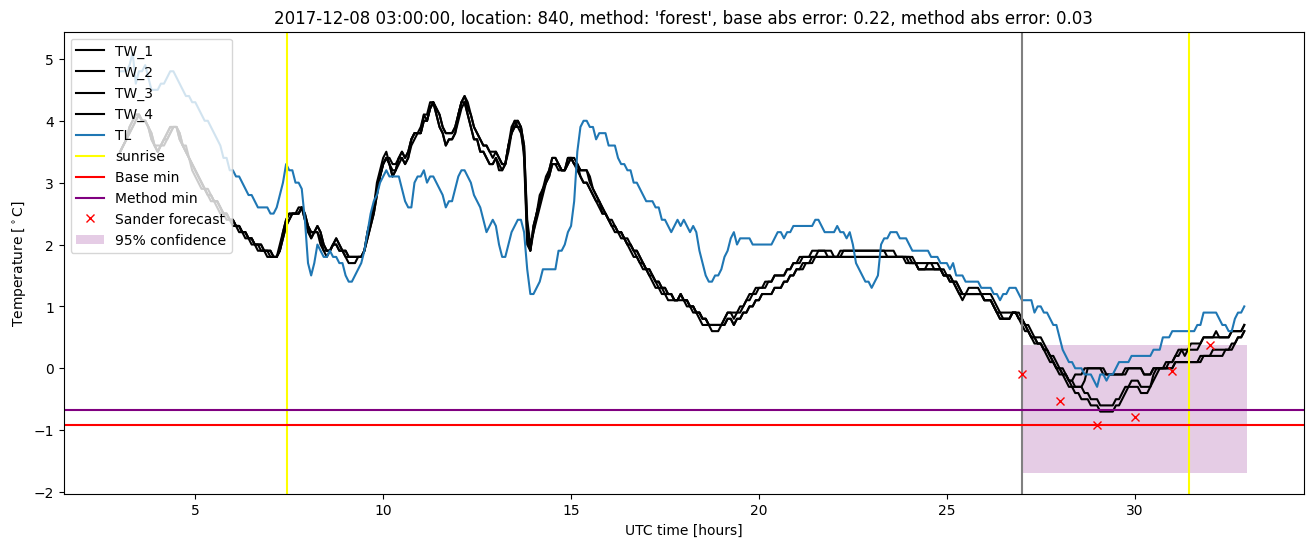
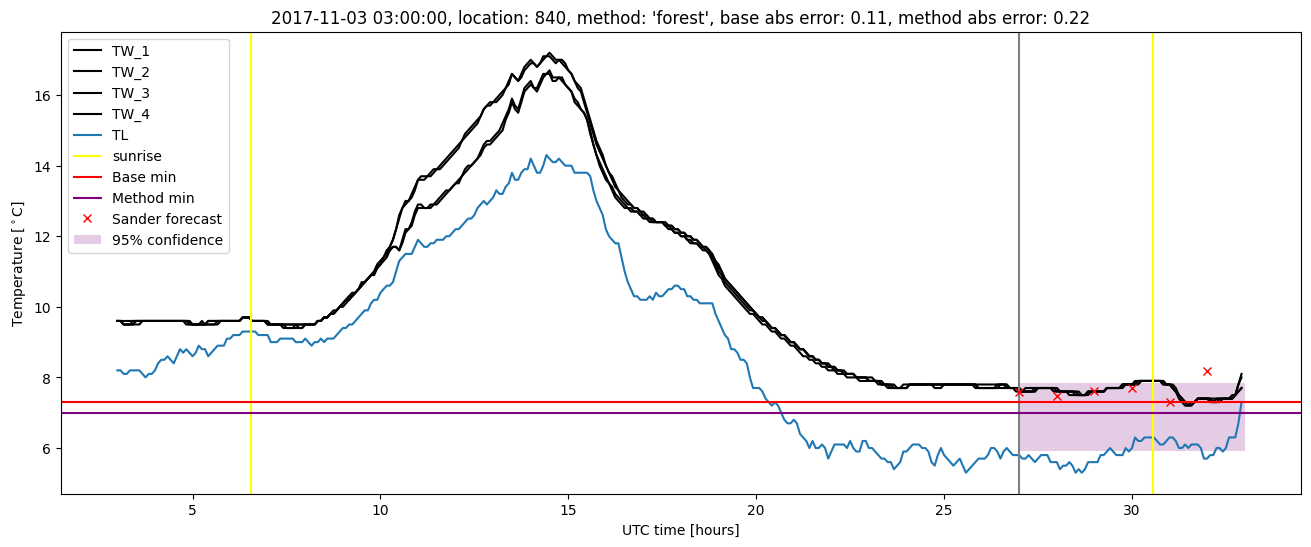
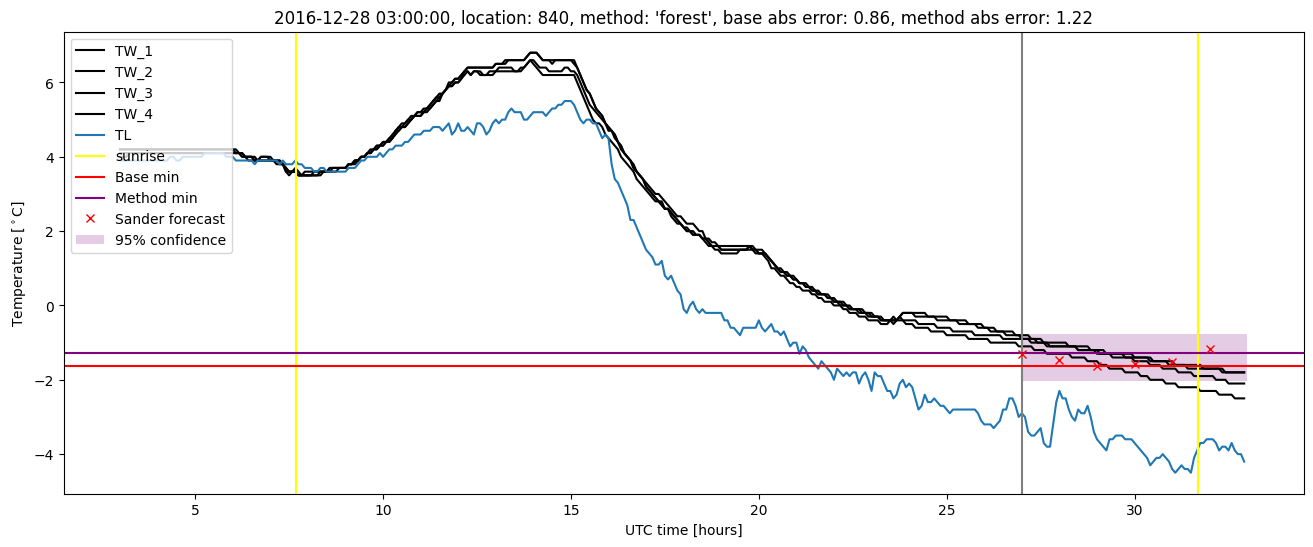
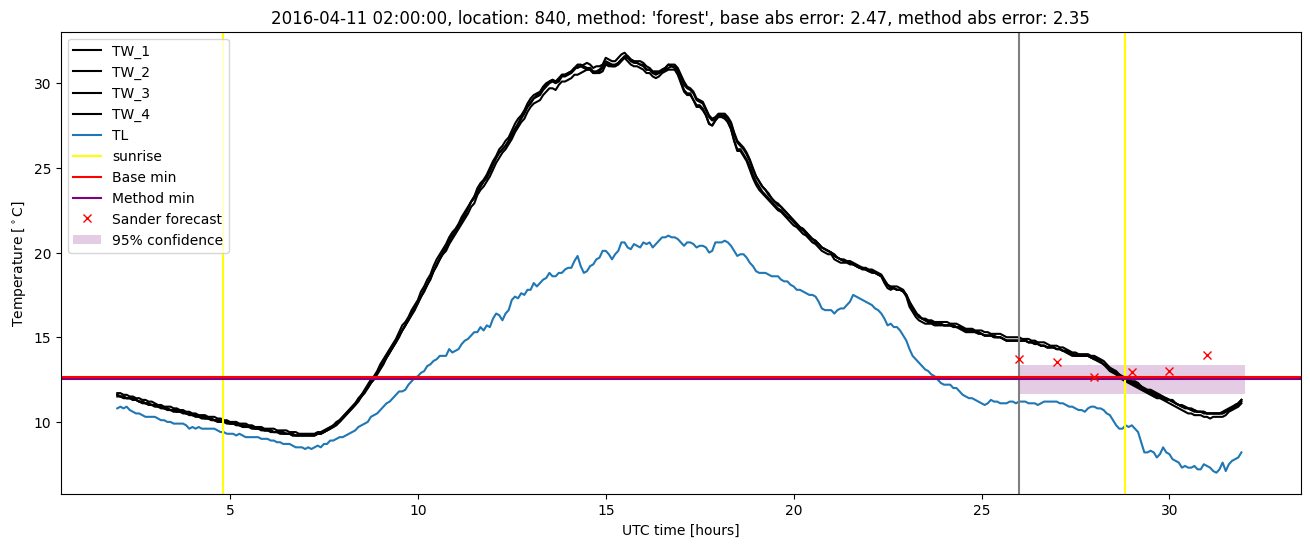
Random forest plots

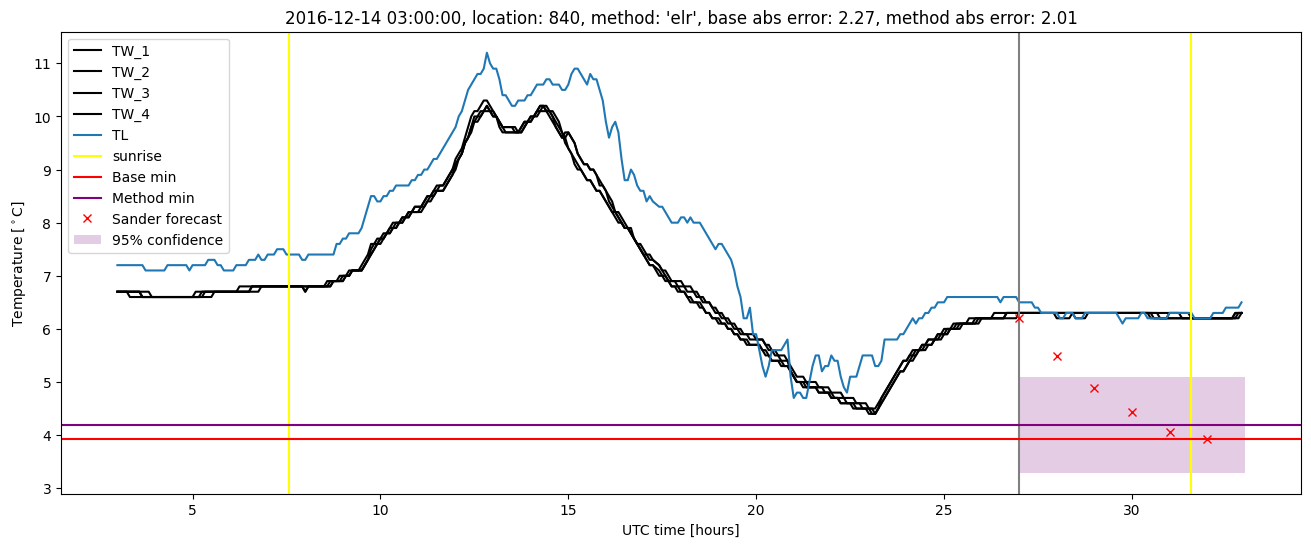
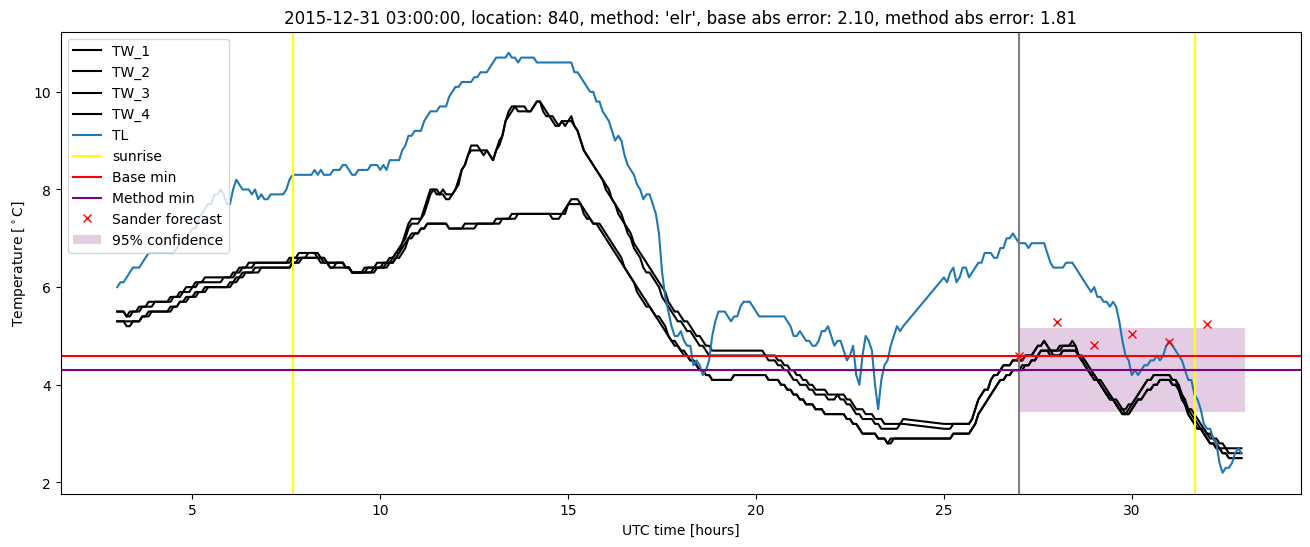
Extended logistic regression results
| names |
period |
power |
significance |
meanSquareError |
absError |
maxError |
CRPS |
IGN |
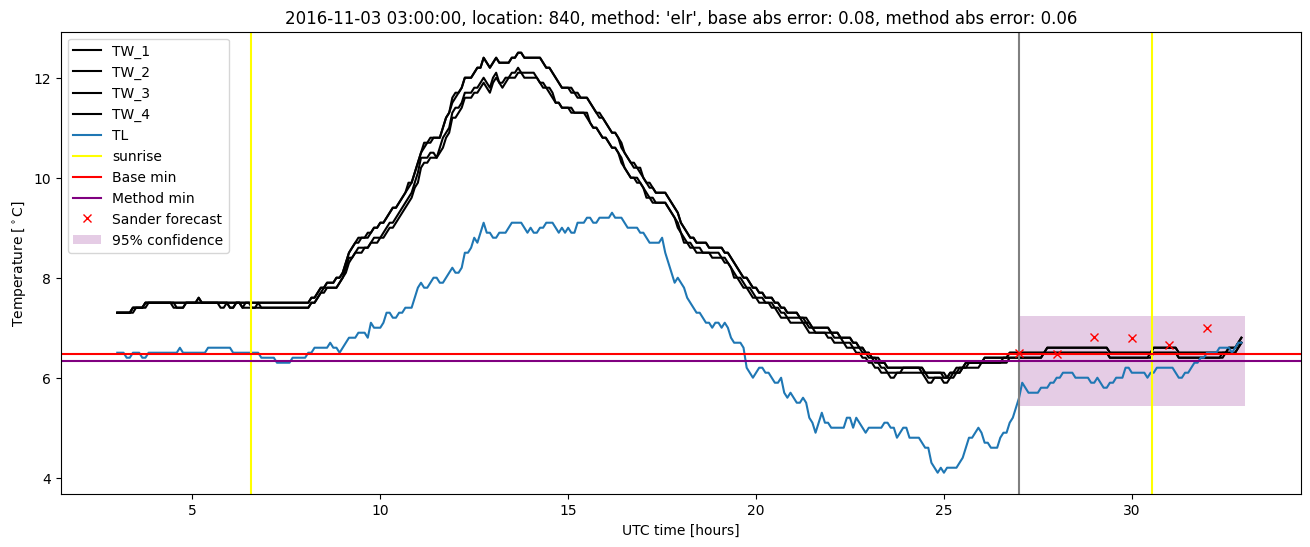
| baseline |
winter 2016 |
0.994 |
0.100 |
0.308 |
0.390 |
2.467 |
NaN |
NaN |
| elr |
winter 2016 |
0.988 |
0.100 |
0.306 |
0.402 |
2.594 |
0.542 |
4.516 |
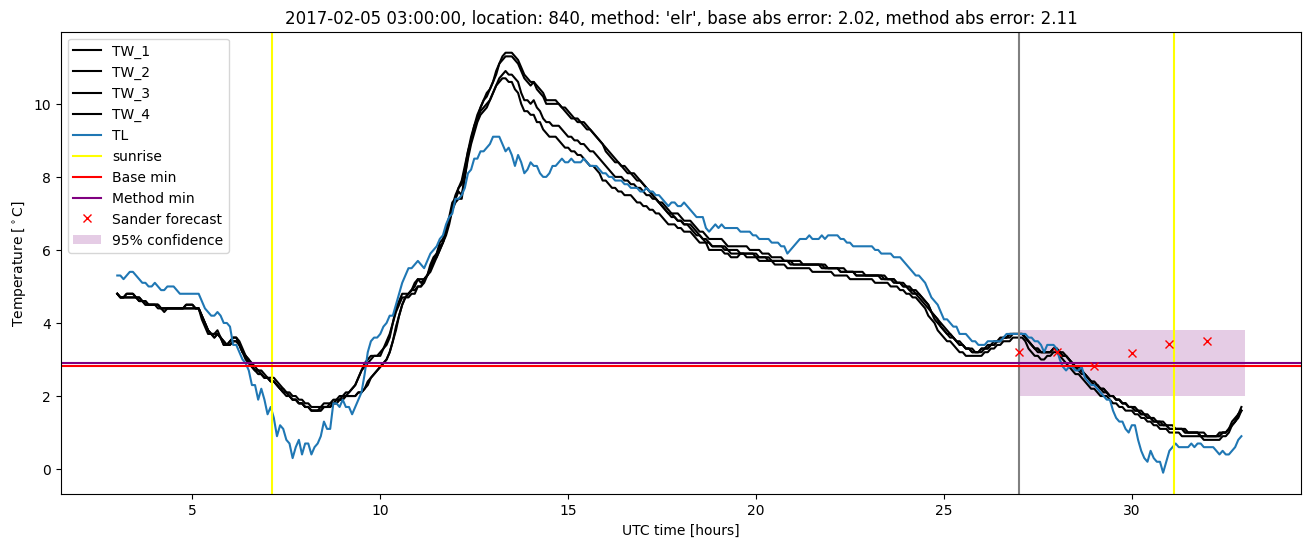
| baseline |
winter 2017 |
0.982 |
0.050 |
0.331 |
0.410 |
2.273 |
NaN |
NaN |
| elr |
winter 2017 |
0.991 |
0.100 |
0.298 |
0.392 |
2.111 |
0.502 |
3.441 |
| baseline |
winter 2018 |
0.973 |
0.065 |
0.368 |
0.457 |
2.134 |
NaN |
NaN |
| elr |
winter 2018 |
0.987 |
0.065 |
0.299 |
0.422 |
1.671 |
0.531 |
3.767 |
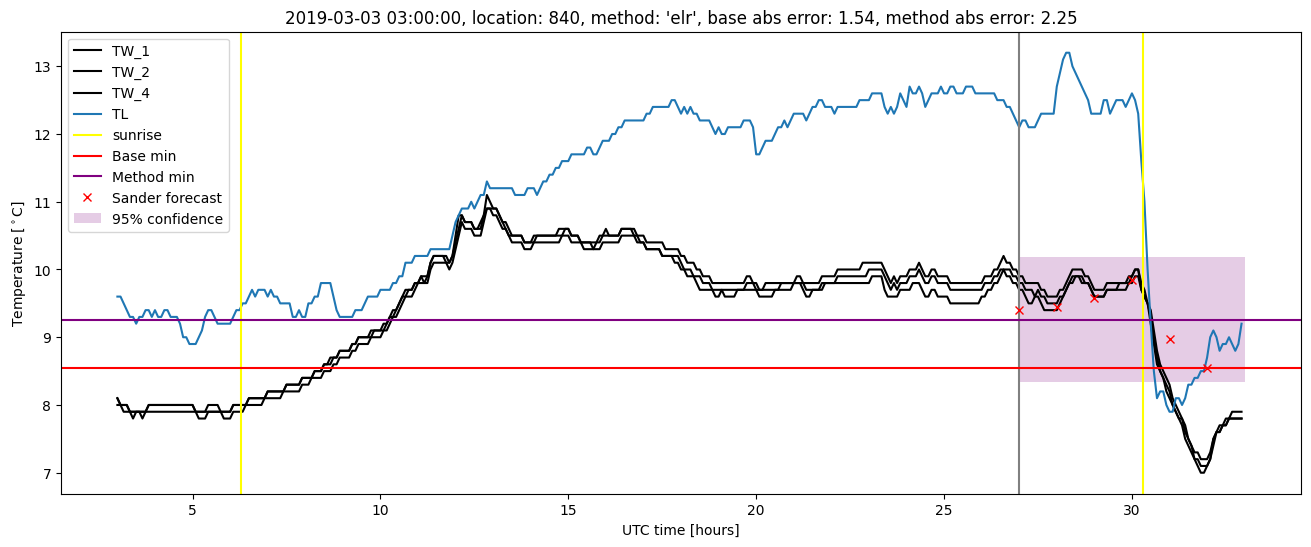
| baseline |
winter 2019 |
0.978 |
0.048 |
0.332 |
0.422 |
1.978 |
NaN |
NaN |
| elr |
winter 2019 |
0.978 |
0.048 |
0.290 |
0.396 |
2.252 |
0.524 |
3.527 |
| baseline |
all |
0.982 |
0.062 |
0.335 |
0.420 |
2.467 |
NaN |
NaN |
| elr |
all |
0.986 |
0.080 |
0.298 |
0.404 |
2.594 |
0.526 |
3.842 |
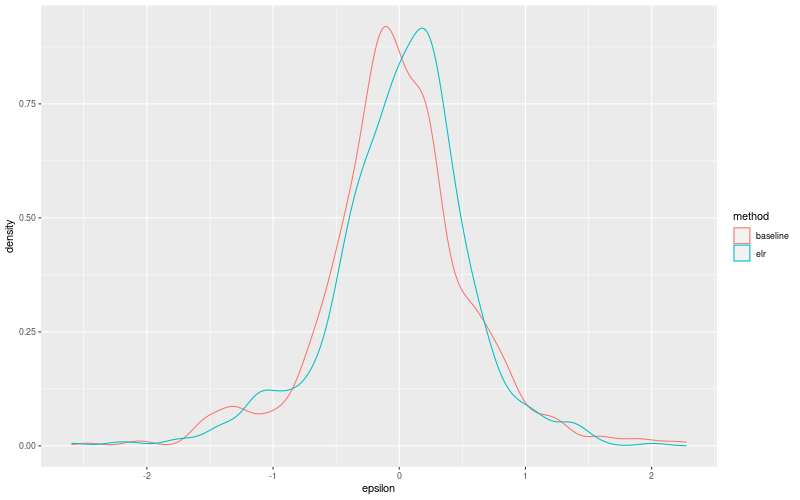
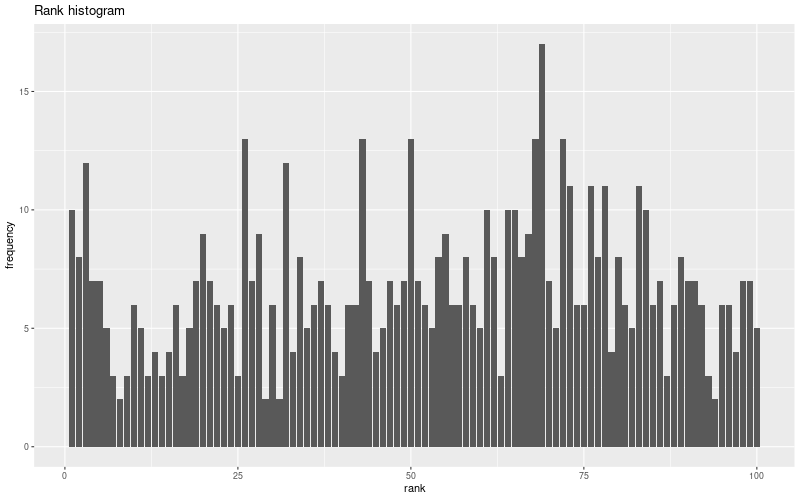
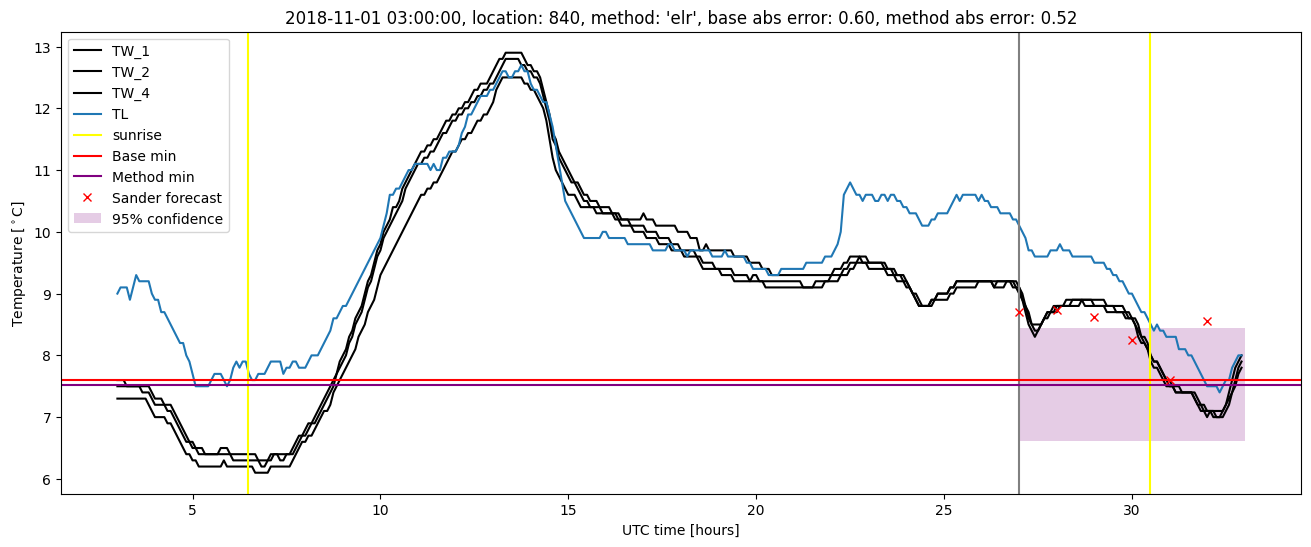
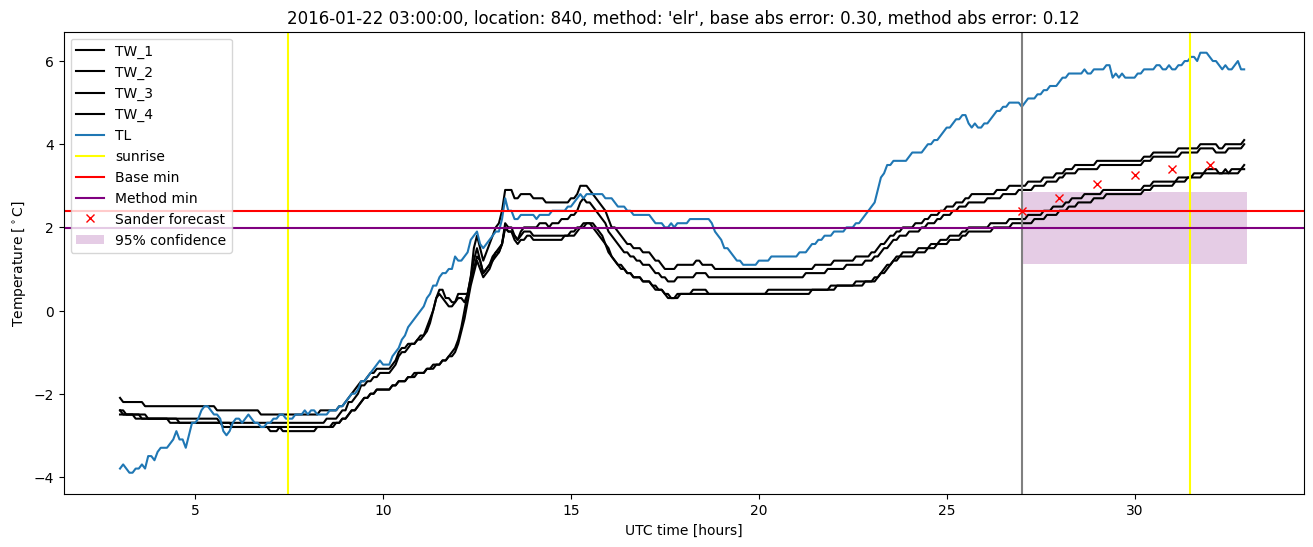
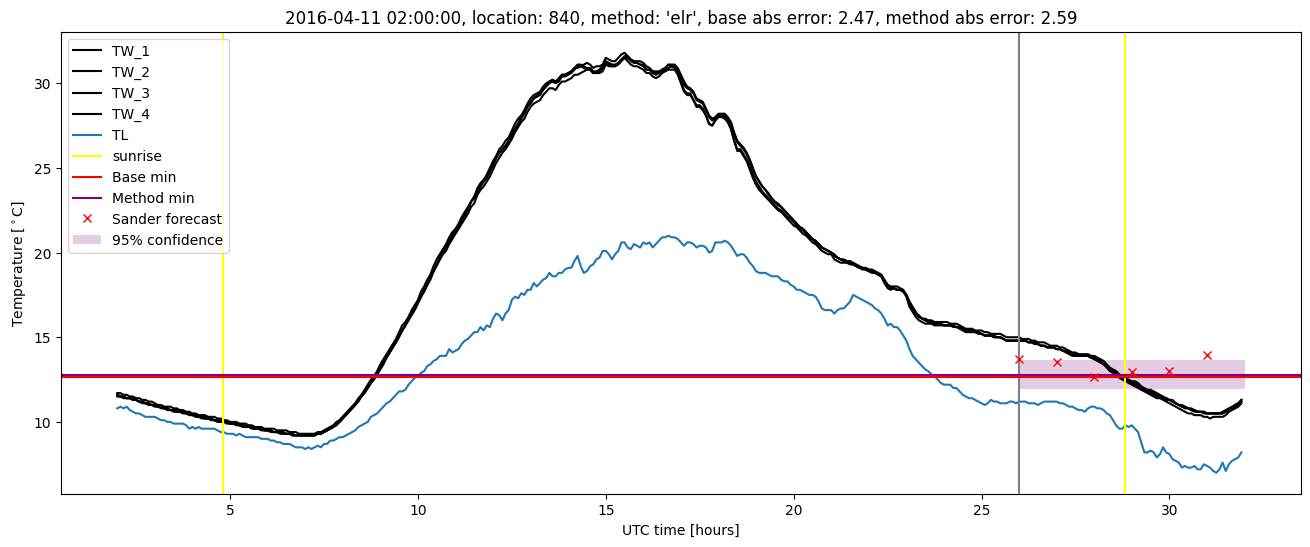
Extended logistic regression plots