GMS location: 838
Random forest results
| names |
period |
power |
significance |
meanSquareError |
absError |
maxError |
CRPS |
IGN |
| baseline |
winter 2016 |
0.972 |
0.200 |
0.531 |
0.528 |
3.026 |
NaN |
NaN |
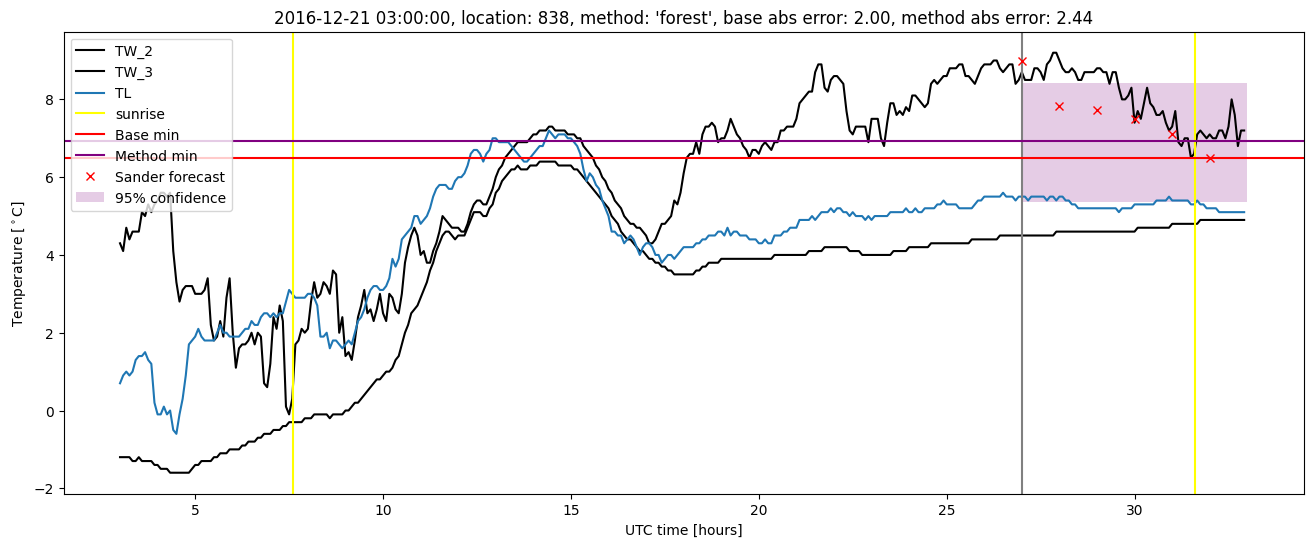
| forest |
winter 2016 |
0.967 |
0.160 |
0.483 |
0.506 |
2.485 |
0.537 |
2.220 |
| baseline |
winter 2017 |
0.991 |
0.143 |
1.072 |
0.532 |
8.625 |
NaN |
NaN |
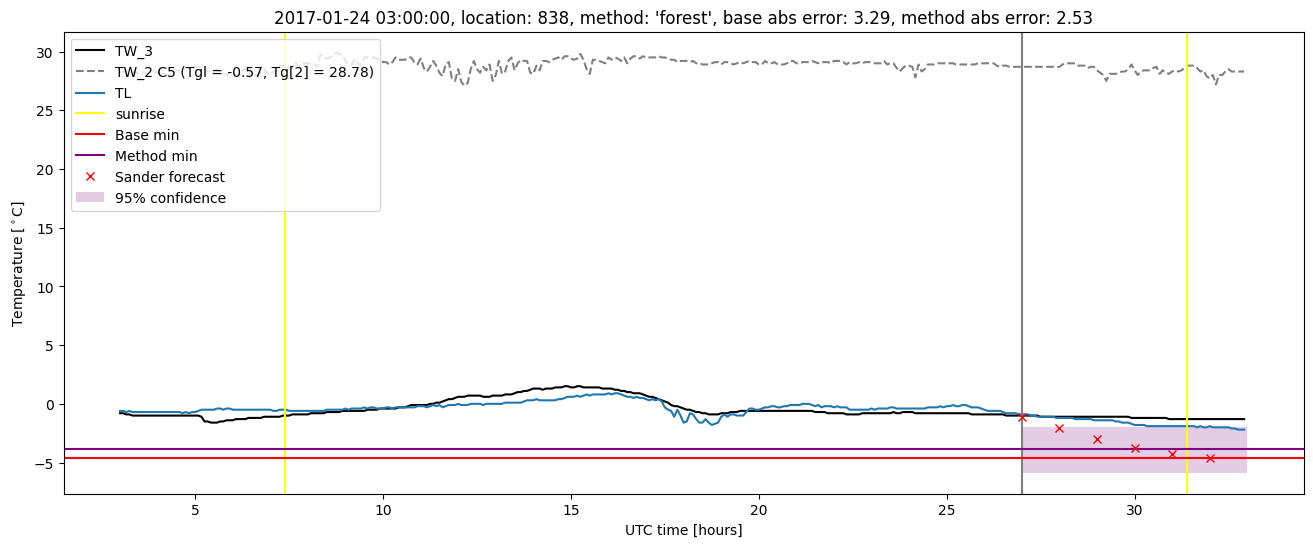
| forest |
winter 2017 |
0.991 |
0.143 |
1.037 |
0.506 |
8.678 |
0.509 |
2.018 |
| baseline |
winter 2018 |
0.980 |
0.074 |
0.457 |
0.508 |
2.012 |
NaN |
NaN |
| forest |
winter 2018 |
0.980 |
0.074 |
0.407 |
0.472 |
2.319 |
0.507 |
2.024 |
| baseline |
winter 2019 |
0.993 |
0.091 |
0.431 |
0.482 |
2.636 |
NaN |
NaN |
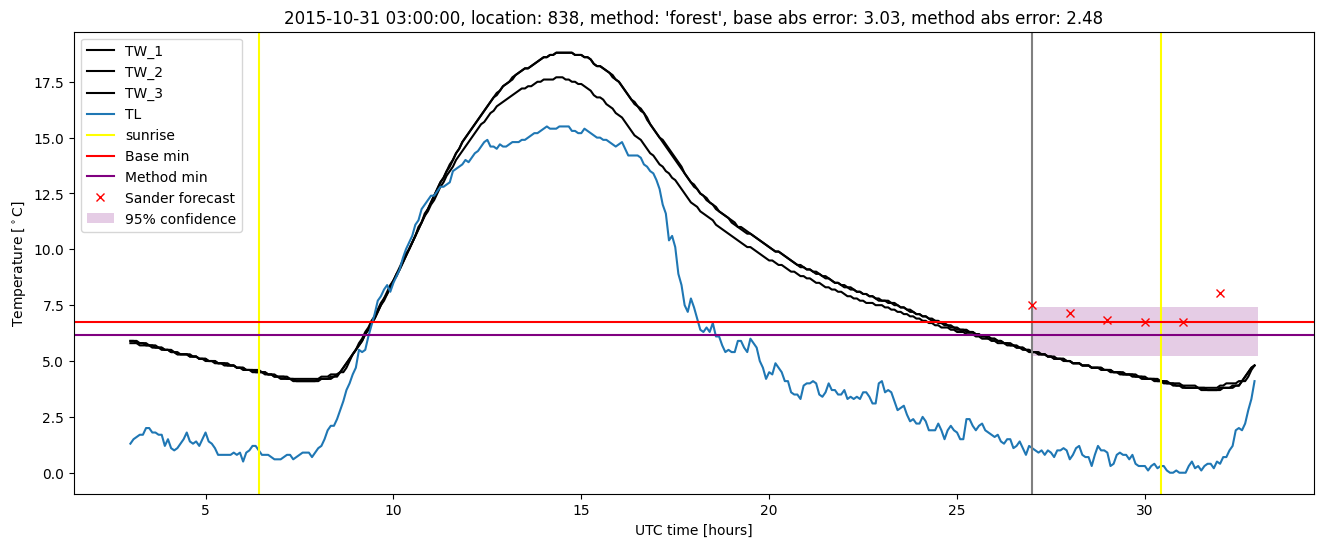
| forest |
winter 2019 |
0.985 |
0.000e+00 |
0.372 |
0.440 |
2.004 |
0.532 |
1.734 |
| baseline |
all |
0.983 |
0.128 |
0.607 |
0.513 |
8.625 |
NaN |
NaN |
| forest |
all |
0.979 |
0.101 |
0.559 |
0.482 |
8.678 |
0.522 |
2.016 |
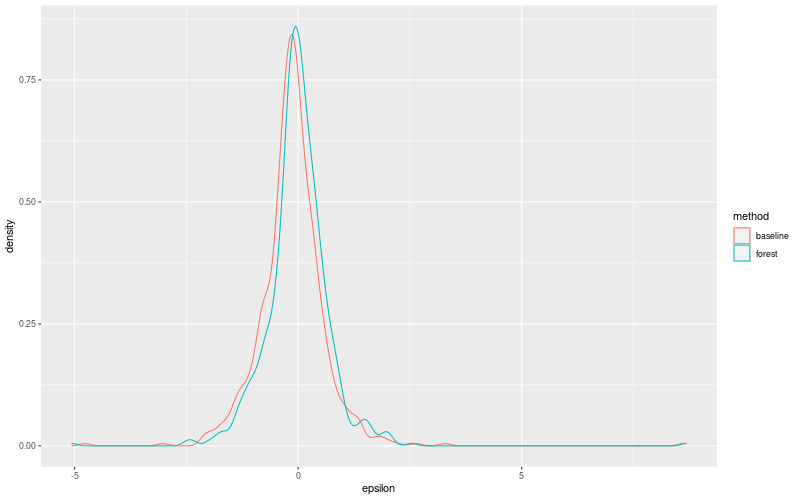
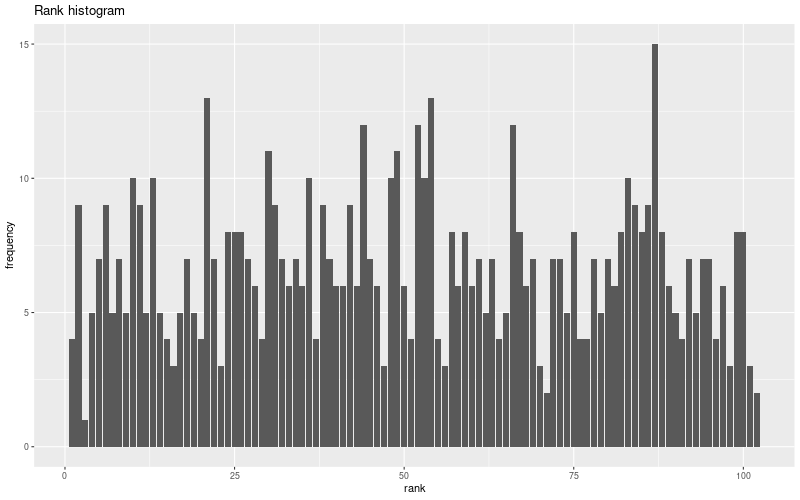
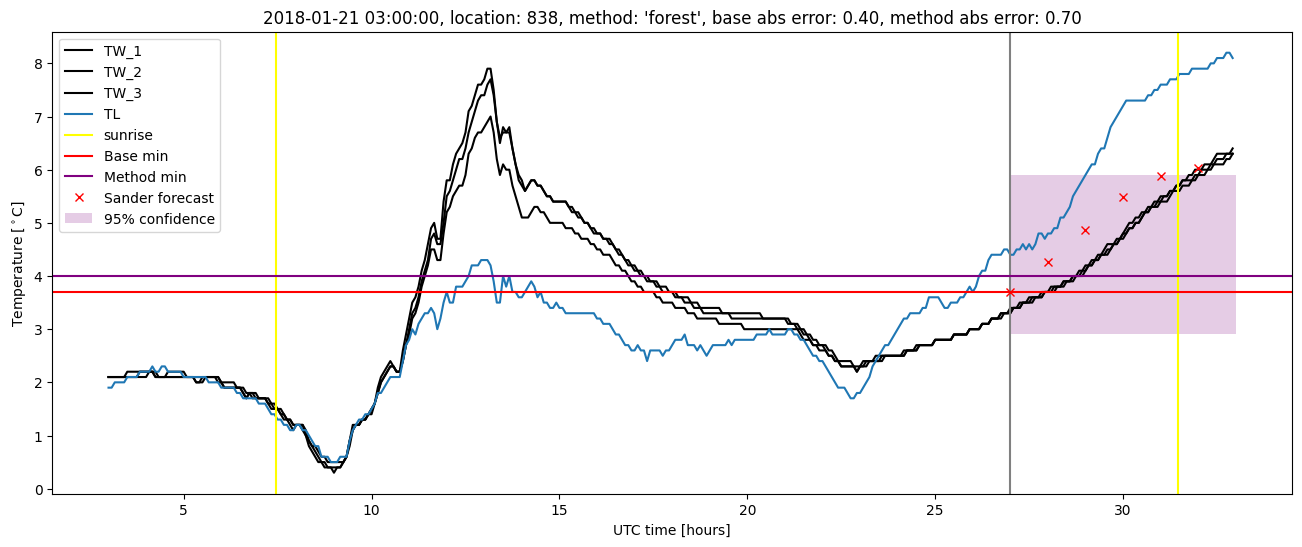
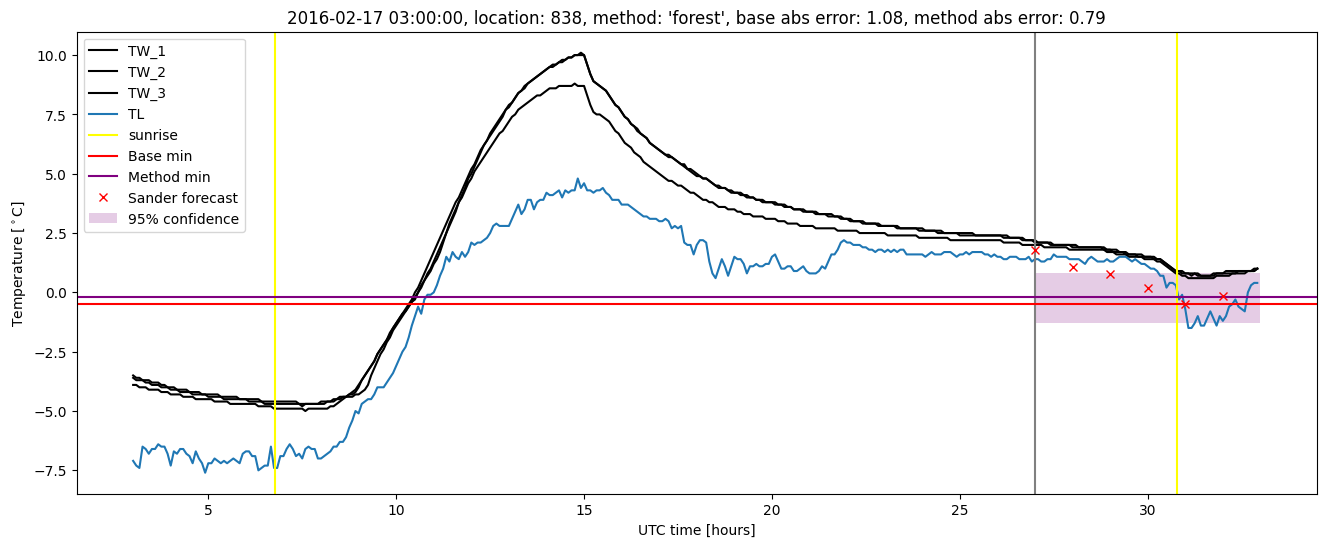
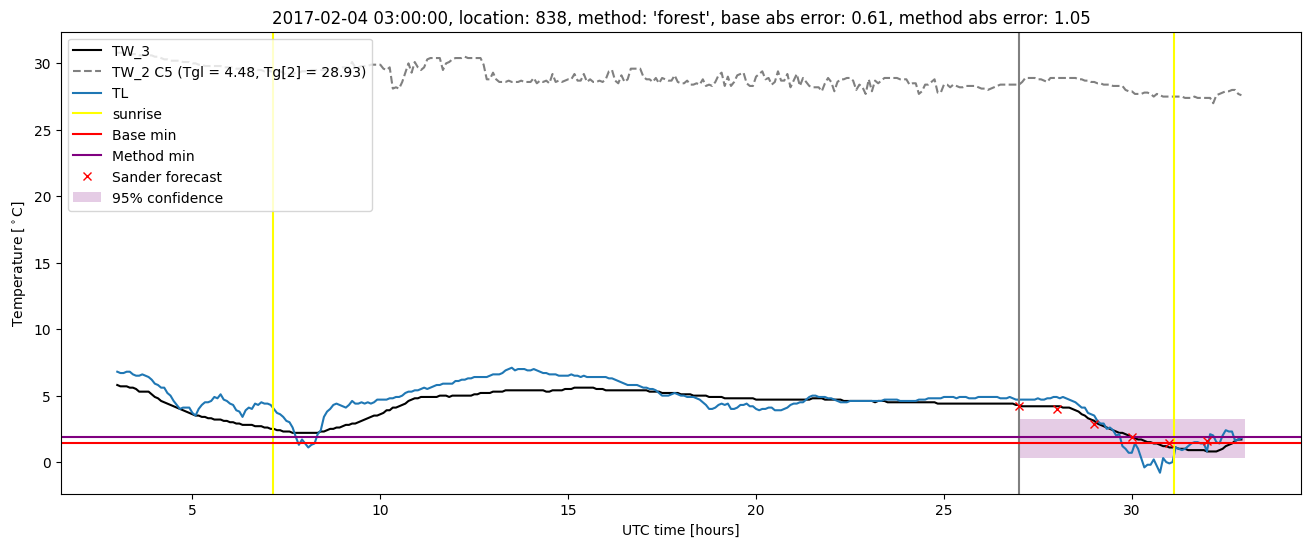
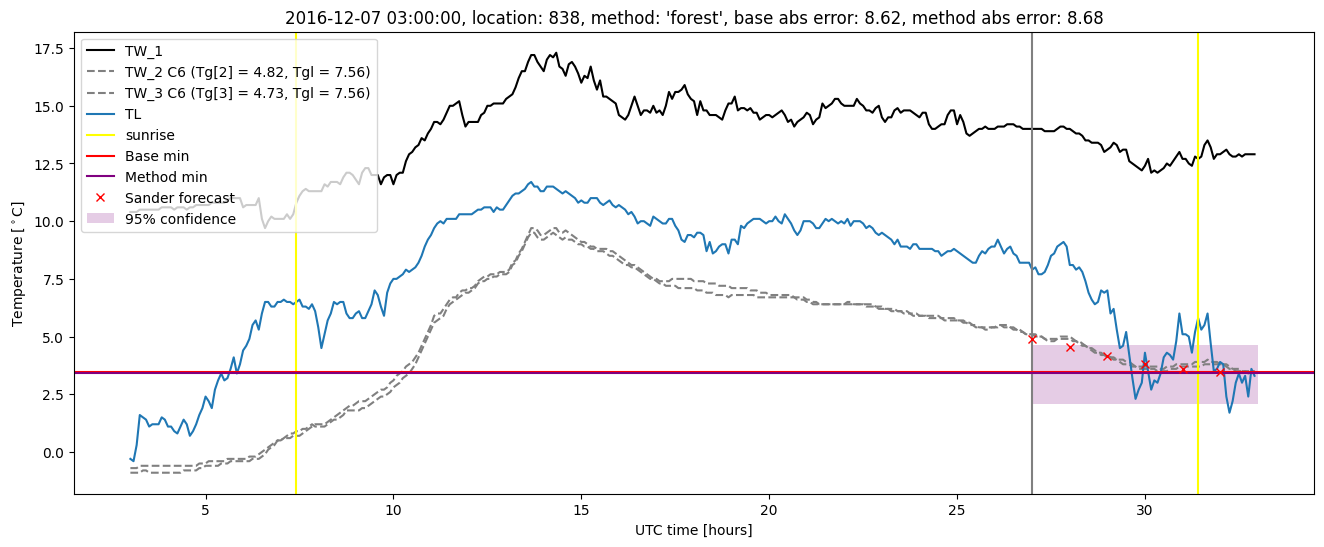
Random forest plots

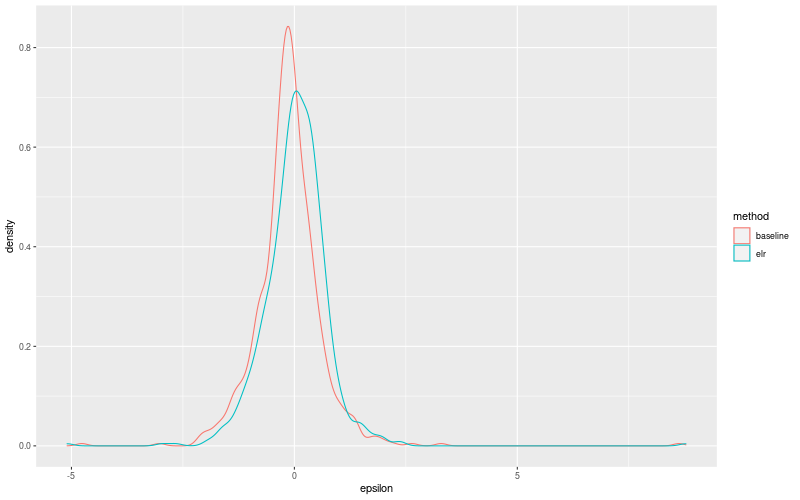
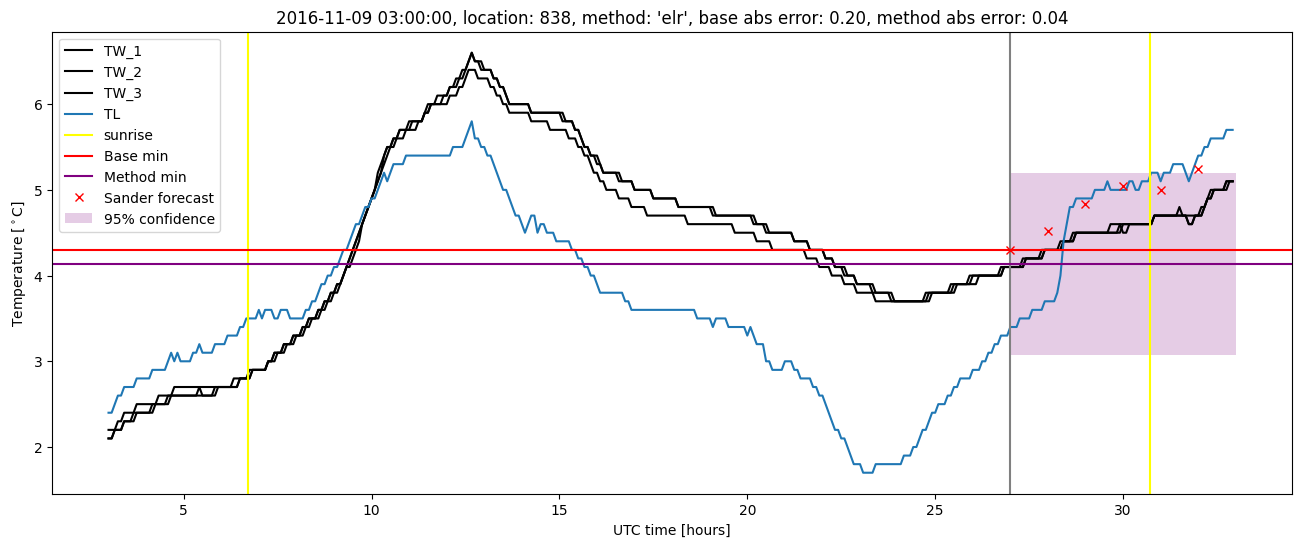
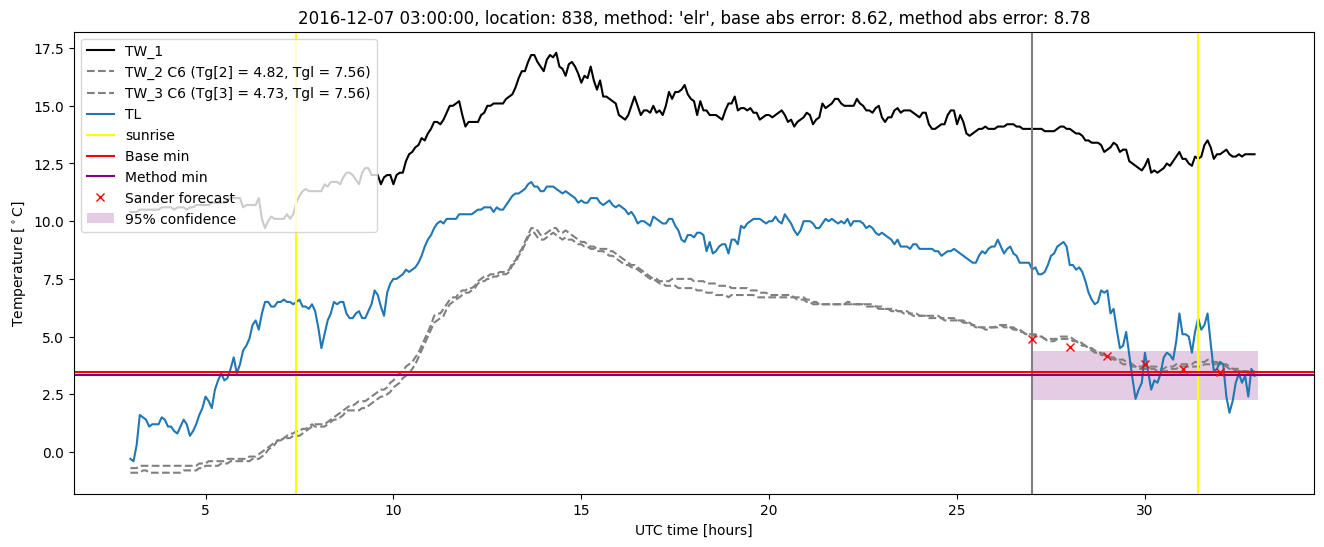
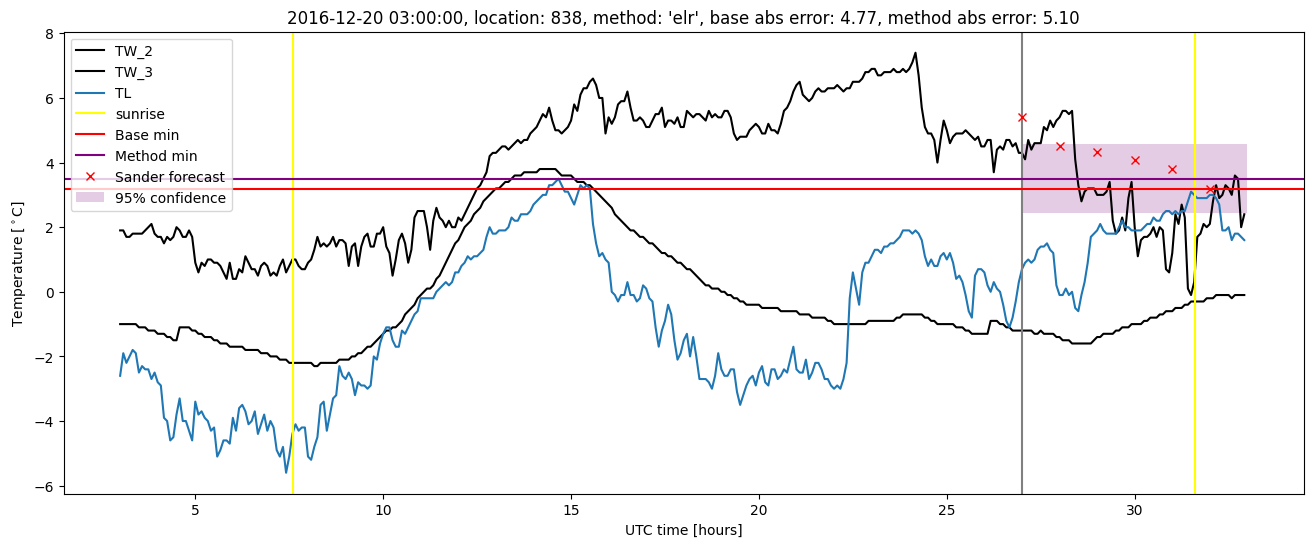
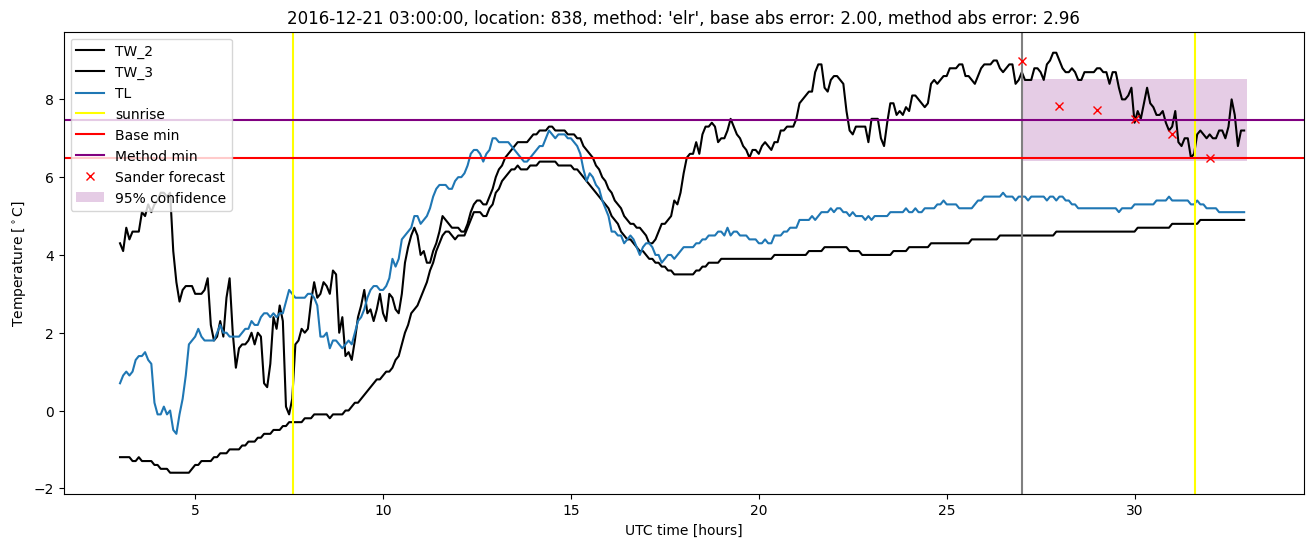
Extended logistic regression results
| names |
period |
power |
significance |
meanSquareError |
absError |
maxError |
CRPS |
IGN |
| baseline |
winter 2016 |
0.972 |
0.200 |
0.531 |
0.528 |
3.026 |
NaN |
NaN |
| elr |
winter 2016 |
0.972 |
0.120 |
0.475 |
0.513 |
2.661 |
0.577 |
2.124 |
| baseline |
winter 2017 |
0.991 |
0.143 |
1.072 |
0.532 |
8.625 |
NaN |
NaN |
| elr |
winter 2017 |
0.982 |
0.143 |
1.080 |
0.533 |
8.781 |
0.590 |
2.717 |
| baseline |
winter 2018 |
0.980 |
0.074 |
0.457 |
0.508 |
2.012 |
NaN |
NaN |
| elr |
winter 2018 |
0.980 |
0.074 |
0.427 |
0.516 |
1.984 |
0.552 |
1.902 |
| baseline |
winter 2019 |
0.993 |
0.091 |
0.431 |
0.482 |
2.636 |
NaN |
NaN |
| elr |
winter 2019 |
0.985 |
0.000e+00 |
0.363 |
0.455 |
2.342 |
0.530 |
1.774 |
| baseline |
all |
0.983 |
0.128 |
0.607 |
0.513 |
8.625 |
NaN |
NaN |
| elr |
all |
0.979 |
0.092 |
0.569 |
0.505 |
8.781 |
0.563 |
2.116 |
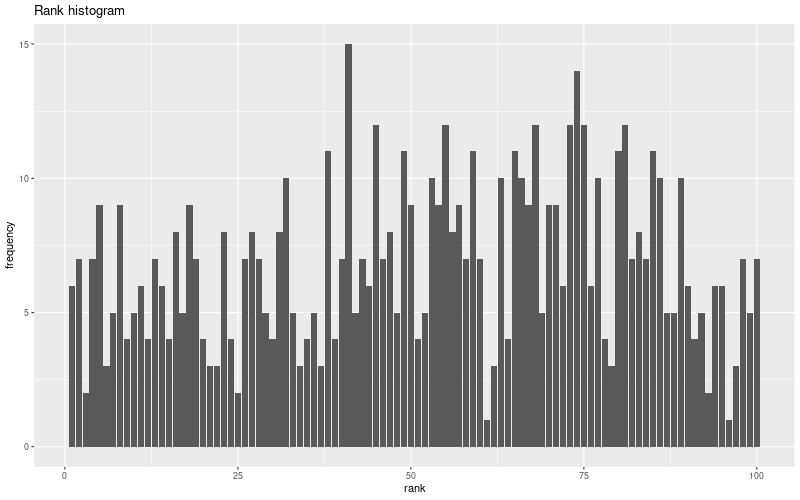
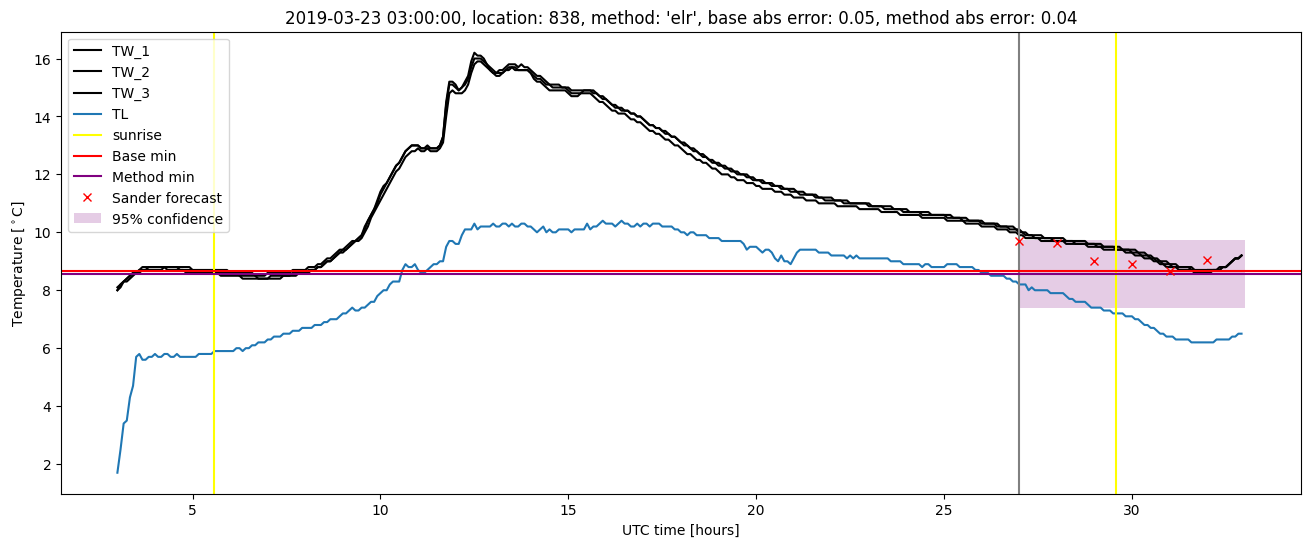
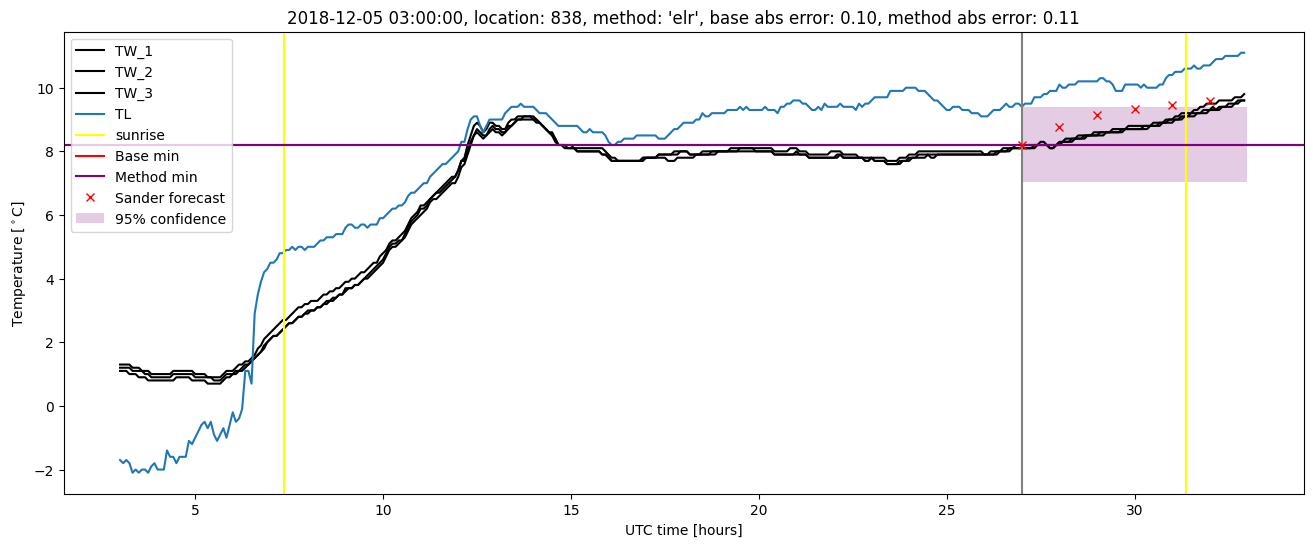
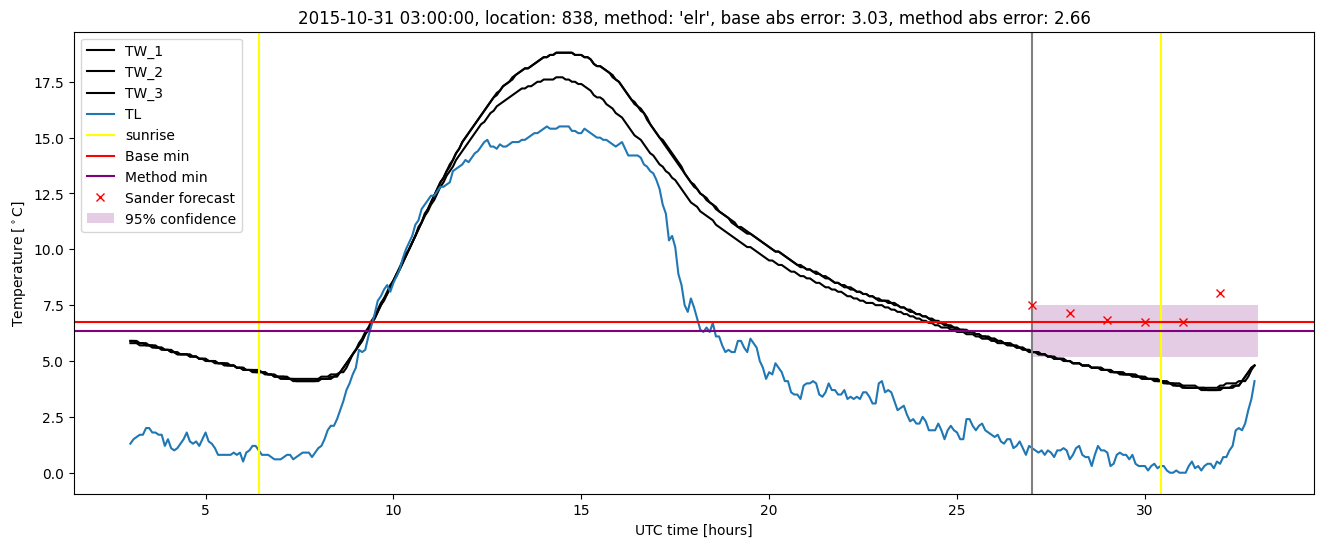
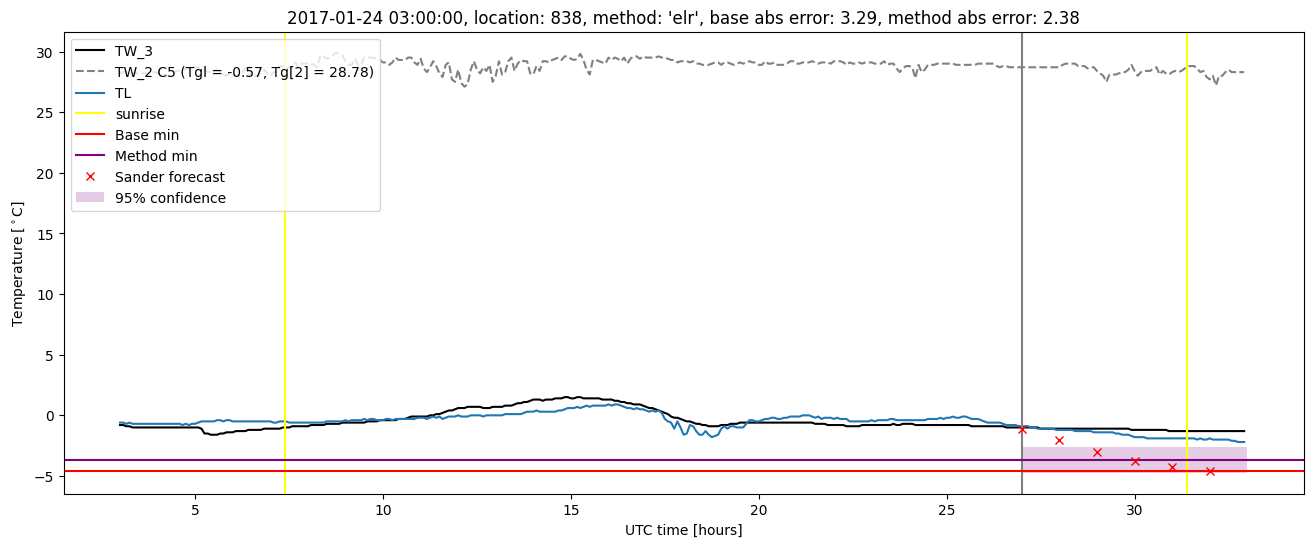
Extended logistic regression plots