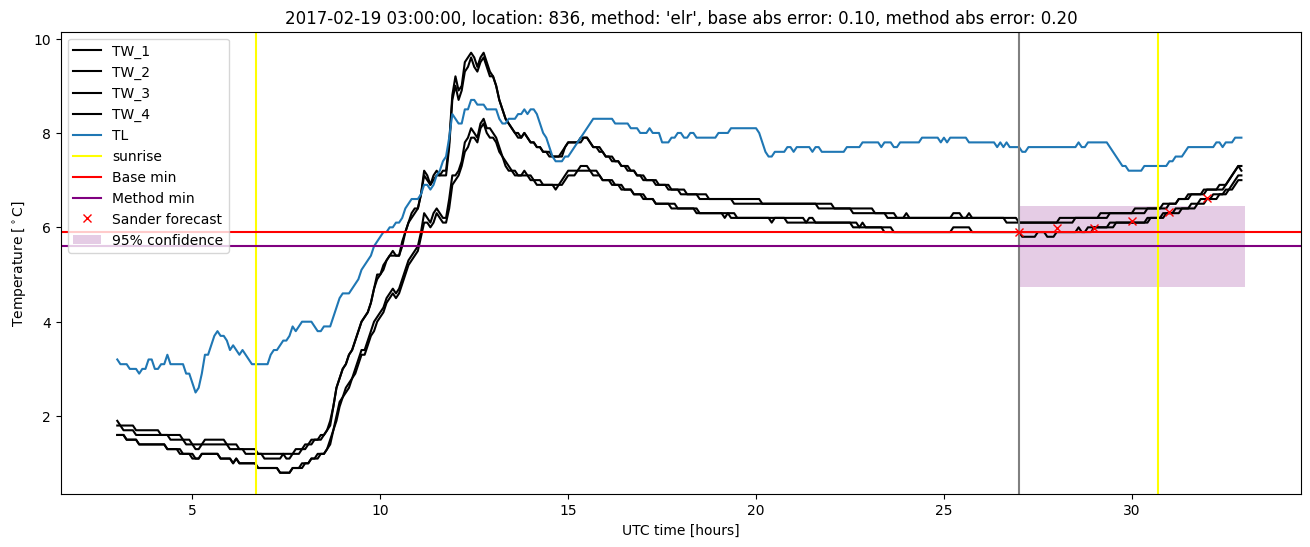
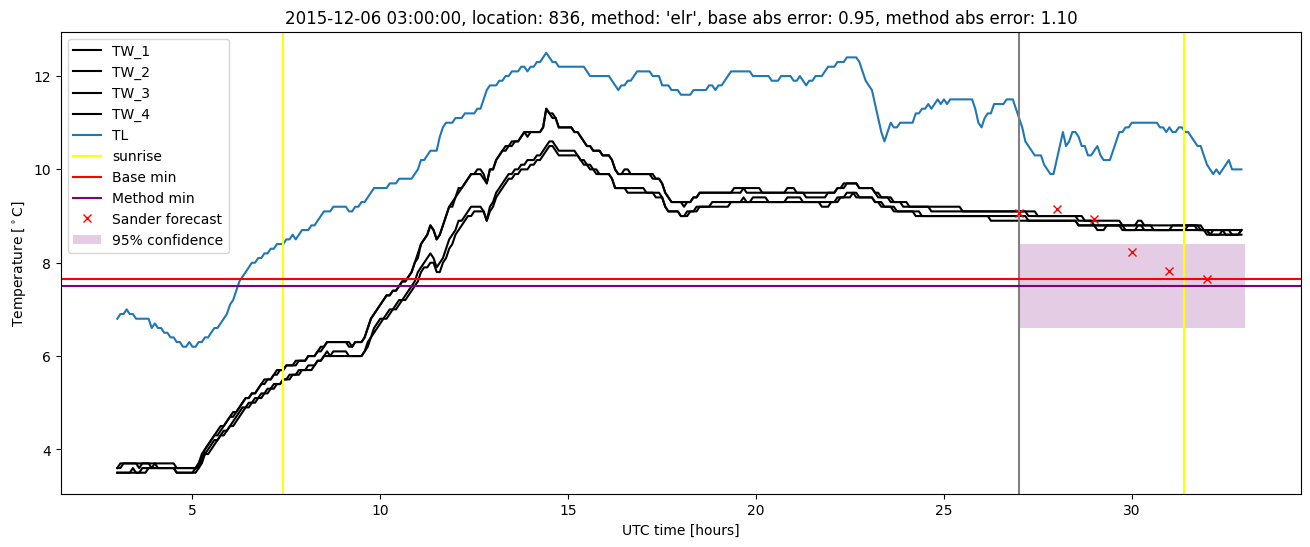
GMS location: 836
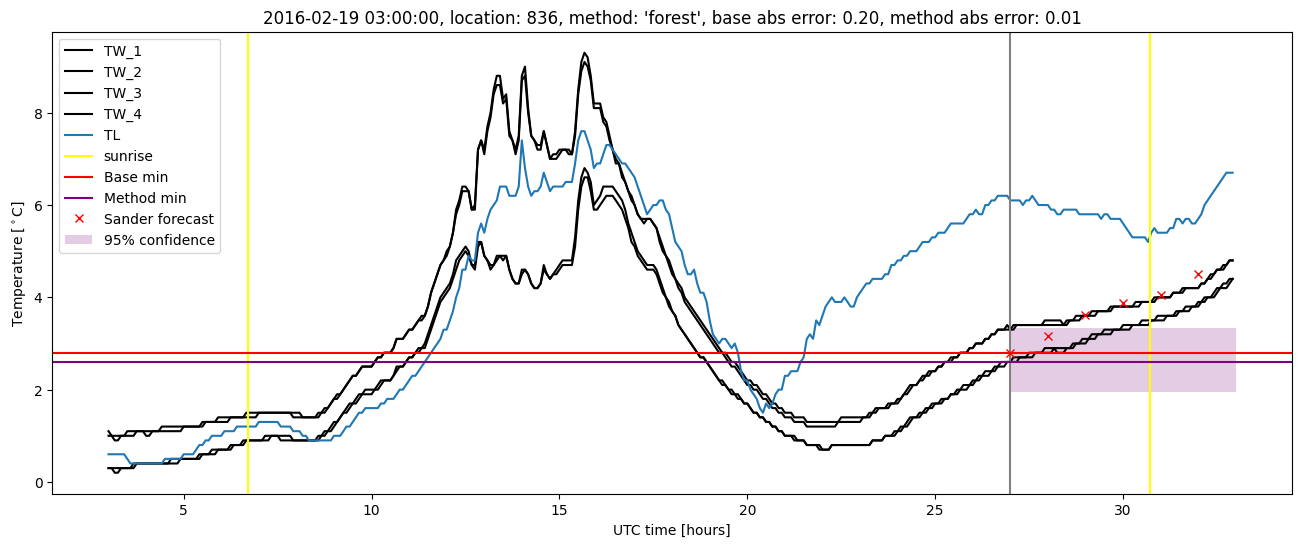
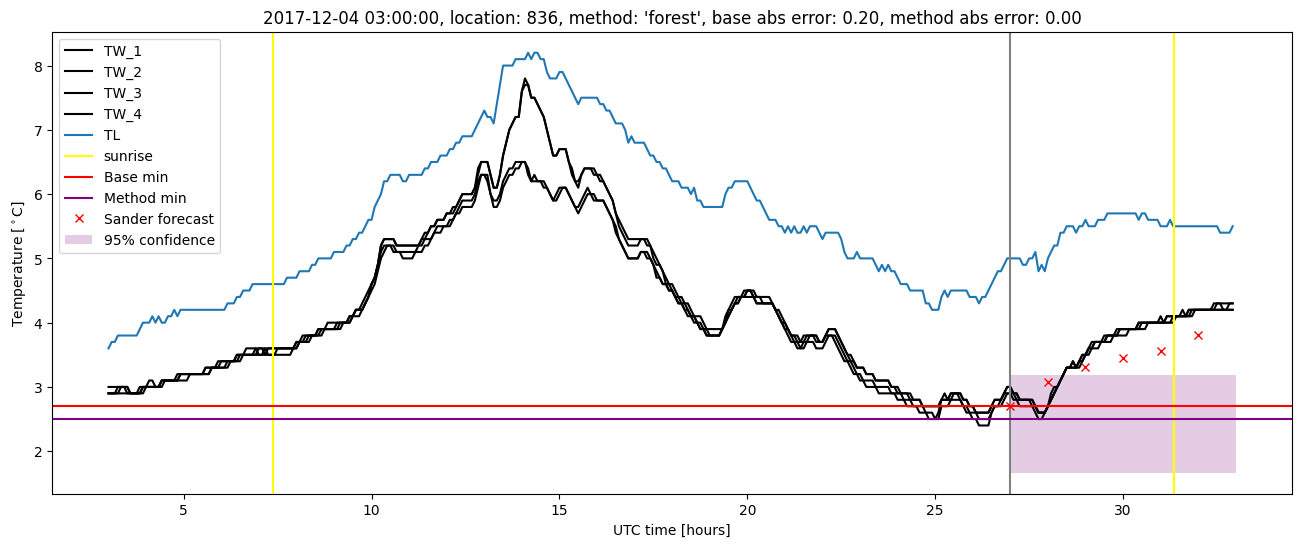
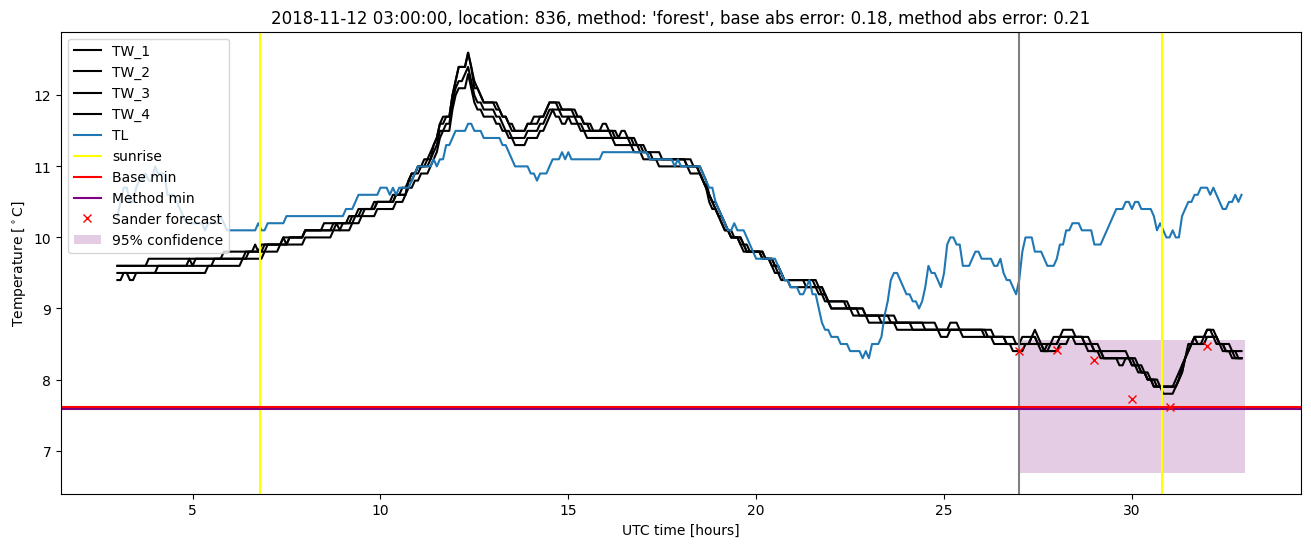
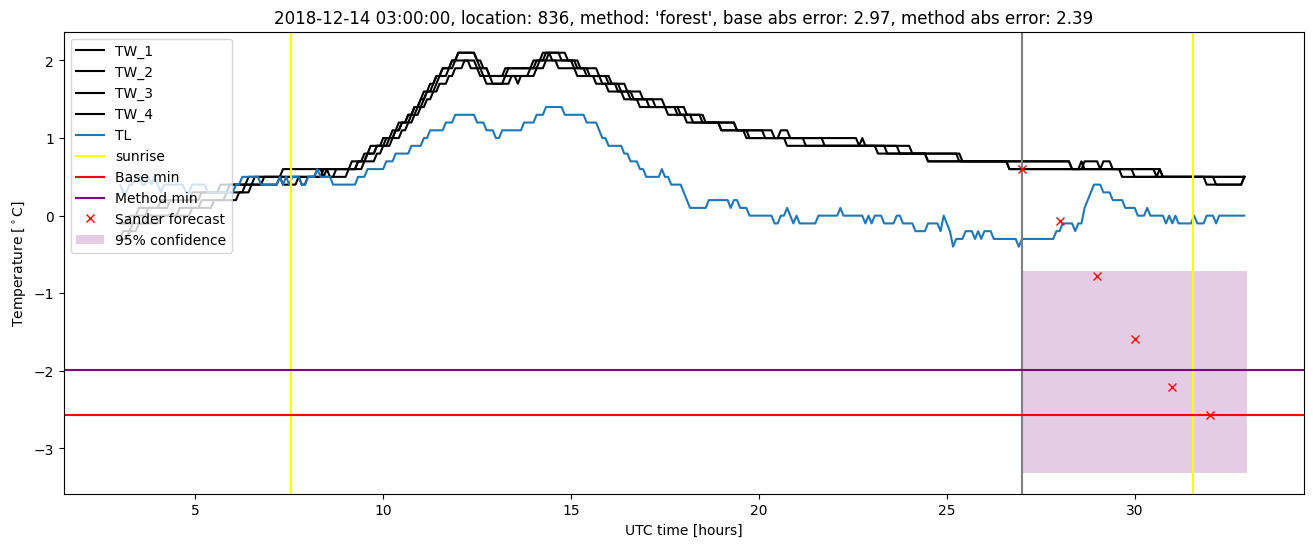
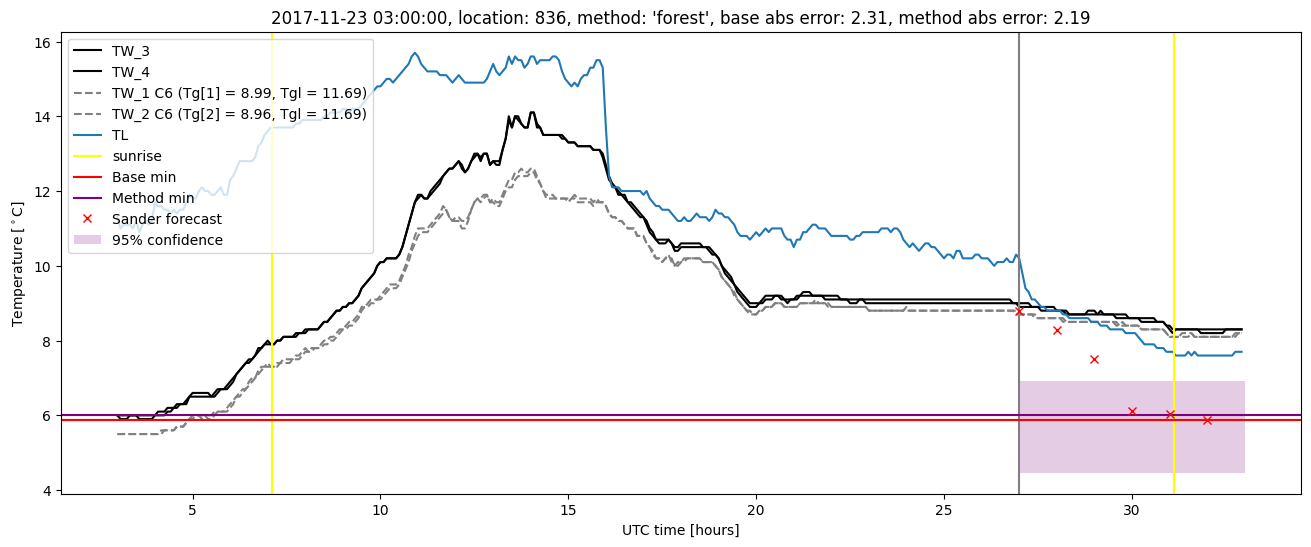
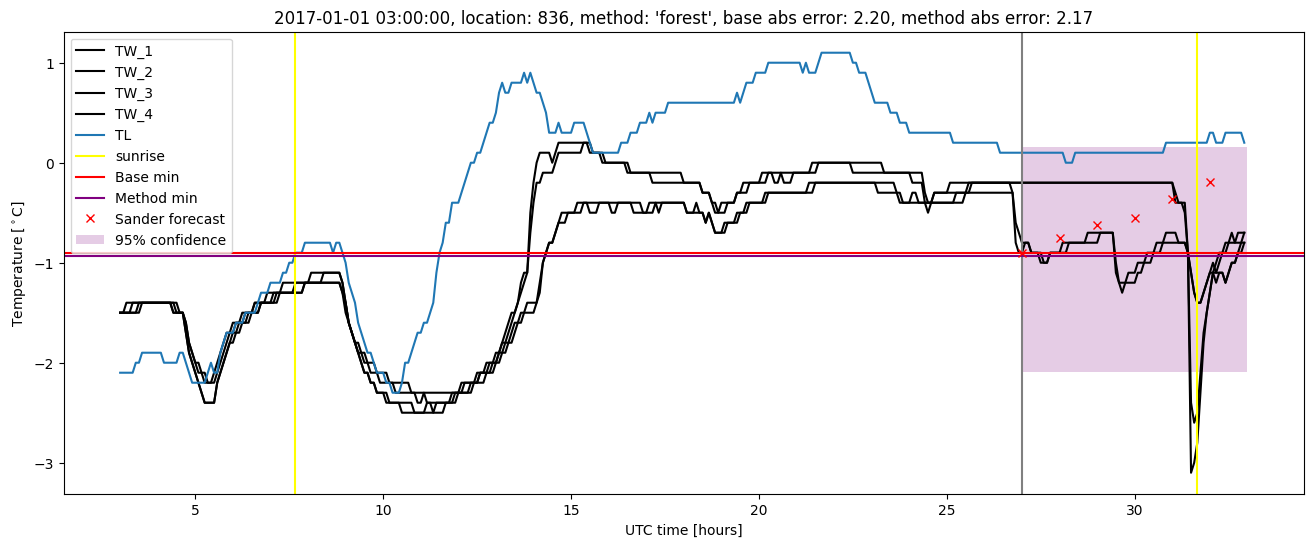
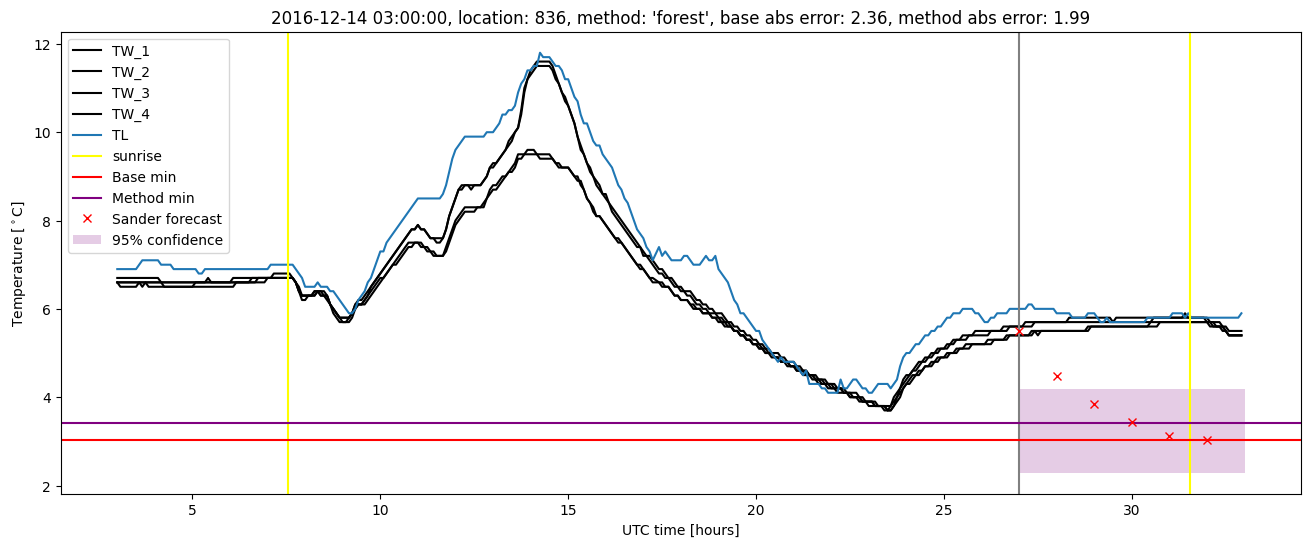
Random forest results
| names |
period |
power |
significance |
meanSquareError |
absError |
maxError |
CRPS |
IGN |
| baseline |
winter 2016 |
0.976 |
0.043 |
0.281 |
0.405 |
1.623 |
NaN |
NaN |
| forest |
winter 2016 |
0.976 |
0.130 |
0.238 |
0.365 |
1.484 |
0.466 |
2.977 |
| baseline |
winter 2017 |
0.980 |
0.050 |
0.413 |
0.460 |
2.364 |
NaN |
NaN |
| forest |
winter 2017 |
0.971 |
0.050 |
0.345 |
0.424 |
2.169 |
0.456 |
3.189 |
| baseline |
winter 2018 |
0.987 |
0.088 |
0.463 |
0.504 |
2.403 |
NaN |
NaN |
| forest |
winter 2018 |
0.993 |
0.088 |
0.369 |
0.439 |
2.191 |
0.450 |
3.299 |
| baseline |
winter 2019 |
0.986 |
0.000e+00 |
0.355 |
0.415 |
2.967 |
NaN |
NaN |
| forest |
winter 2019 |
0.986 |
0.042 |
0.269 |
0.371 |
2.388 |
0.425 |
2.169 |
| baseline |
all |
0.982 |
0.050 |
0.376 |
0.446 |
2.967 |
NaN |
NaN |
| forest |
all |
0.982 |
0.074 |
0.304 |
0.399 |
2.388 |
0.450 |
2.915 |
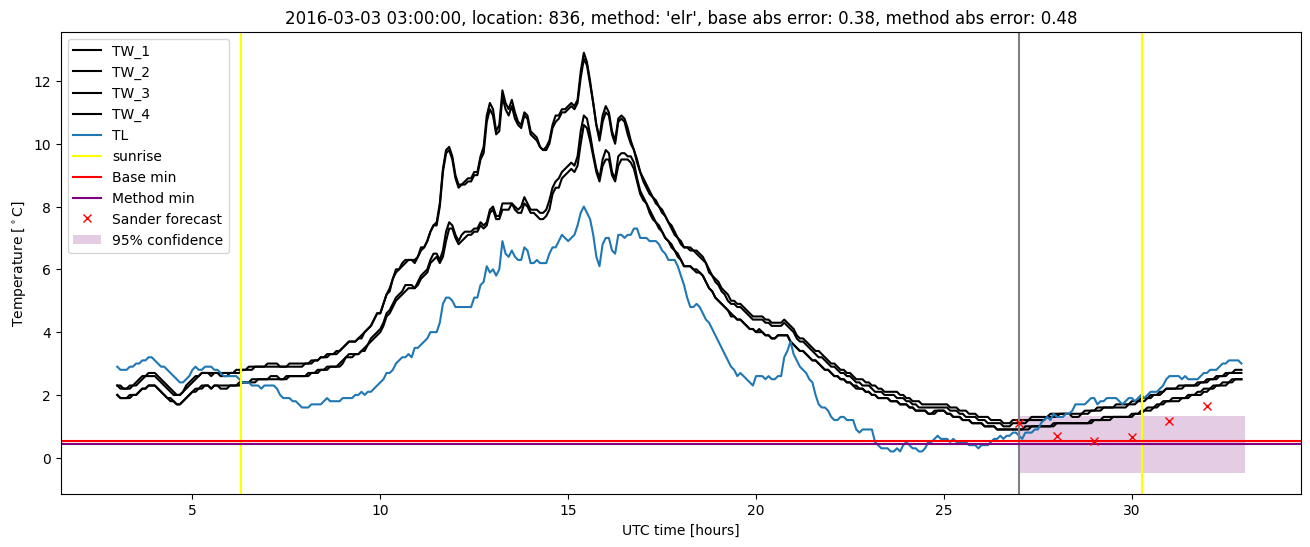
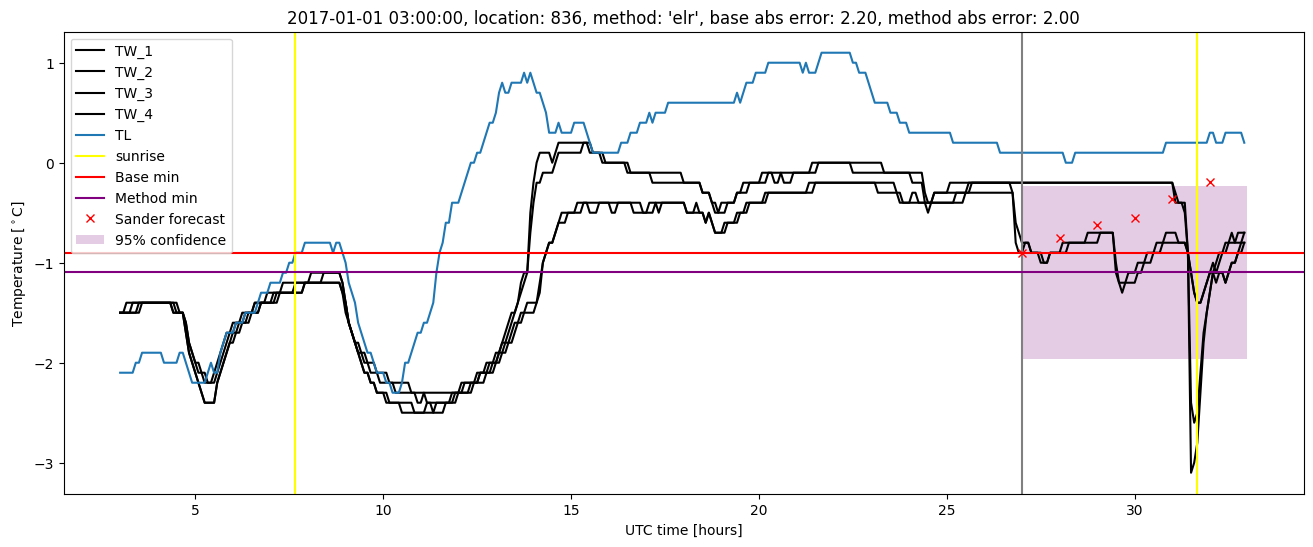
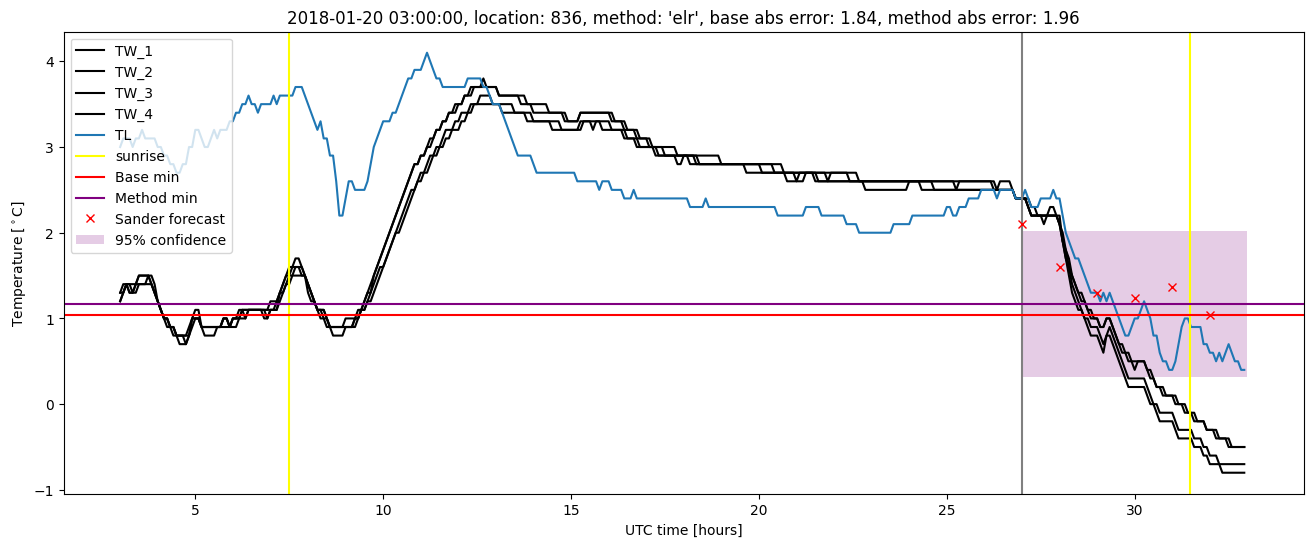
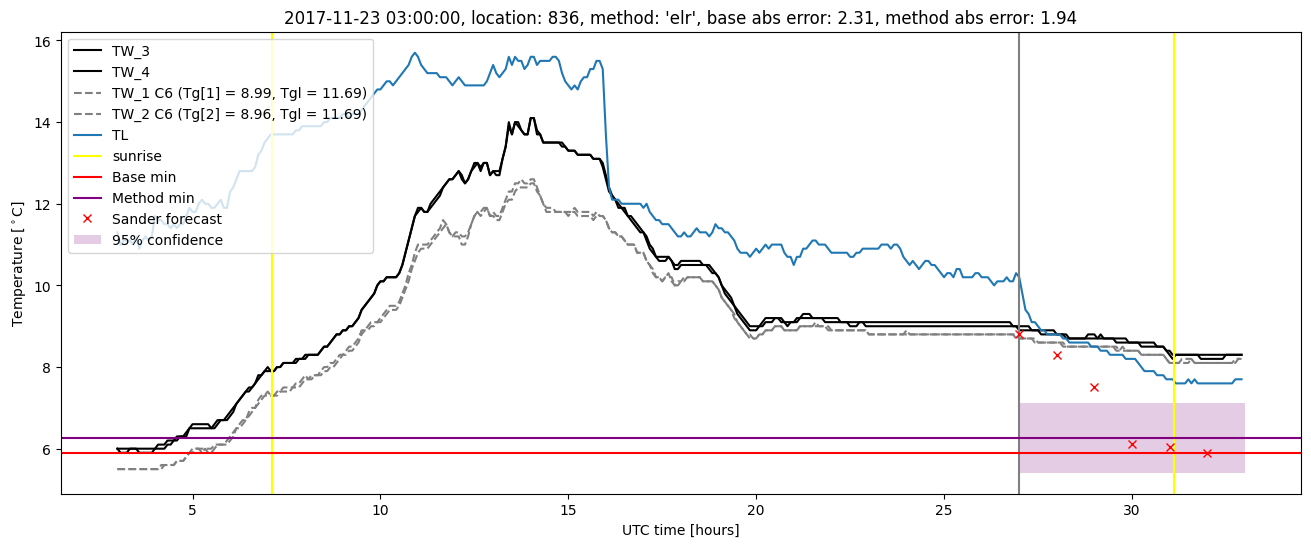
Random forest plots
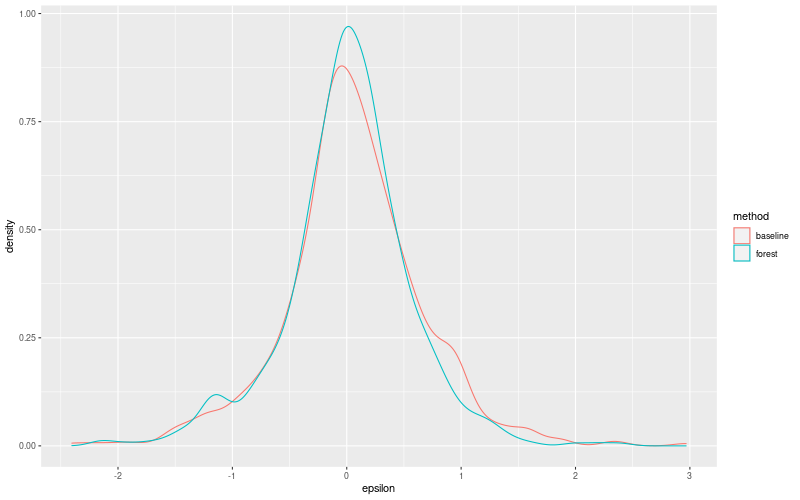
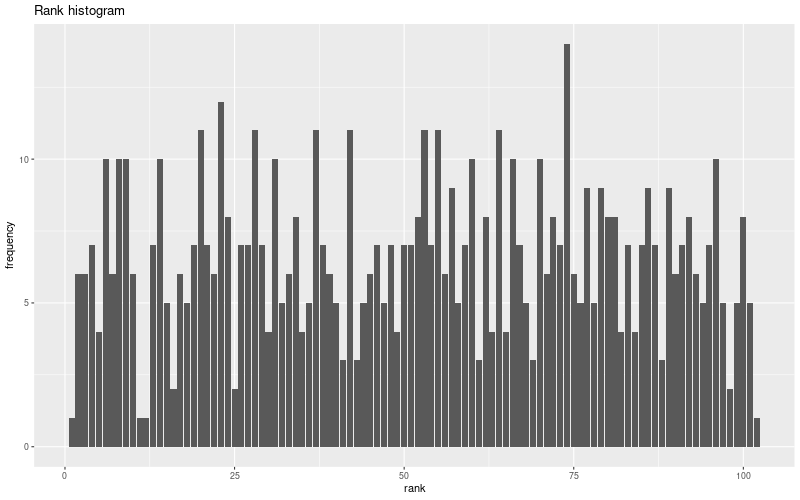

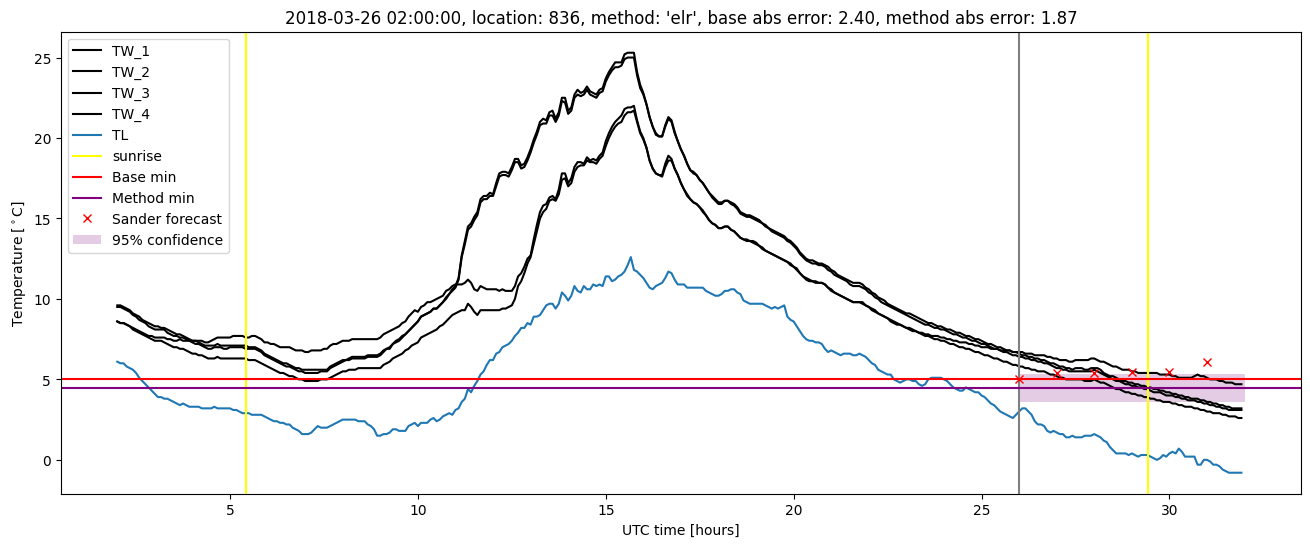
Extended logistic regression results
| names |
period |
power |
significance |
meanSquareError |
absError |
maxError |
CRPS |
IGN |
| baseline |
winter 2016 |
0.976 |
0.043 |
0.281 |
0.405 |
1.623 |
NaN |
NaN |
| elr |
winter 2016 |
0.969 |
0.043 |
0.255 |
0.384 |
1.782 |
0.528 |
3.805 |
| baseline |
winter 2017 |
0.980 |
0.050 |
0.413 |
0.460 |
2.364 |
NaN |
NaN |
| elr |
winter 2017 |
0.971 |
0.025 |
0.346 |
0.442 |
2.003 |
0.538 |
4.601 |
| baseline |
winter 2018 |
0.987 |
0.088 |
0.463 |
0.504 |
2.403 |
NaN |
NaN |
| elr |
winter 2018 |
0.993 |
0.088 |
0.359 |
0.440 |
1.964 |
0.492 |
3.949 |
| baseline |
winter 2019 |
0.986 |
0.000e+00 |
0.355 |
0.415 |
2.967 |
NaN |
NaN |
| elr |
winter 2019 |
0.986 |
0.042 |
0.270 |
0.389 |
1.858 |
0.457 |
2.900 |
| baseline |
all |
0.982 |
0.050 |
0.376 |
0.446 |
2.967 |
NaN |
NaN |
| elr |
all |
0.980 |
0.050 |
0.306 |
0.412 |
2.003 |
0.503 |
3.794 |
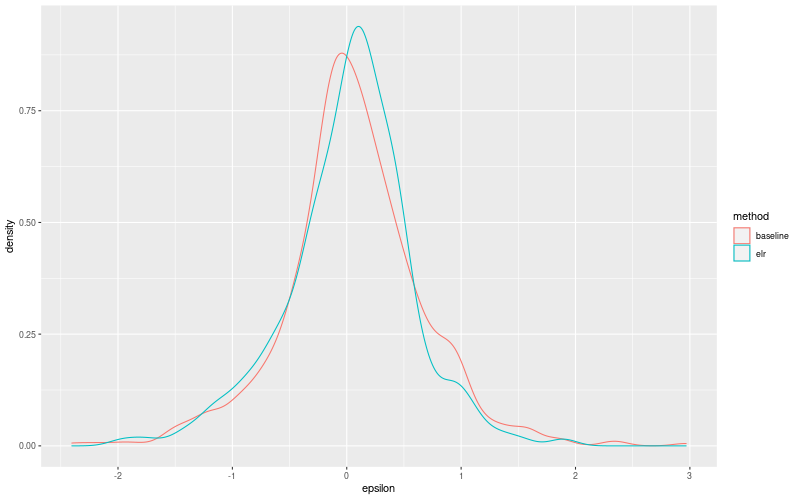
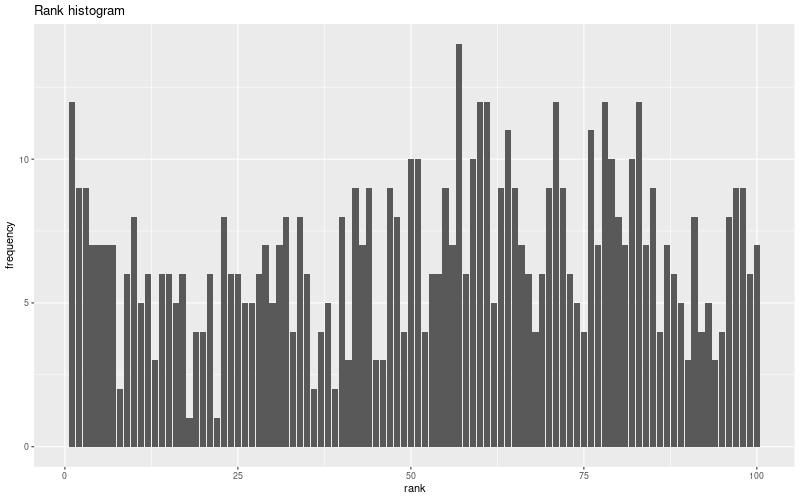
Extended logistic regression plots