GMS location: 835
Random forest results
| names |
period |
power |
significance |
meanSquareError |
absError |
maxError |
CRPS |
IGN |
| baseline |
winter 2016 |
0.994 |
0.050 |
0.327 |
0.387 |
2.722 |
NaN |
NaN |
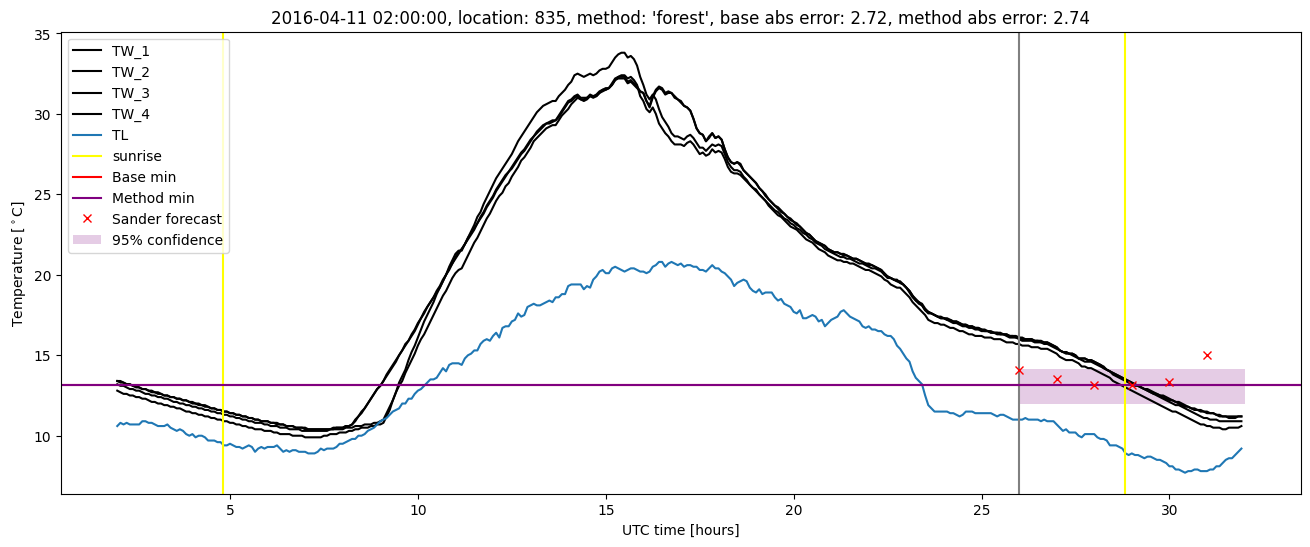
| forest |
winter 2016 |
0.988 |
0.150 |
0.300 |
0.368 |
2.739 |
0.472 |
4.419 |
| baseline |
winter 2017 |
0.991 |
0.051 |
0.270 |
0.359 |
2.357 |
NaN |
NaN |
| forest |
winter 2017 |
1.000 |
0.077 |
0.246 |
0.361 |
2.021 |
0.467 |
3.522 |
| baseline |
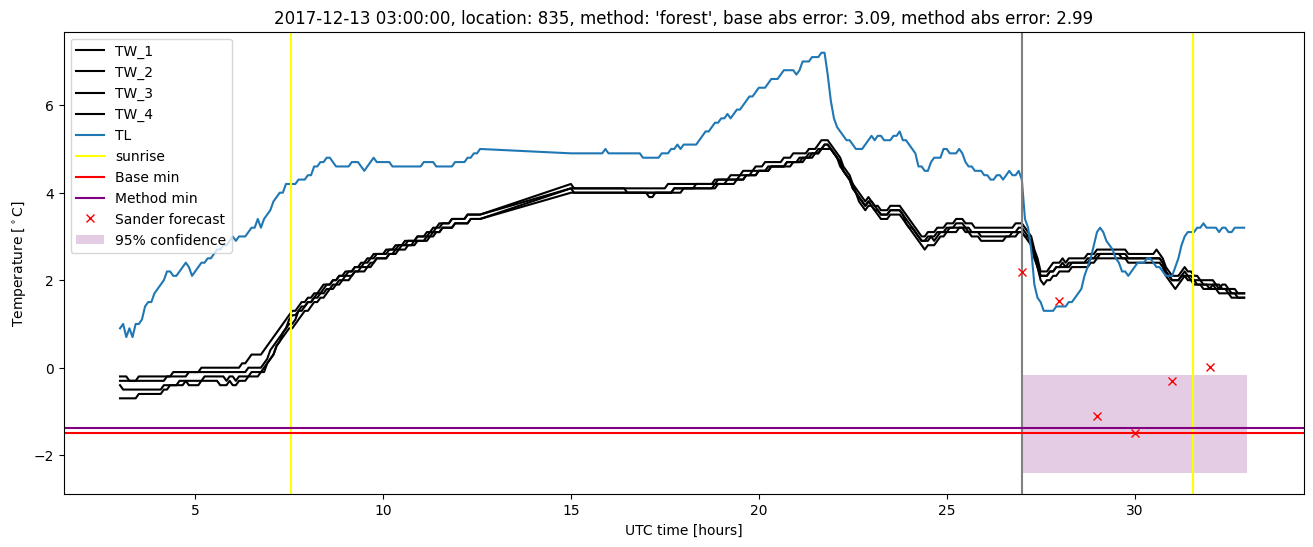
winter 2018 |
0.979 |
0.143 |
0.382 |
0.417 |
3.089 |
NaN |
NaN |
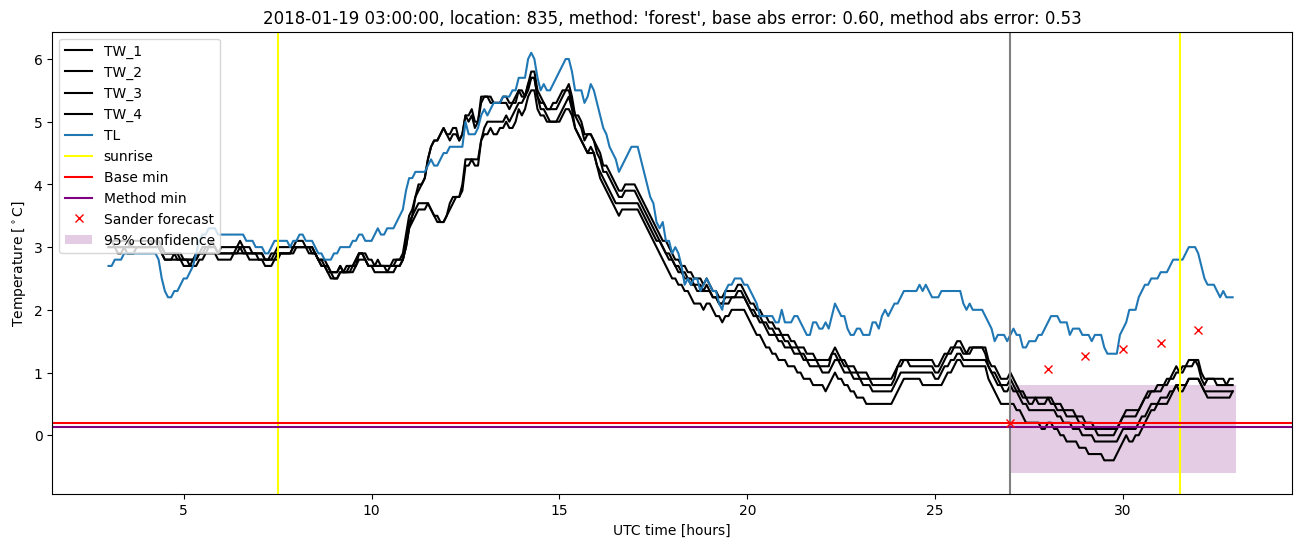
| forest |
winter 2018 |
0.972 |
0.143 |
0.364 |
0.409 |
2.989 |
0.470 |
4.088 |
| baseline |
winter 2019 |
0.984 |
0.000e+00 |
0.283 |
0.374 |
2.354 |
NaN |
NaN |
| forest |
winter 2019 |
0.984 |
0.000e+00 |
0.254 |
0.362 |
1.728 |
0.459 |
3.011 |
| baseline |
all |
0.987 |
0.064 |
0.318 |
0.385 |
3.089 |
NaN |
NaN |
| forest |
all |
0.985 |
0.096 |
0.294 |
0.376 |
2.989 |
0.468 |
3.817 |
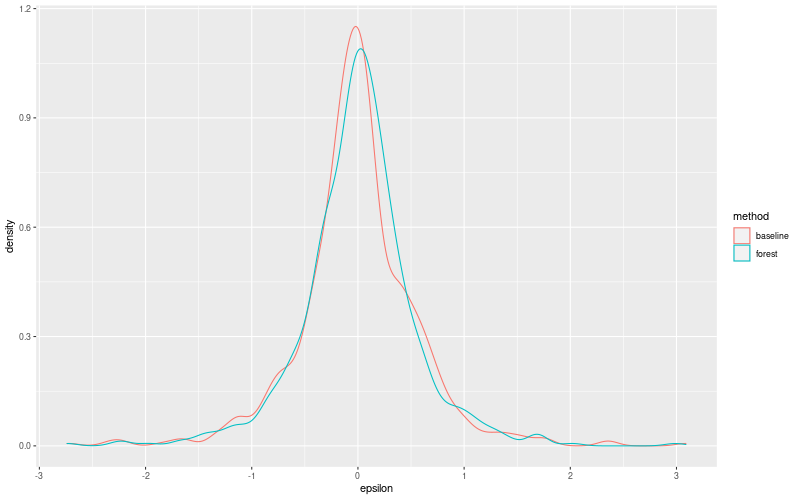
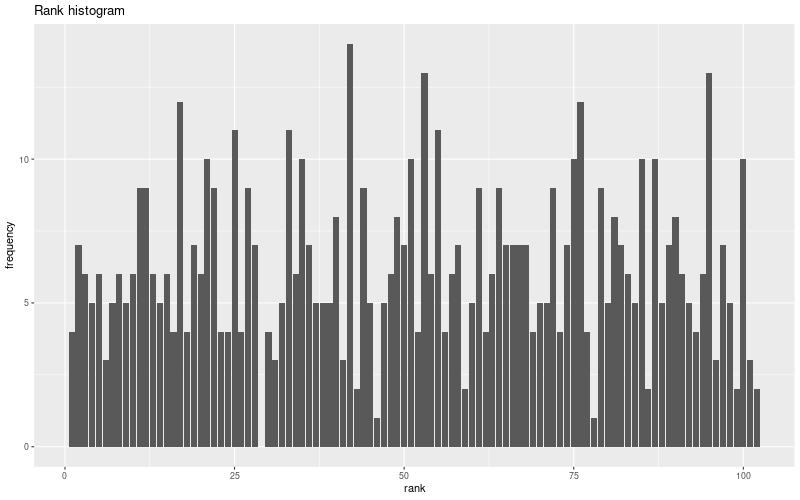
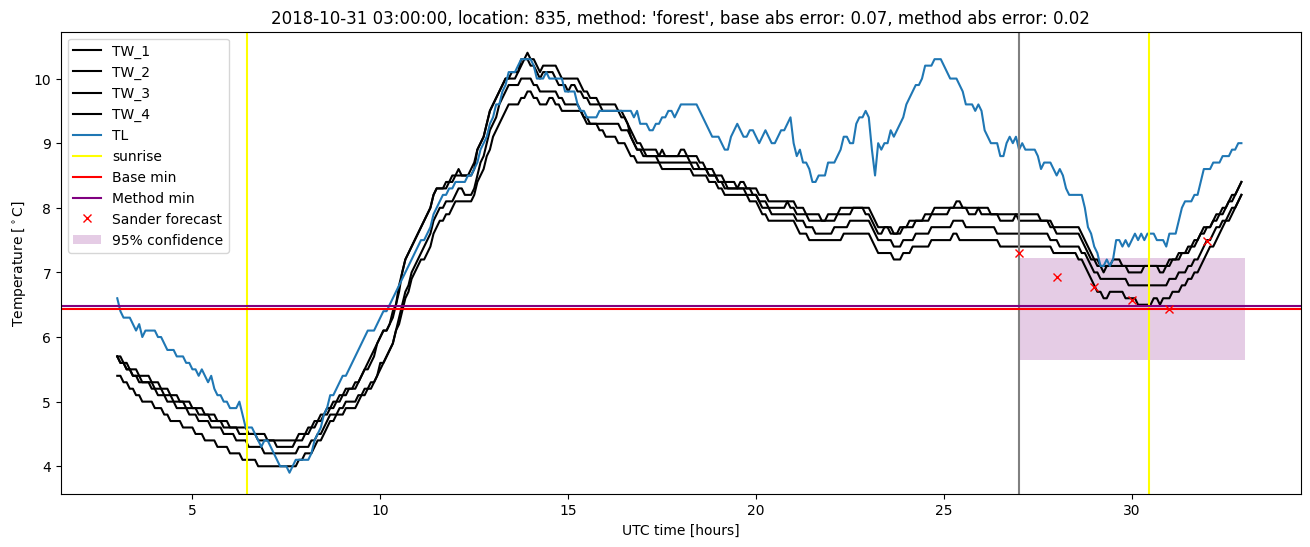
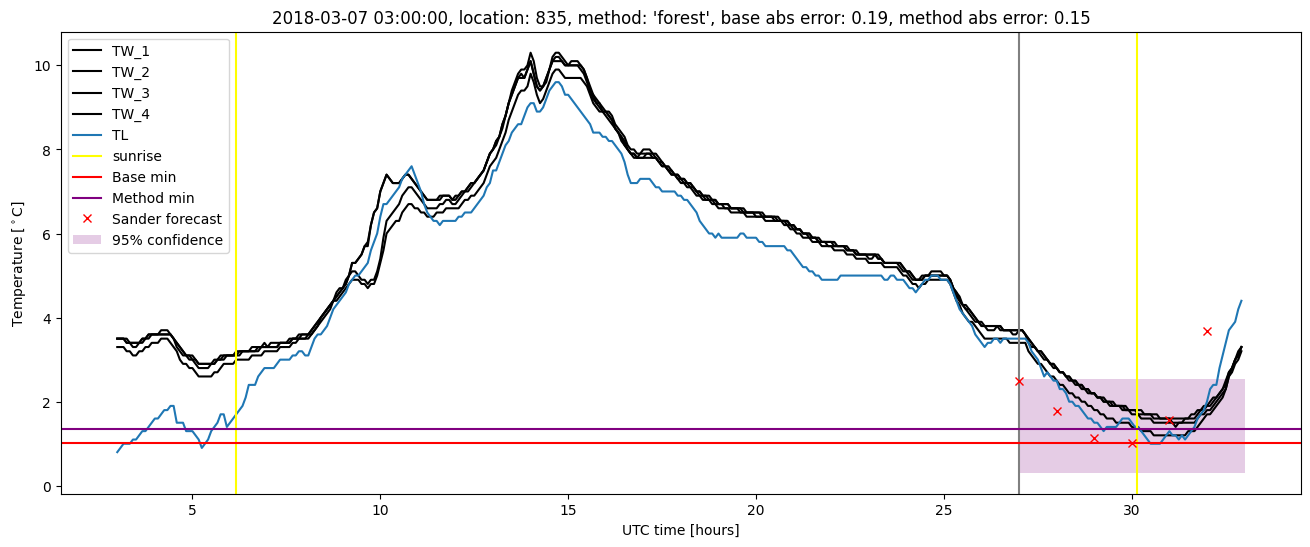
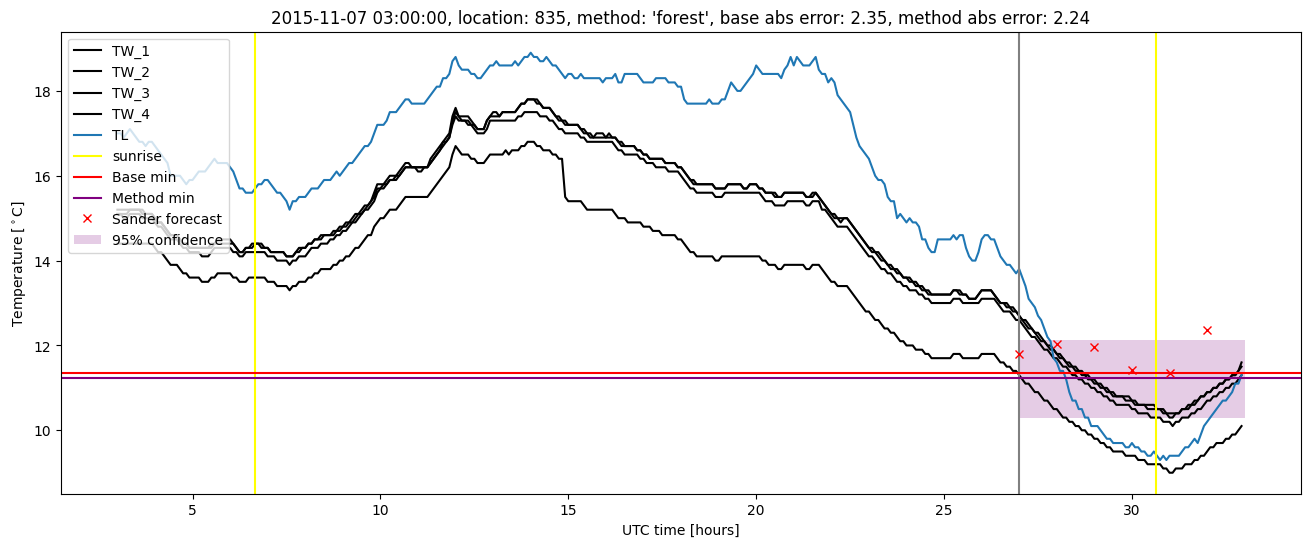
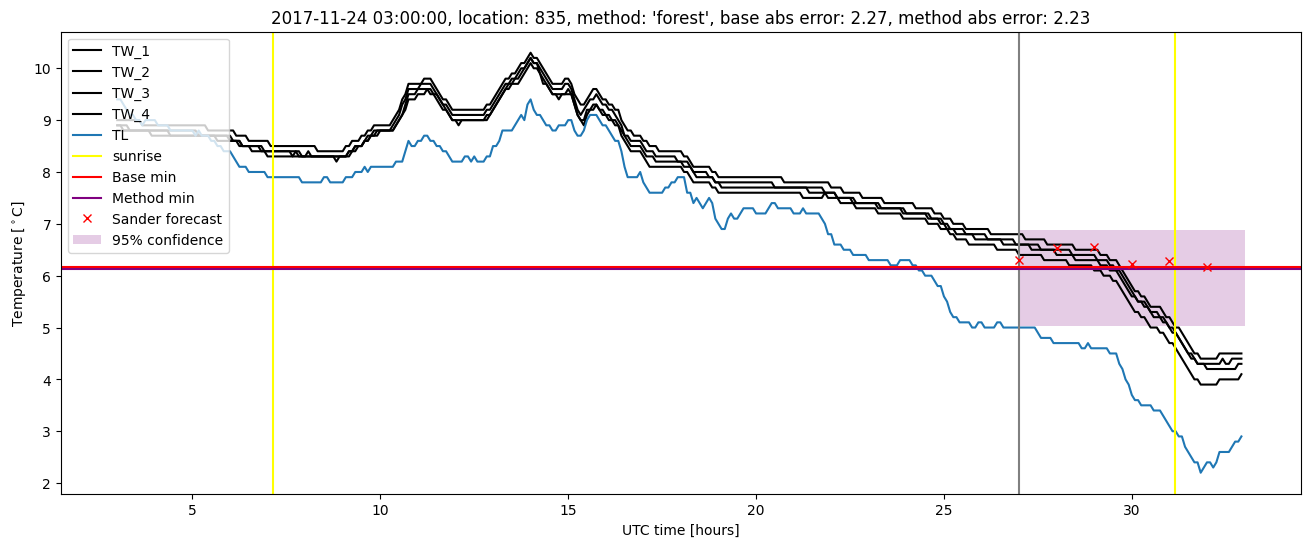
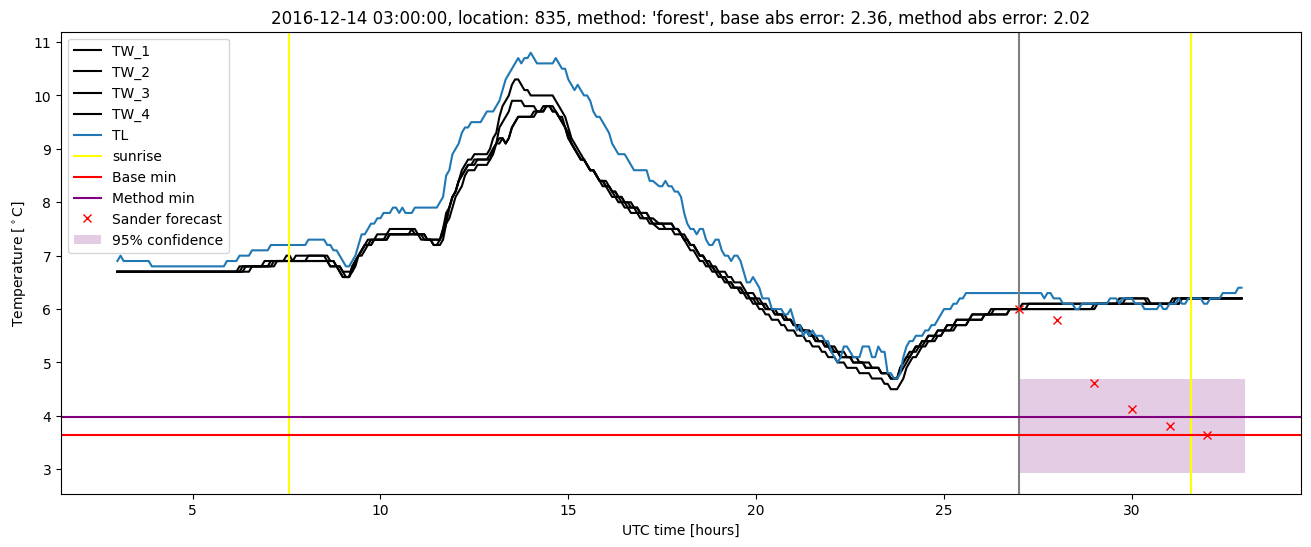
Random forest plots
Extended logistic regression results
| names |
period |
power |
significance |
meanSquareError |
absError |
maxError |
CRPS |
IGN |
| baseline |
winter 2016 |
0.994 |
0.050 |
0.327 |
0.387 |
2.722 |
NaN |
NaN |
| elr |
winter 2016 |
0.988 |
0.000e+00 |
0.327 |
0.403 |
2.717 |
0.537 |
5.032 |
| baseline |
winter 2017 |
0.991 |
0.051 |
0.270 |
0.359 |
2.357 |
NaN |
NaN |
| elr |
winter 2017 |
0.983 |
0.077 |
0.257 |
0.372 |
2.168 |
0.514 |
3.967 |
| baseline |
winter 2018 |
0.979 |
0.143 |
0.382 |
0.417 |
3.089 |
NaN |
NaN |
| elr |
winter 2018 |
0.965 |
0.143 |
0.345 |
0.408 |
2.751 |
0.512 |
4.459 |
| baseline |
winter 2019 |
0.984 |
0.000e+00 |
0.283 |
0.374 |
2.354 |
NaN |
NaN |
| elr |
winter 2019 |
0.984 |
0.000e+00 |
0.290 |
0.382 |
1.712 |
0.511 |
3.654 |
| baseline |
all |
0.987 |
0.064 |
0.318 |
0.385 |
3.089 |
NaN |
NaN |
| elr |
all |
0.980 |
0.064 |
0.307 |
0.392 |
2.751 |
0.520 |
4.335 |
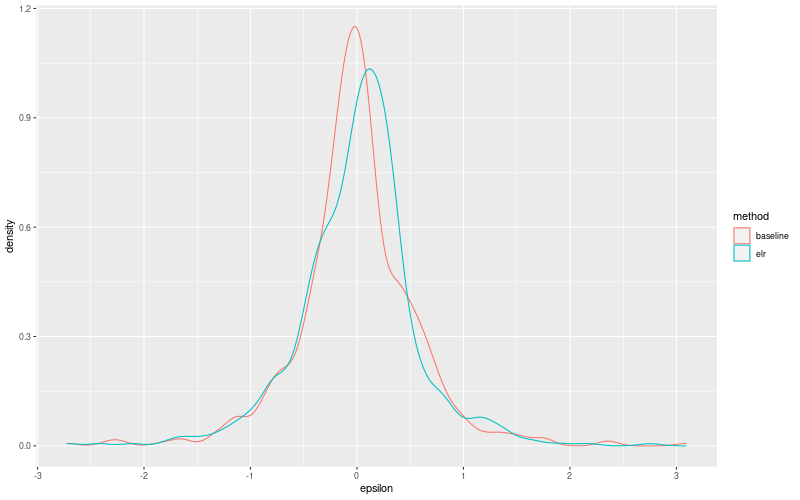
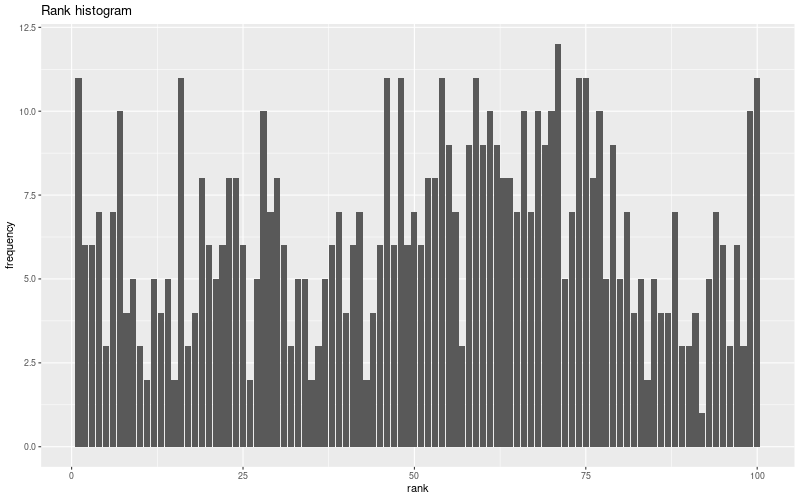
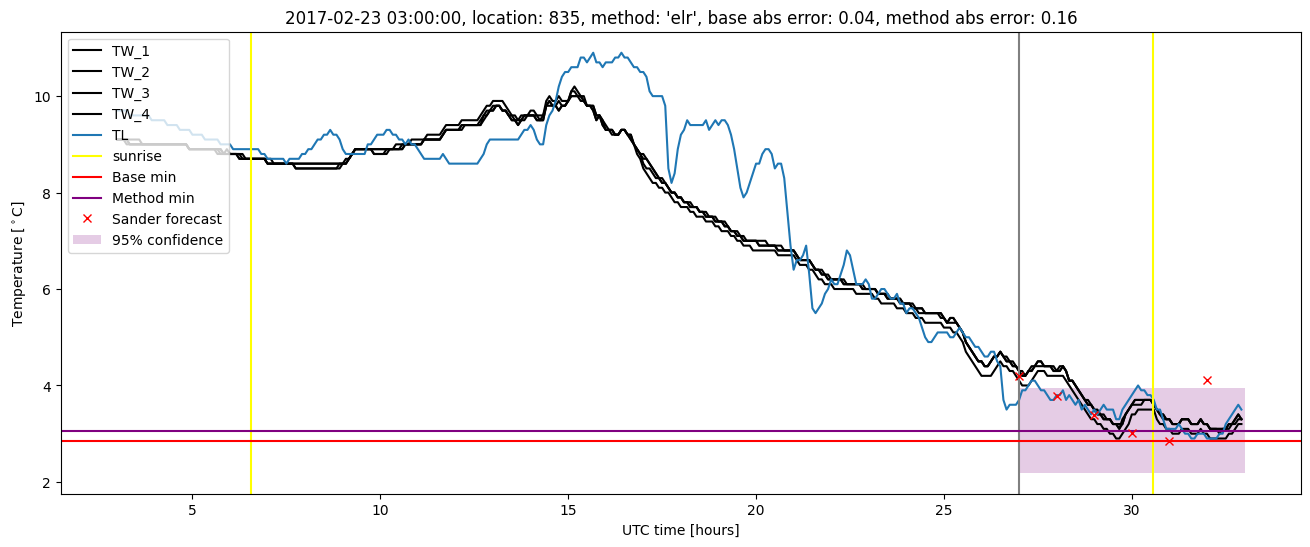
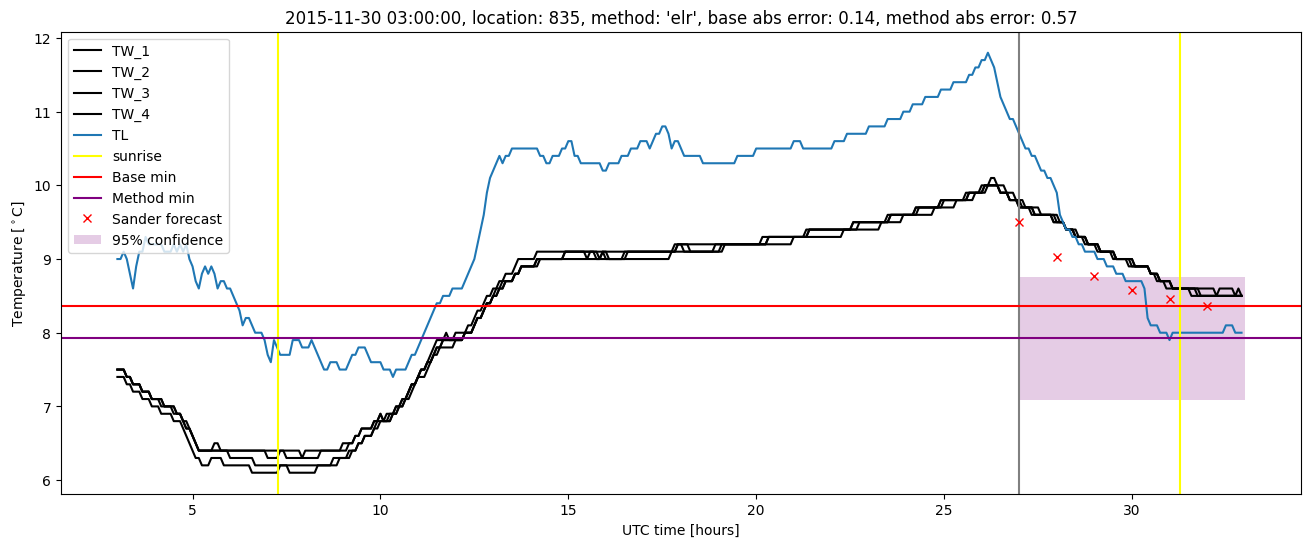
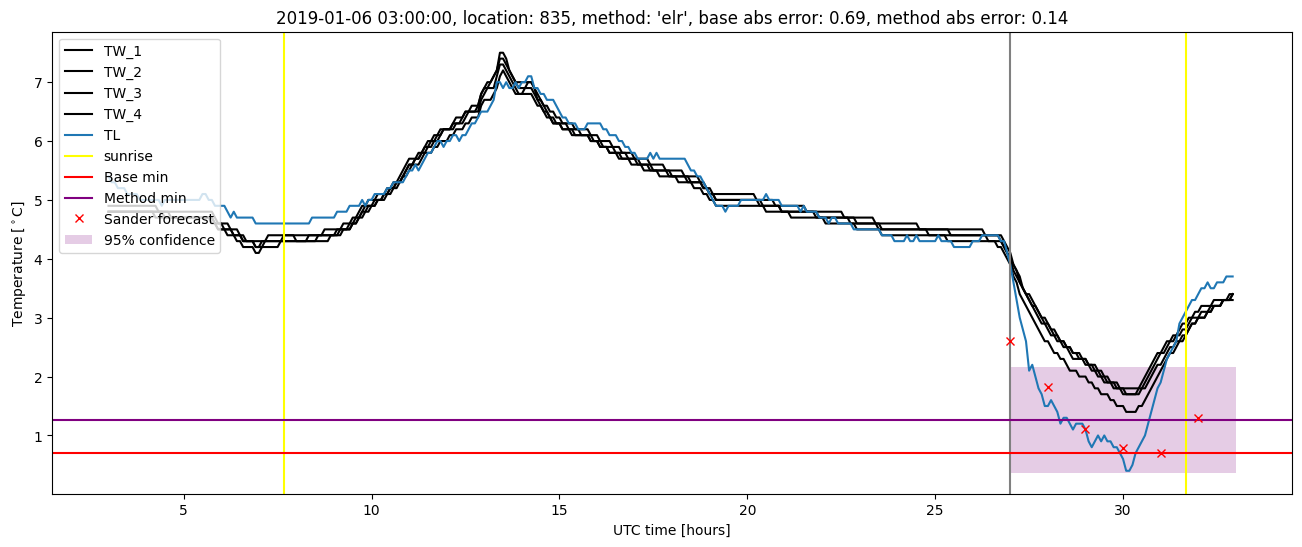
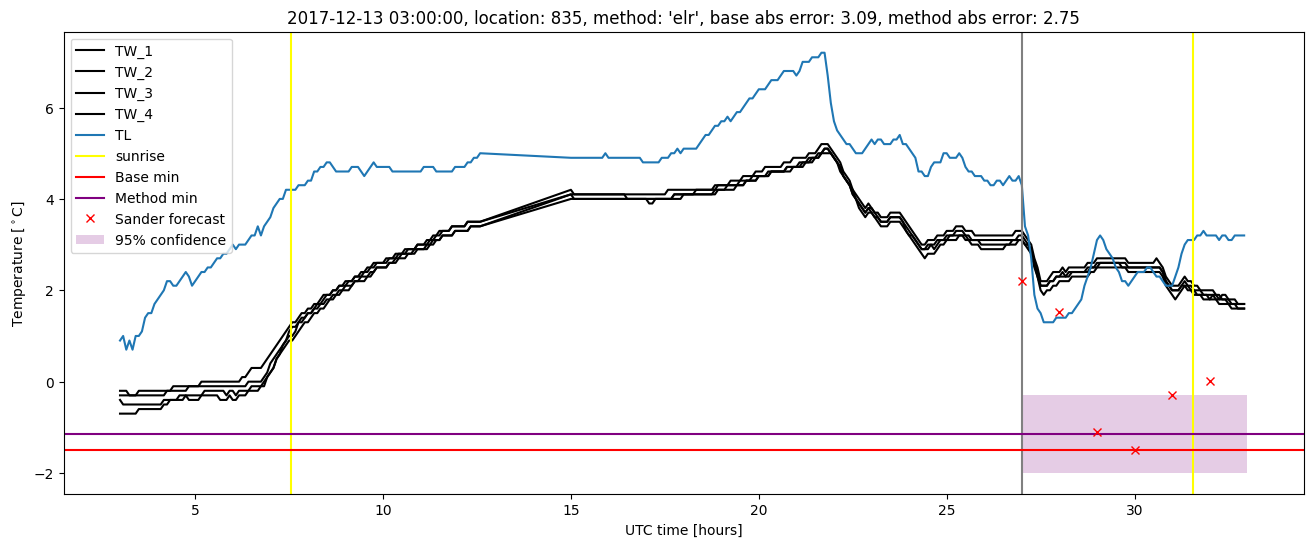
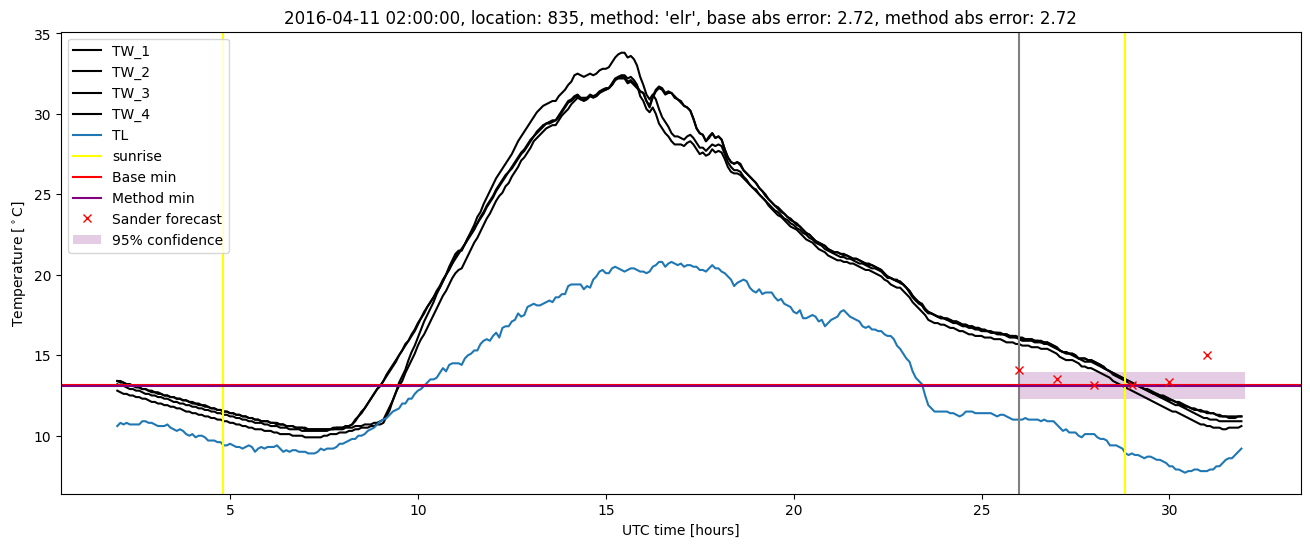
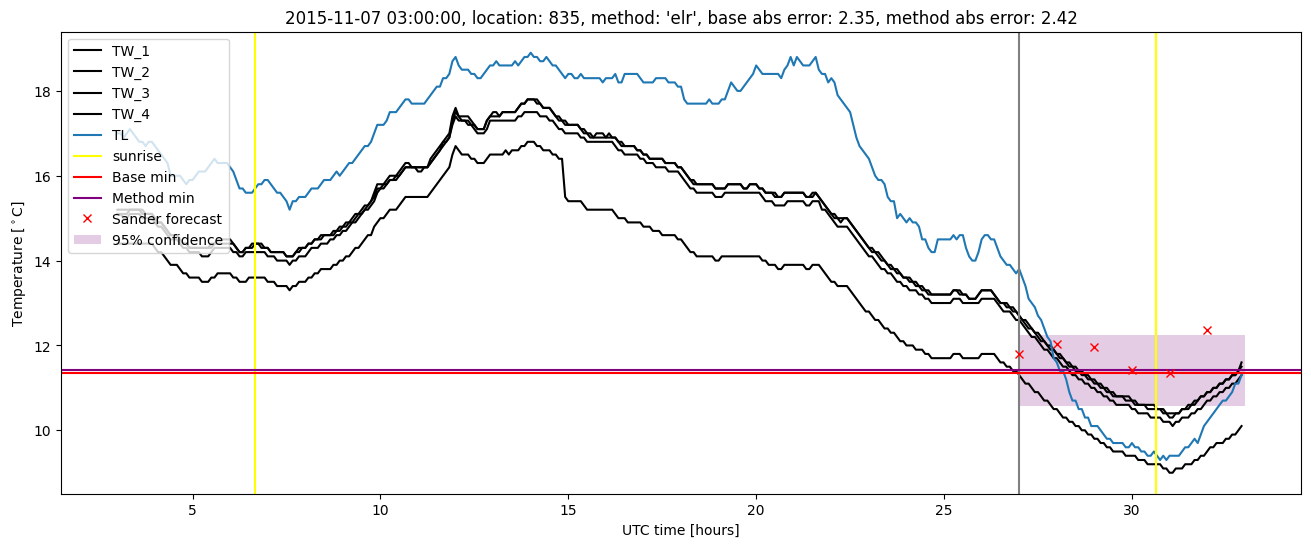
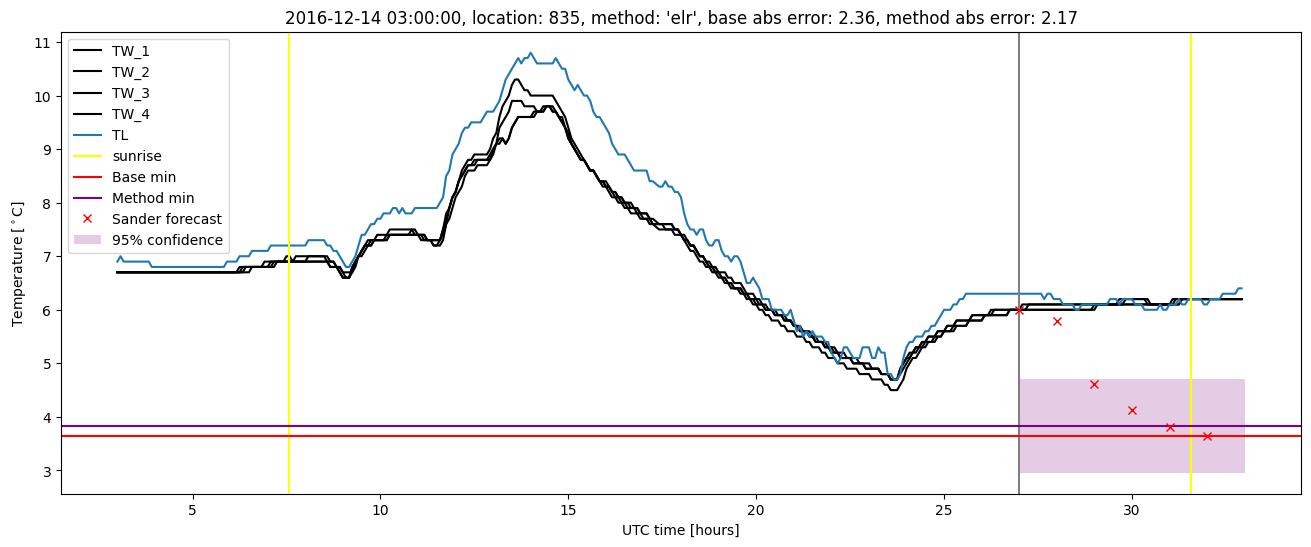
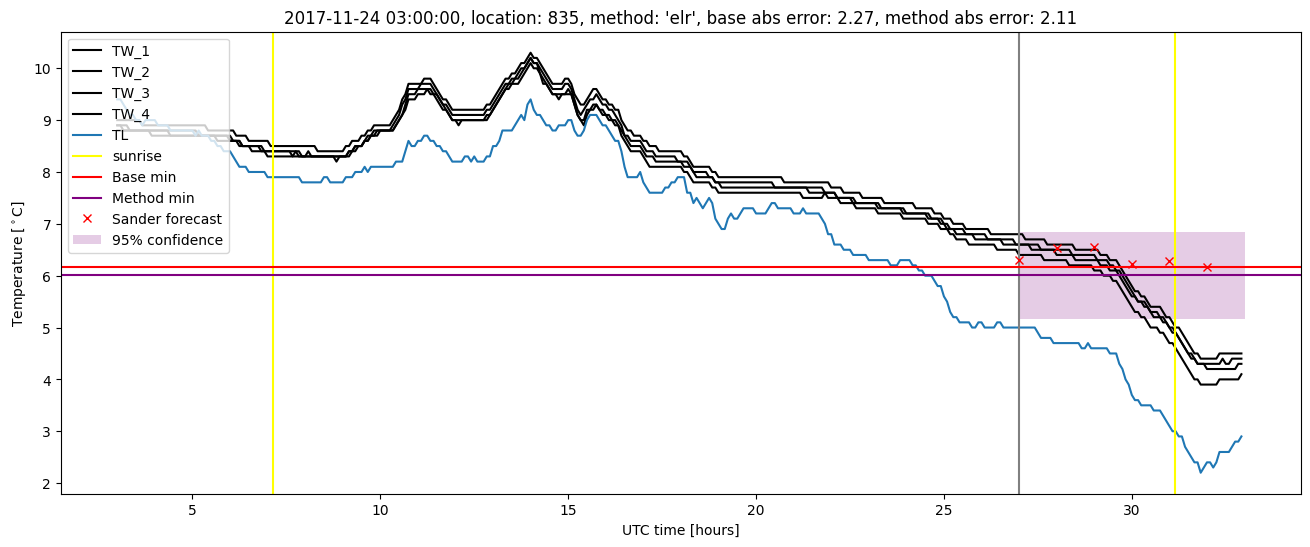
Extended logistic regression plots