GMS location: 834
Random forest results
| names |
period |
power |
significance |
meanSquareError |
absError |
maxError |
CRPS |
IGN |
| baseline |
winter 2016 |
1.000 |
0.000e+00 |
0.386 |
0.433 |
2.519 |
NaN |
NaN |
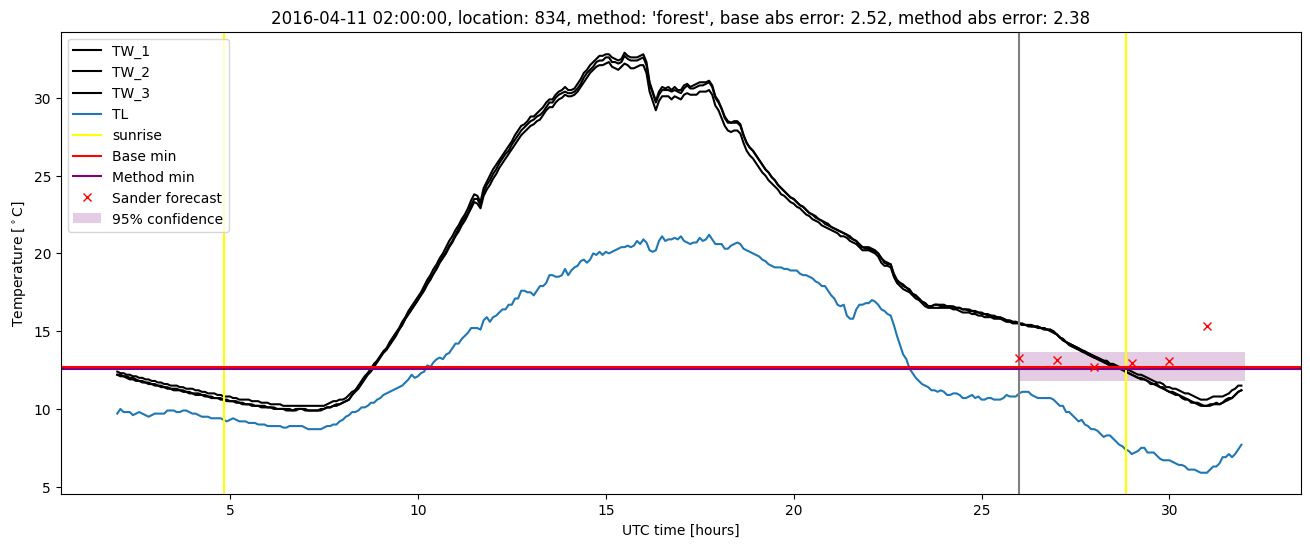
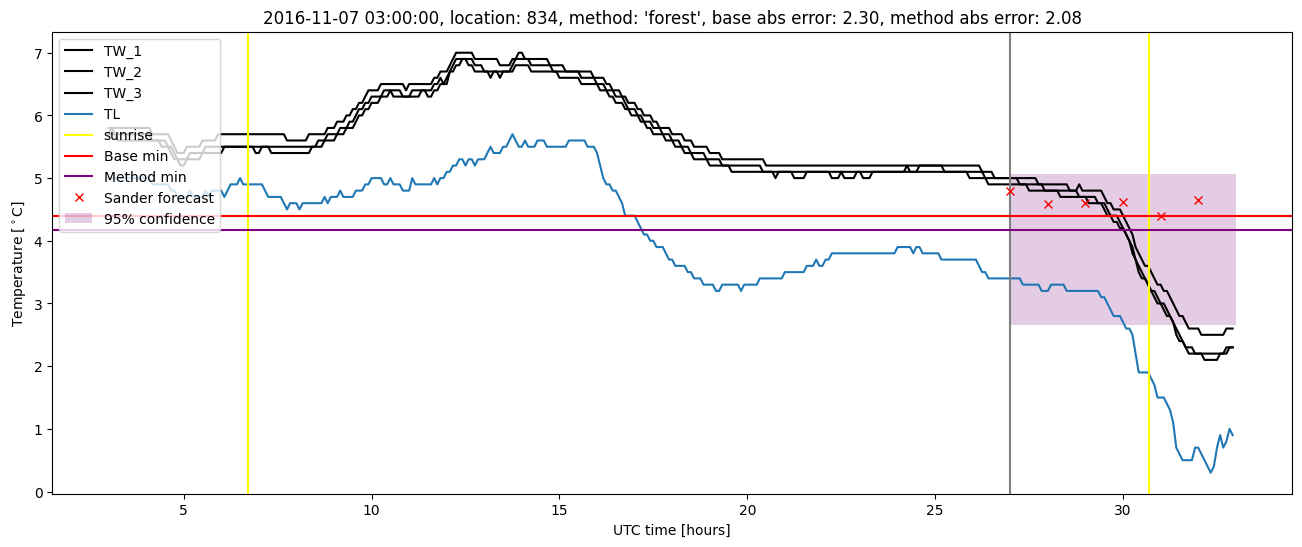
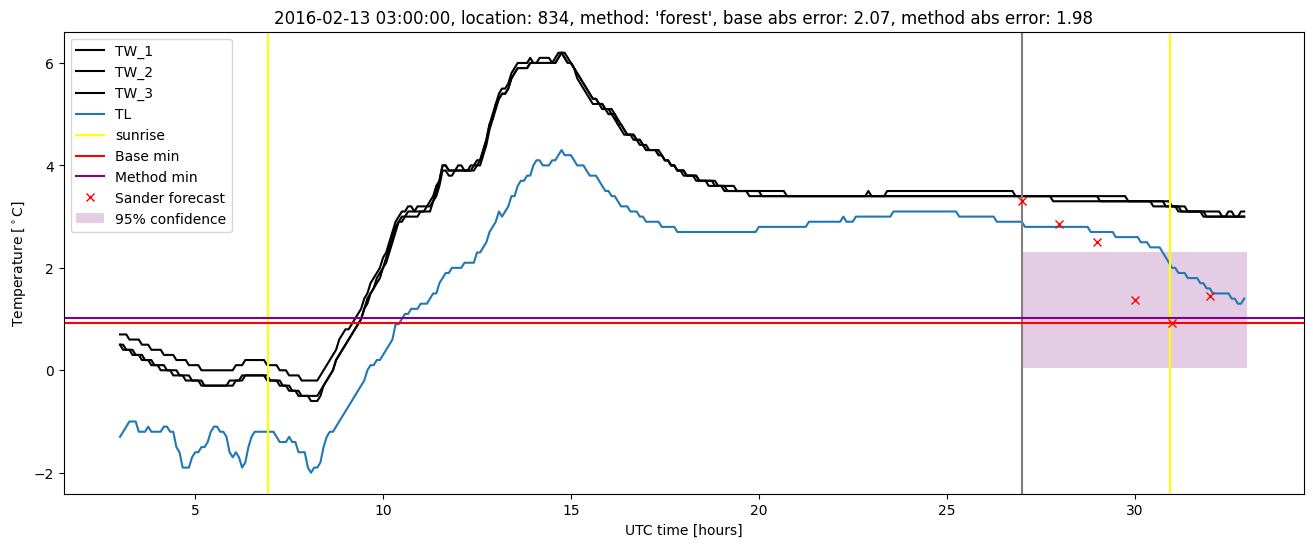
| forest |
winter 2016 |
1.000 |
0.000e+00 |
0.343 |
0.409 |
2.385 |
0.480 |
4.391 |
| baseline |
winter 2017 |
0.991 |
0.026 |
0.390 |
0.425 |
2.309 |
NaN |
NaN |
| forest |
winter 2017 |
0.991 |
0.053 |
0.332 |
0.412 |
2.079 |
0.474 |
3.460 |
| baseline |
winter 2018 |
0.971 |
0.083 |
0.367 |
0.415 |
2.304 |
NaN |
NaN |
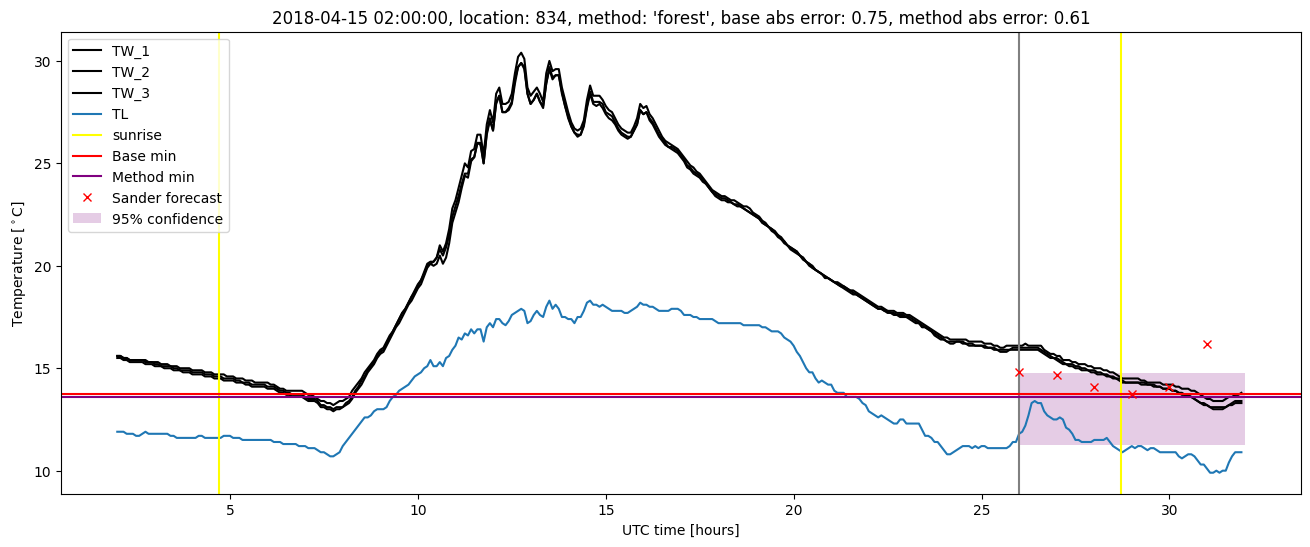
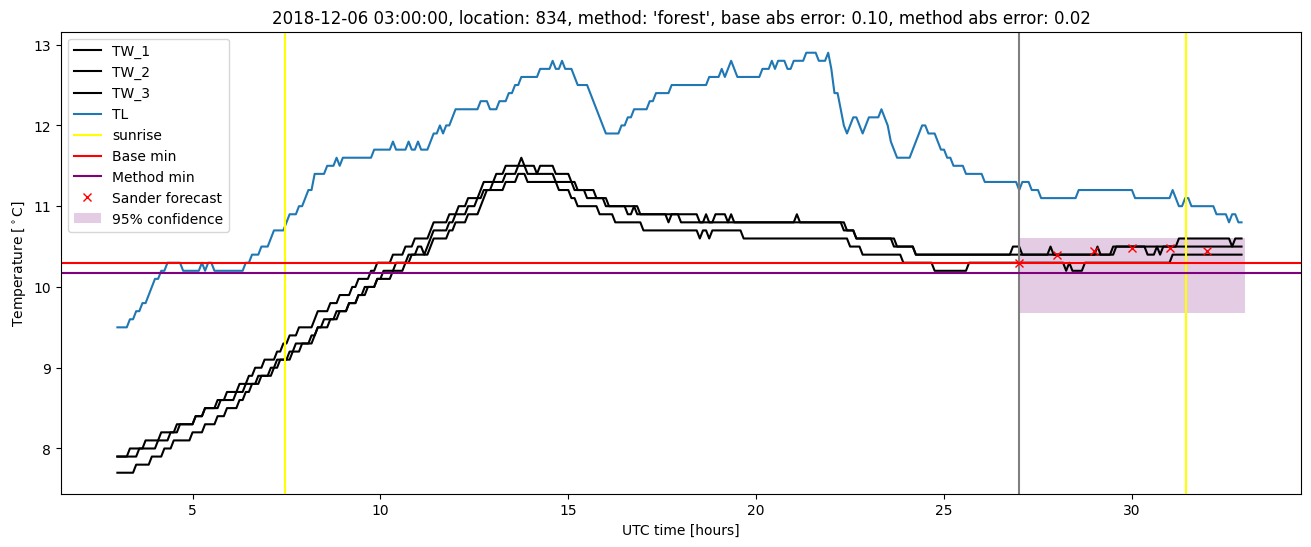
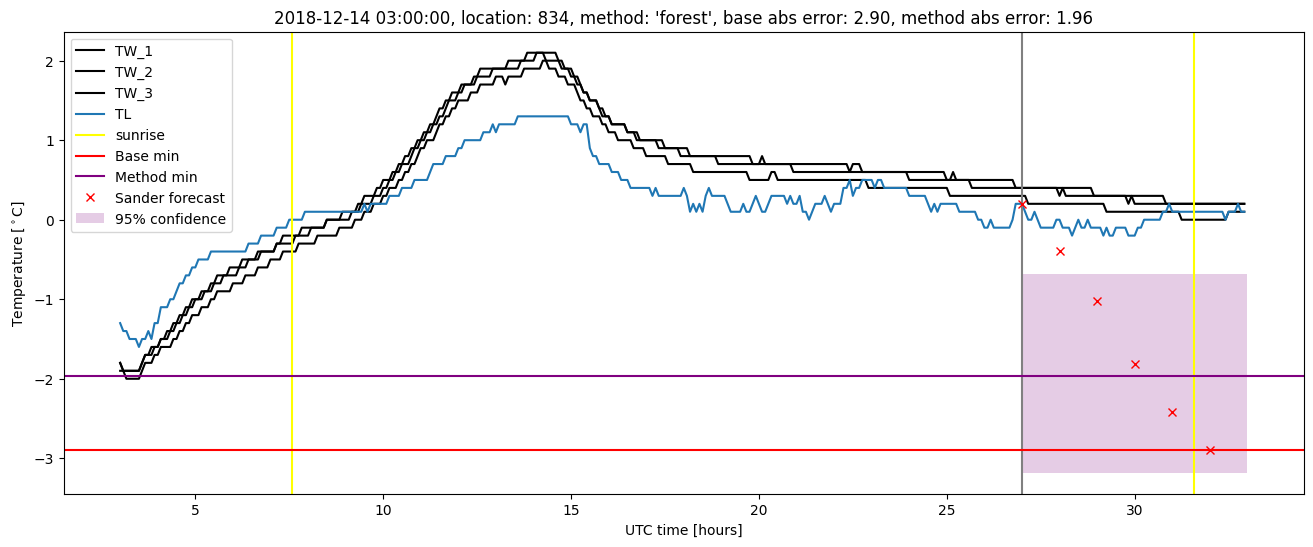
| forest |
winter 2018 |
0.971 |
0.083 |
0.328 |
0.423 |
1.908 |
0.468 |
2.619 |
| baseline |
winter 2019 |
0.985 |
0.000e+00 |
0.327 |
0.393 |
2.898 |
NaN |
NaN |
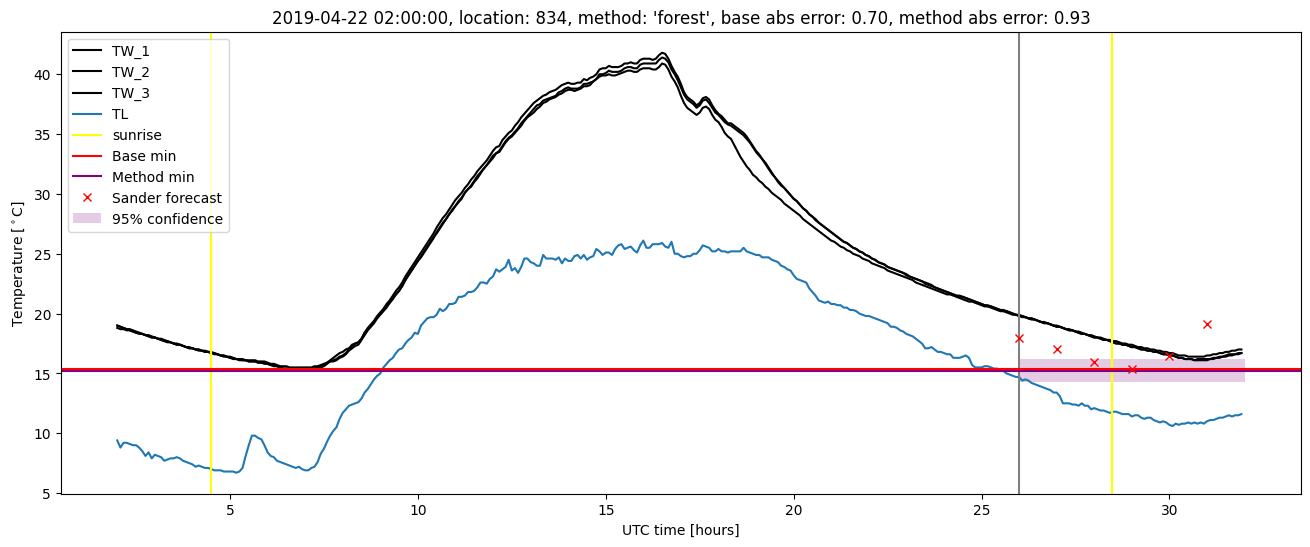
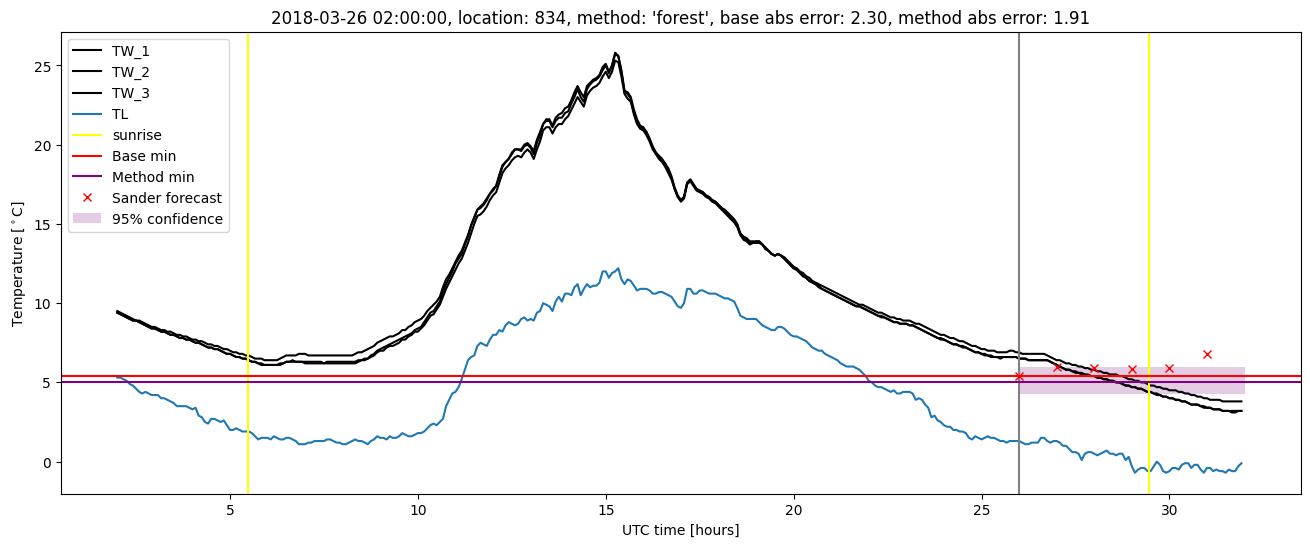
| forest |
winter 2019 |
0.992 |
0.000e+00 |
0.249 |
0.362 |
1.962 |
0.470 |
2.482 |
| baseline |
all |
0.987 |
0.031 |
0.368 |
0.417 |
2.898 |
NaN |
NaN |
| forest |
all |
0.989 |
0.041 |
0.315 |
0.402 |
2.385 |
0.473 |
3.271 |
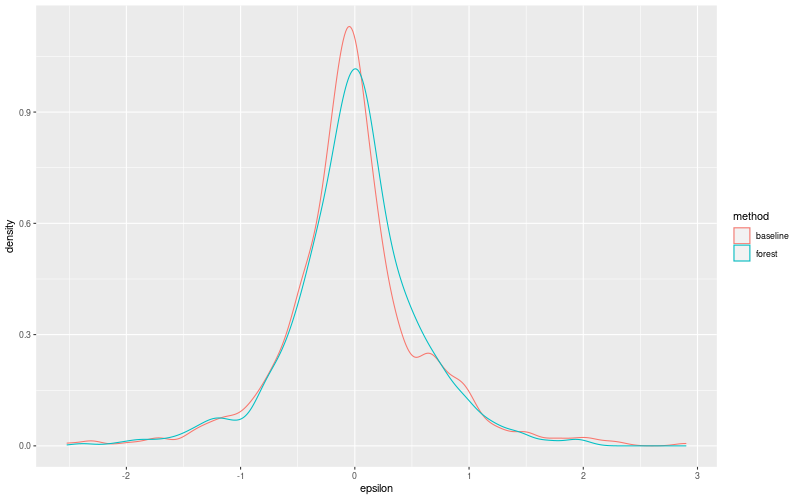
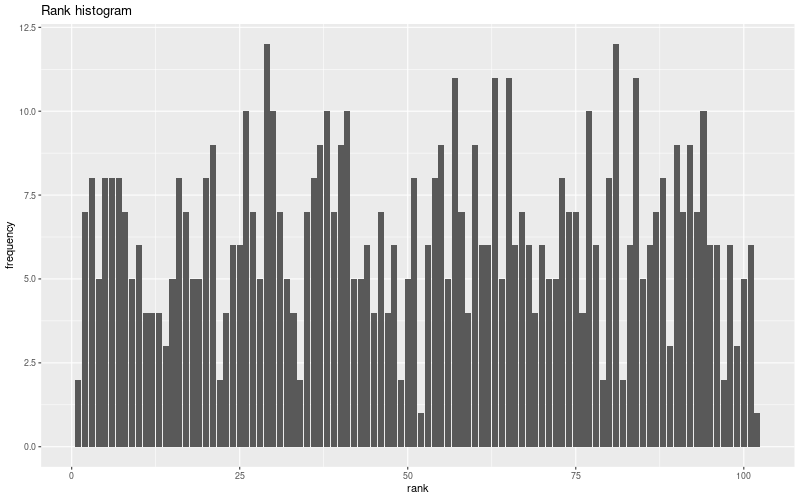
Random forest plots
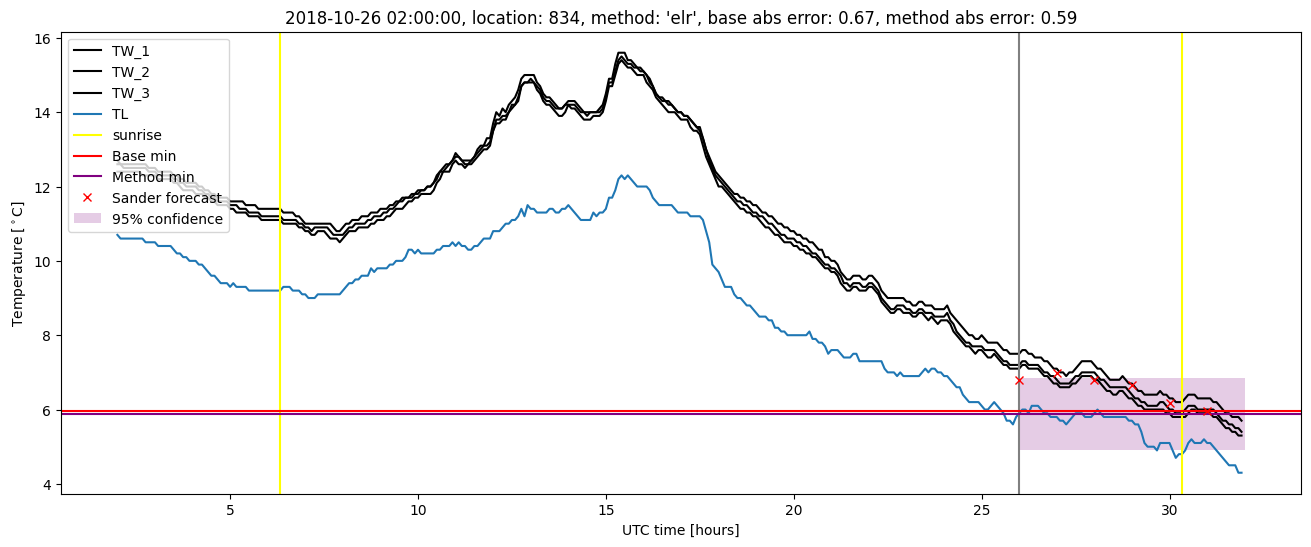
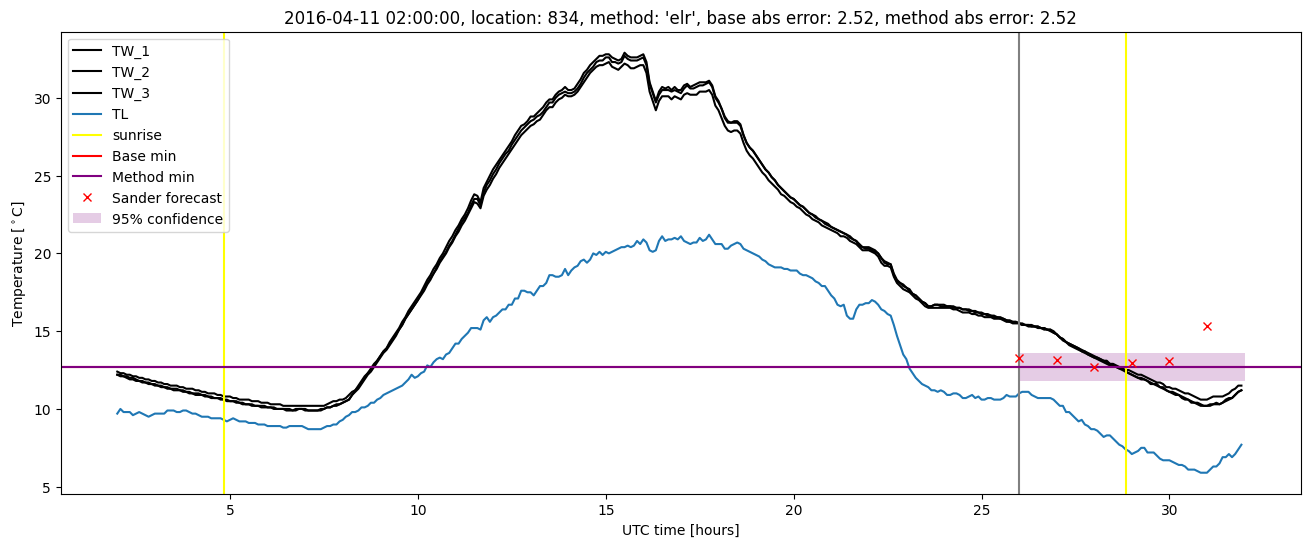
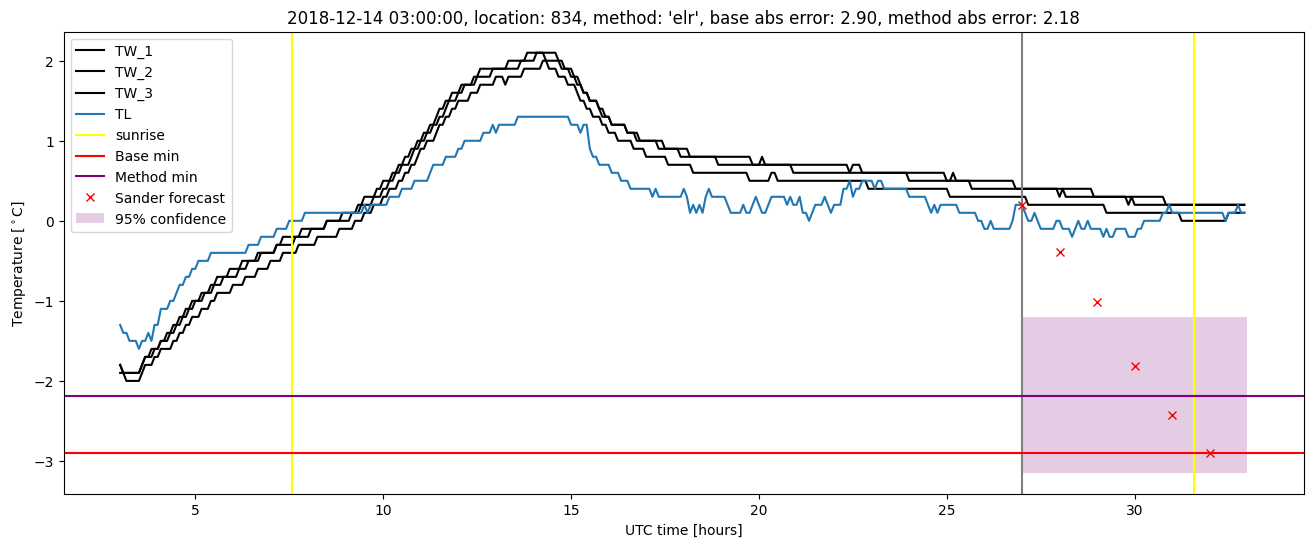
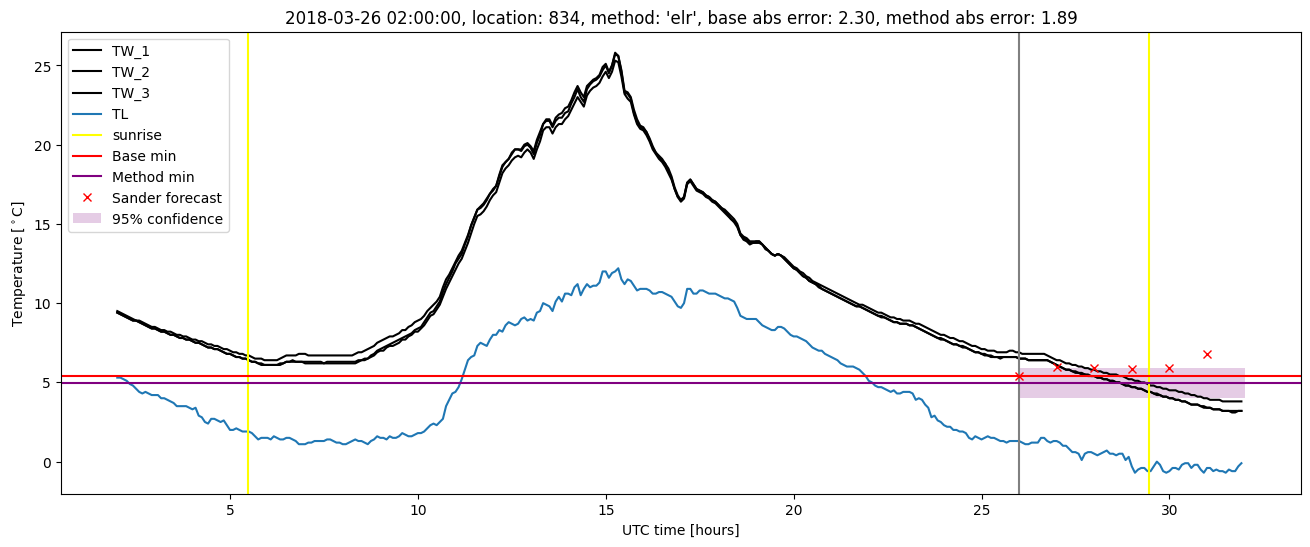
Extended logistic regression results
| names |
period |
power |
significance |
meanSquareError |
absError |
maxError |
CRPS |
IGN |
| baseline |
winter 2016 |
1.000 |
0.000e+00 |
0.386 |
0.433 |
2.519 |
NaN |
NaN |
| elr |
winter 2016 |
1.000 |
0.000e+00 |
0.373 |
0.451 |
2.523 |
0.560 |
4.155 |
| baseline |
winter 2017 |
0.991 |
0.026 |
0.390 |
0.425 |
2.309 |
NaN |
NaN |
| elr |
winter 2017 |
0.983 |
0.053 |
0.322 |
0.422 |
1.810 |
0.557 |
3.948 |
| baseline |
winter 2018 |
0.971 |
0.083 |
0.367 |
0.415 |
2.304 |
NaN |
NaN |
| elr |
winter 2018 |
0.979 |
0.083 |
0.346 |
0.431 |
1.887 |
0.540 |
3.440 |
| baseline |
winter 2019 |
0.985 |
0.000e+00 |
0.327 |
0.393 |
2.898 |
NaN |
NaN |
| elr |
winter 2019 |
0.992 |
0.045 |
0.291 |
0.400 |
2.183 |
0.492 |
2.626 |
| baseline |
all |
0.987 |
0.031 |
0.368 |
0.417 |
2.898 |
NaN |
NaN |
| elr |
all |
0.989 |
0.051 |
0.335 |
0.427 |
2.523 |
0.538 |
3.564 |
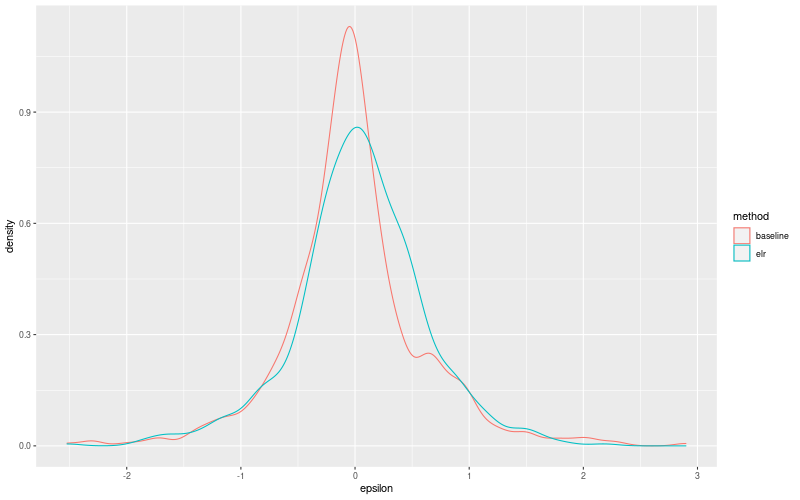
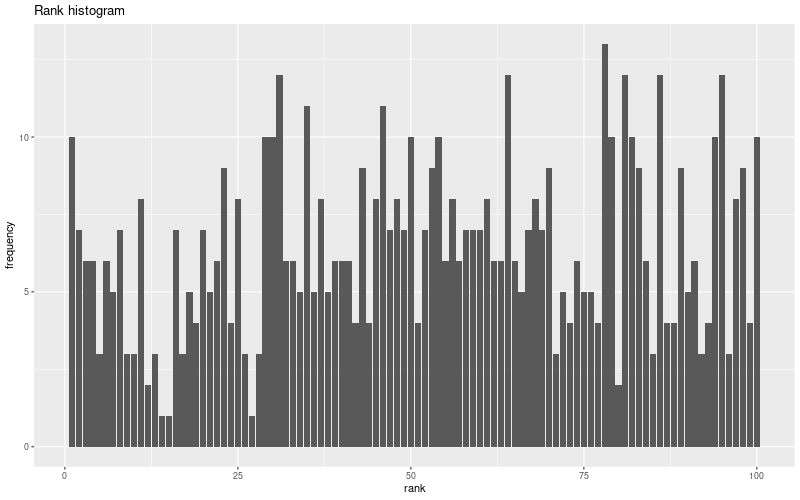
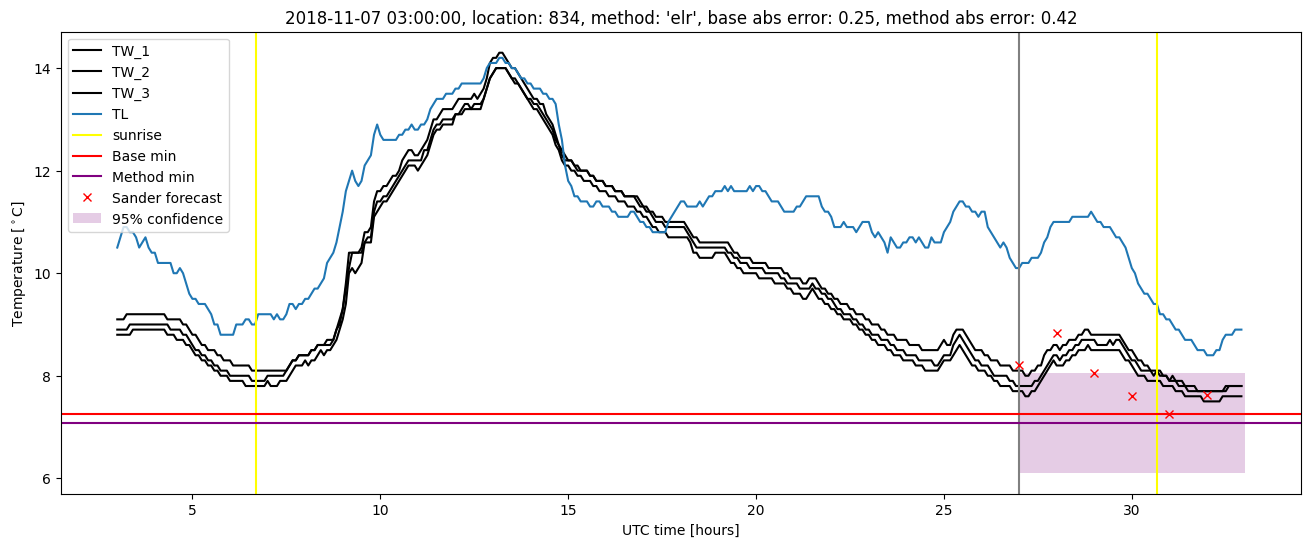
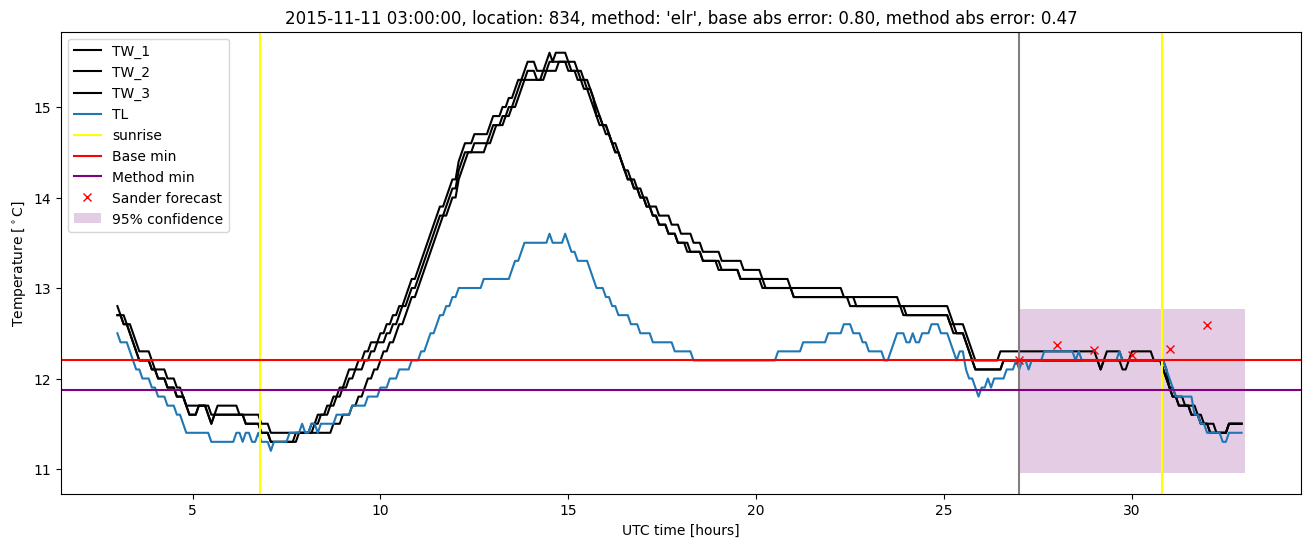
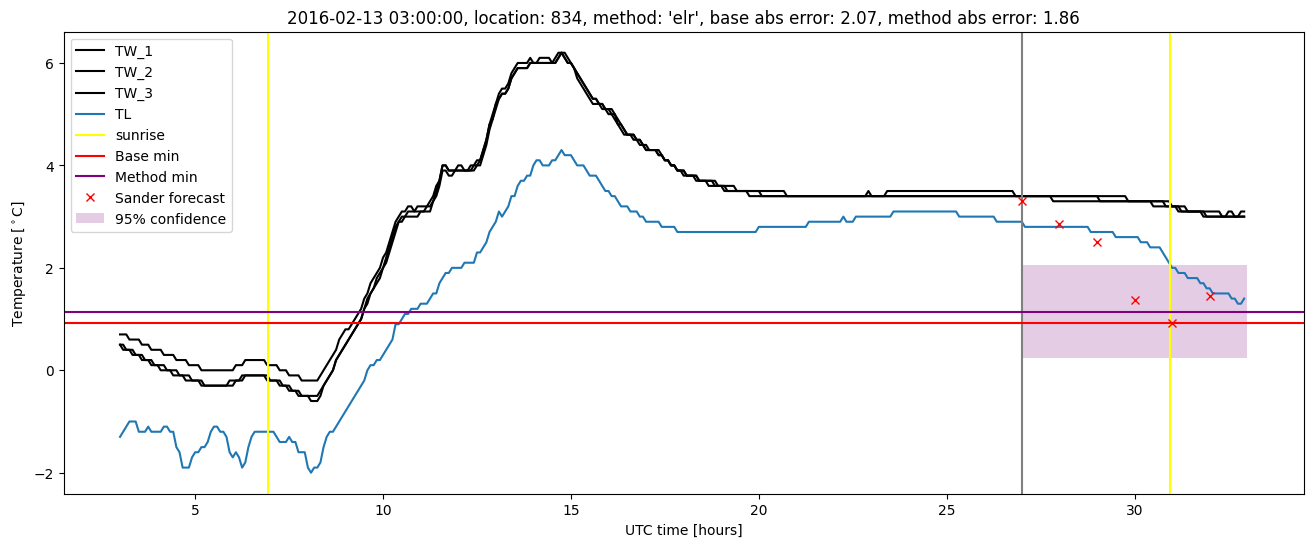
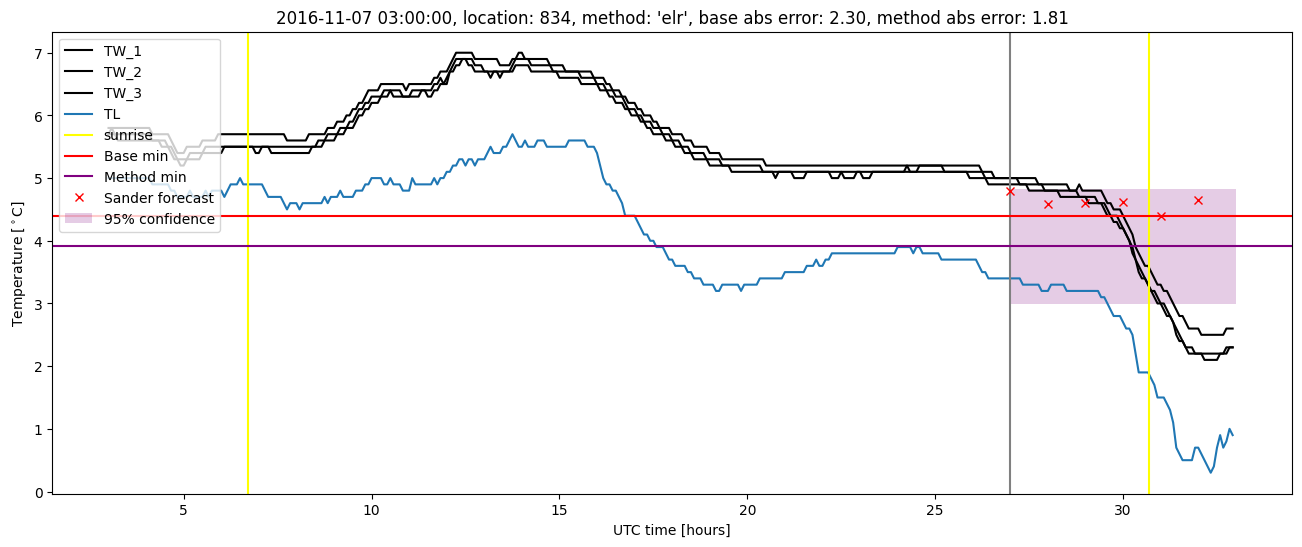
Extended logistic regression plots