GMS location: 833
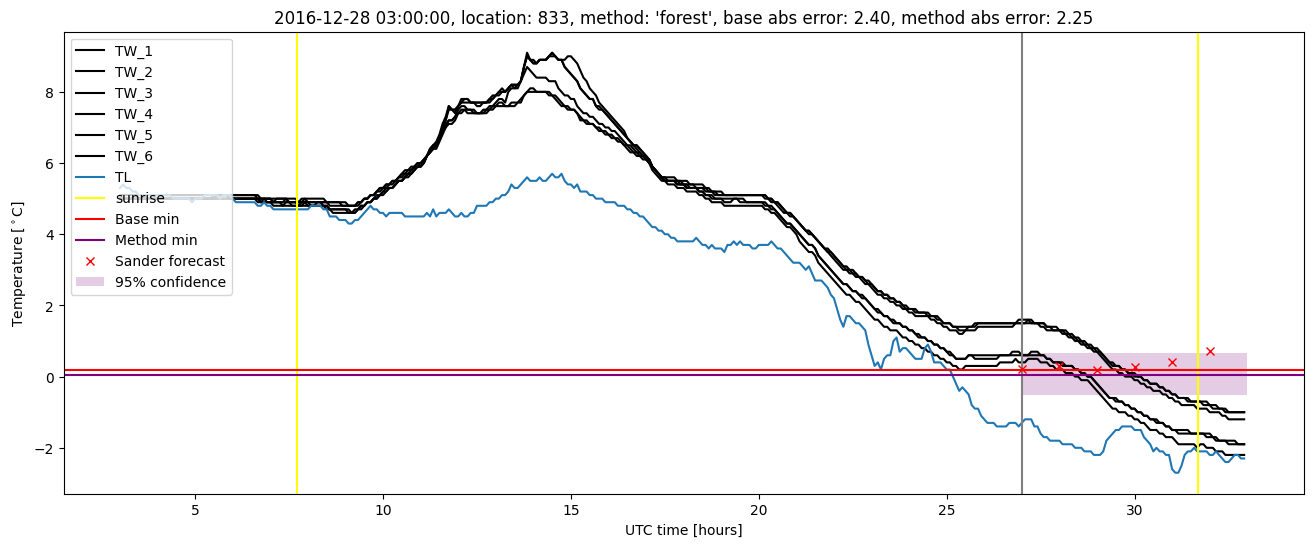
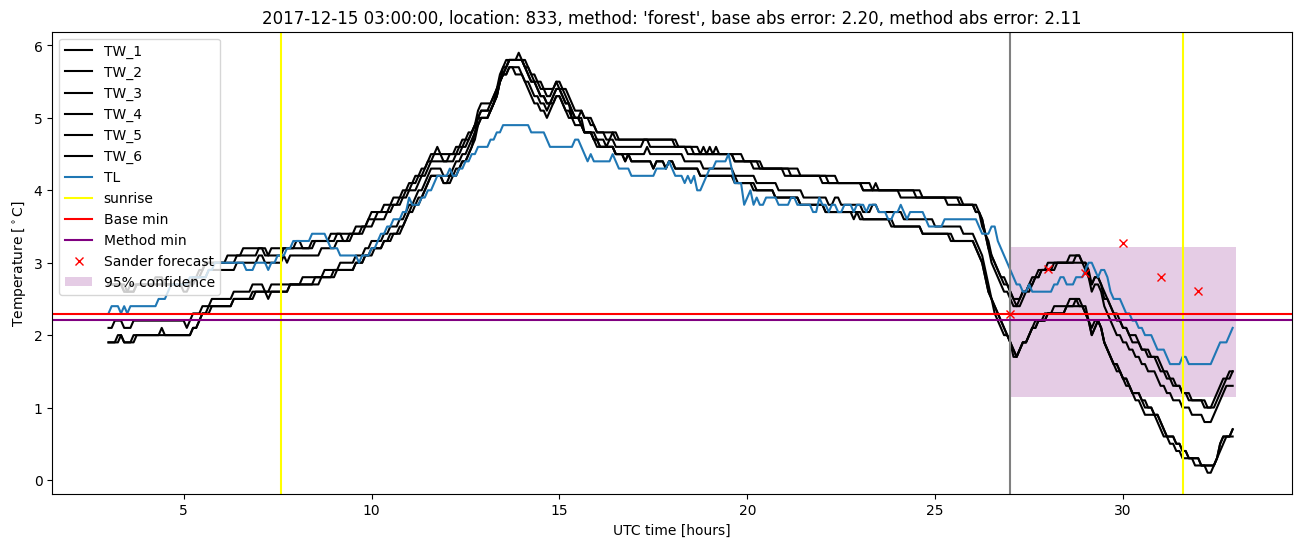
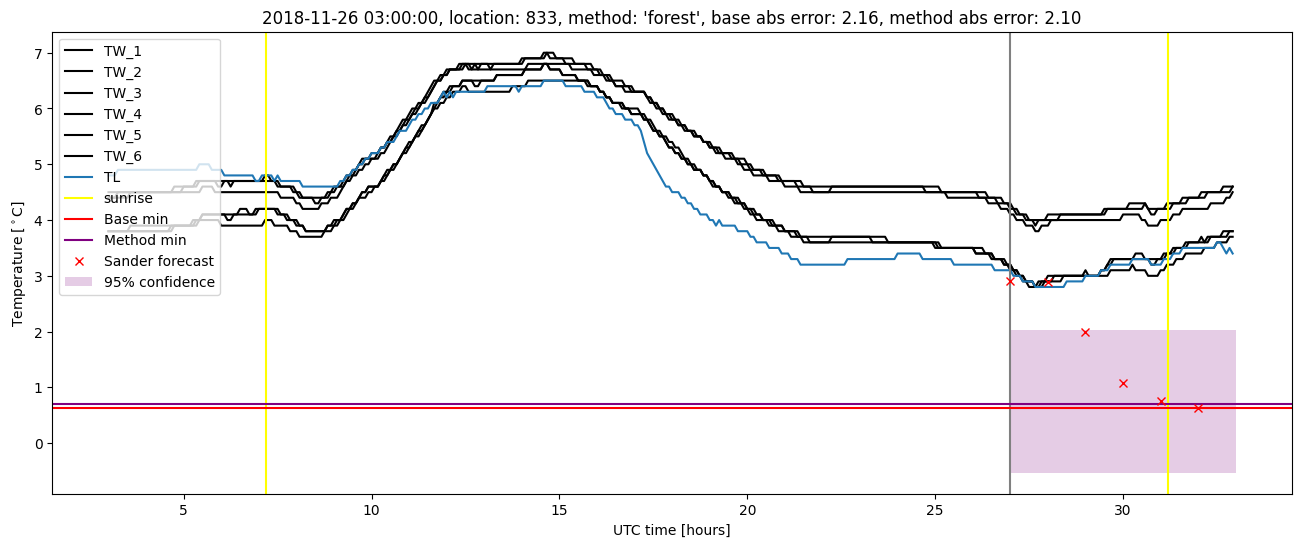
Random forest results
| names |
period |
power |
significance |
meanSquareError |
absError |
maxError |
CRPS |
IGN |
| baseline |
winter 2016 |
0.966 |
0.037 |
0.333 |
0.398 |
2.699 |
NaN |
NaN |
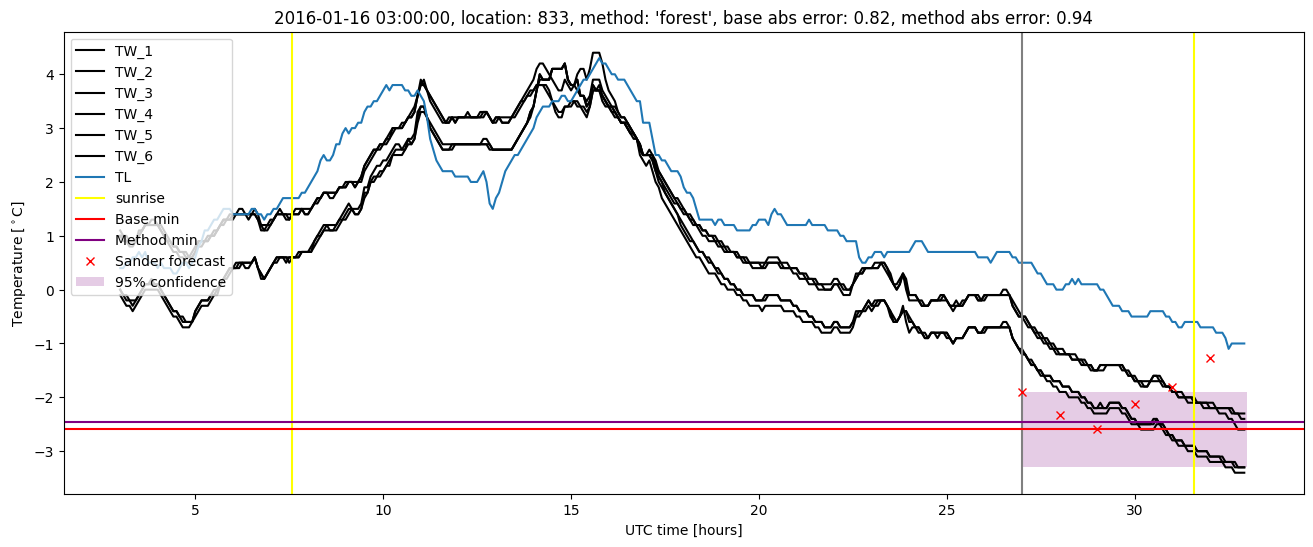
| forest |
winter 2016 |
0.961 |
0.000e+00 |
0.331 |
0.401 |
2.649 |
0.546 |
4.336 |
| baseline |
winter 2017 |
0.972 |
0.067 |
0.408 |
0.425 |
2.577 |
NaN |
NaN |
| forest |
winter 2017 |
0.972 |
0.044 |
0.336 |
0.393 |
2.529 |
0.503 |
4.107 |
| baseline |
winter 2018 |
0.980 |
0.065 |
0.317 |
0.401 |
2.199 |
NaN |
NaN |
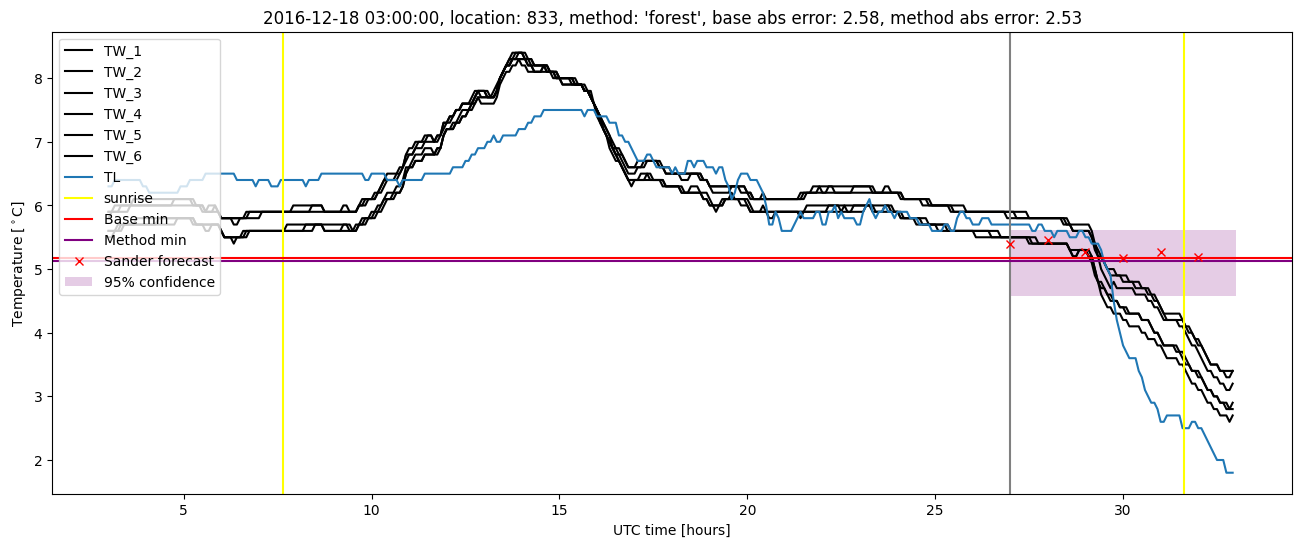
| forest |
winter 2018 |
0.980 |
0.065 |
0.299 |
0.391 |
2.110 |
0.515 |
3.478 |
| baseline |
winter 2019 |
1.000 |
0.045 |
0.319 |
0.394 |
2.164 |
NaN |
NaN |
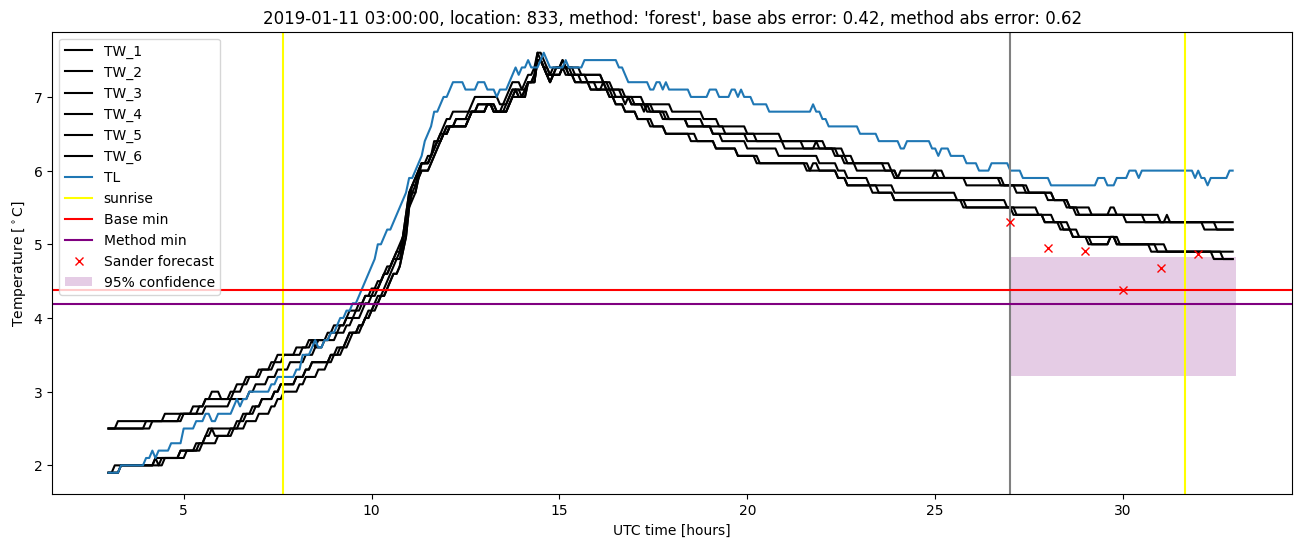
| forest |
winter 2019 |
1.000 |
0.000e+00 |
0.251 |
0.344 |
2.099 |
0.521 |
3.694 |
| baseline |
all |
0.979 |
0.056 |
0.342 |
0.404 |
2.699 |
NaN |
NaN |
| forest |
all |
0.977 |
0.032 |
0.305 |
0.384 |
2.649 |
0.523 |
3.919 |
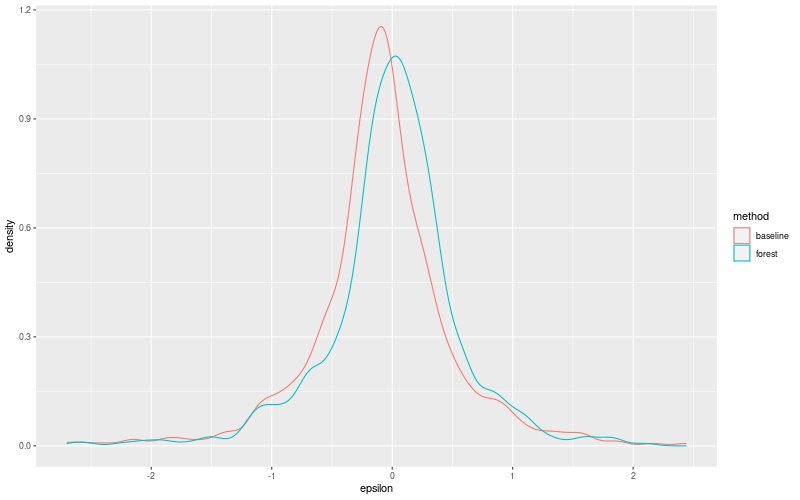
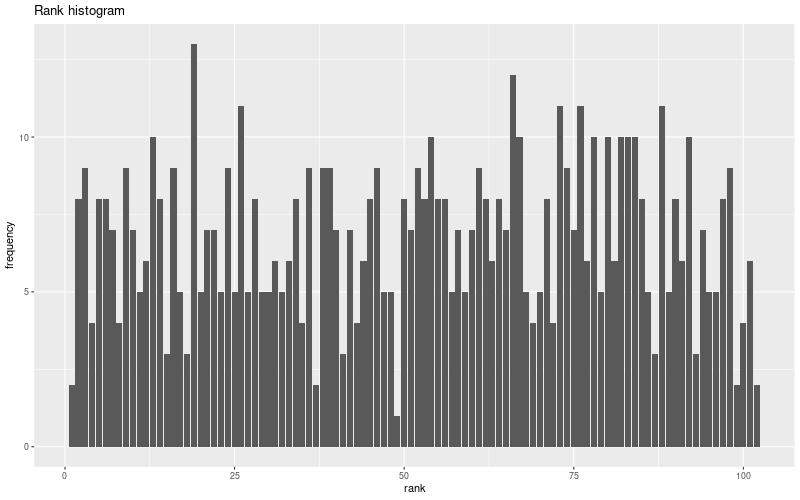
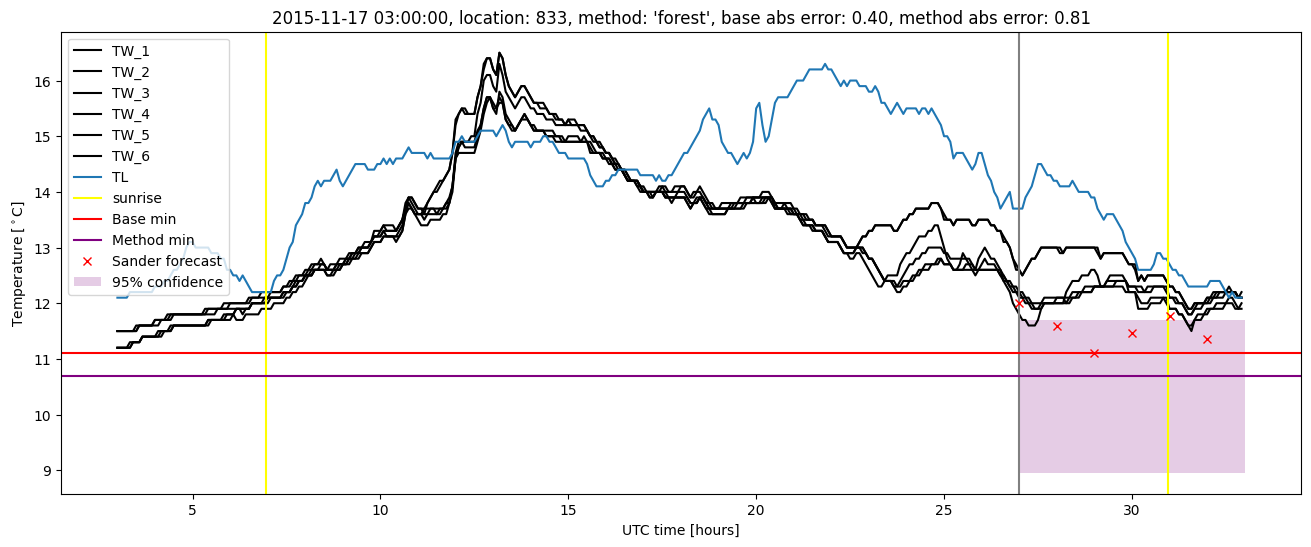
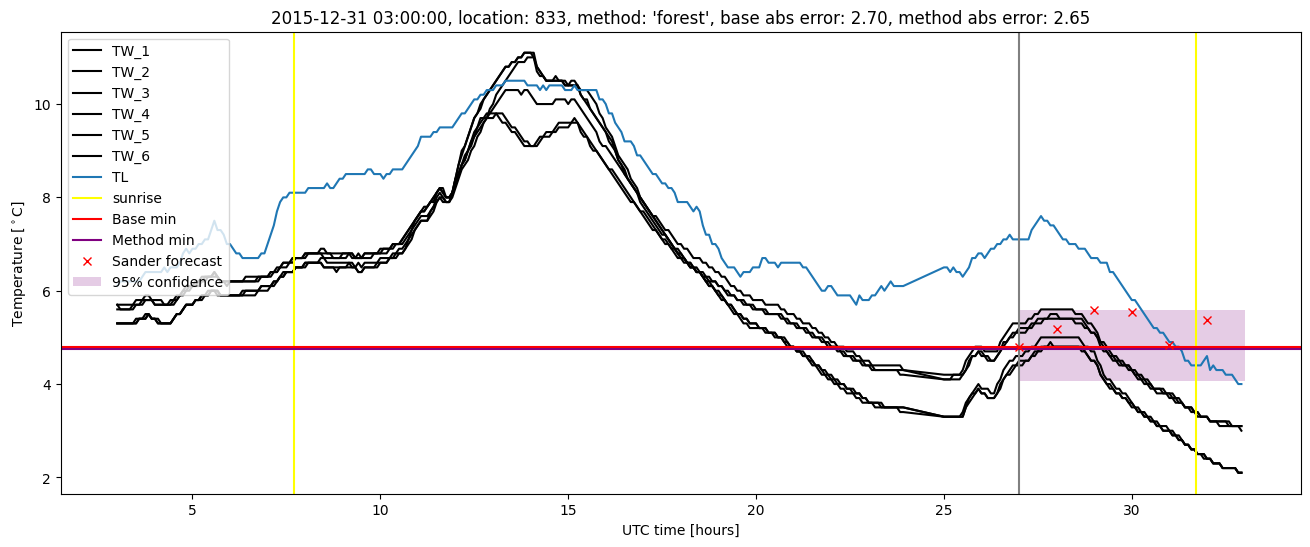
Random forest plots
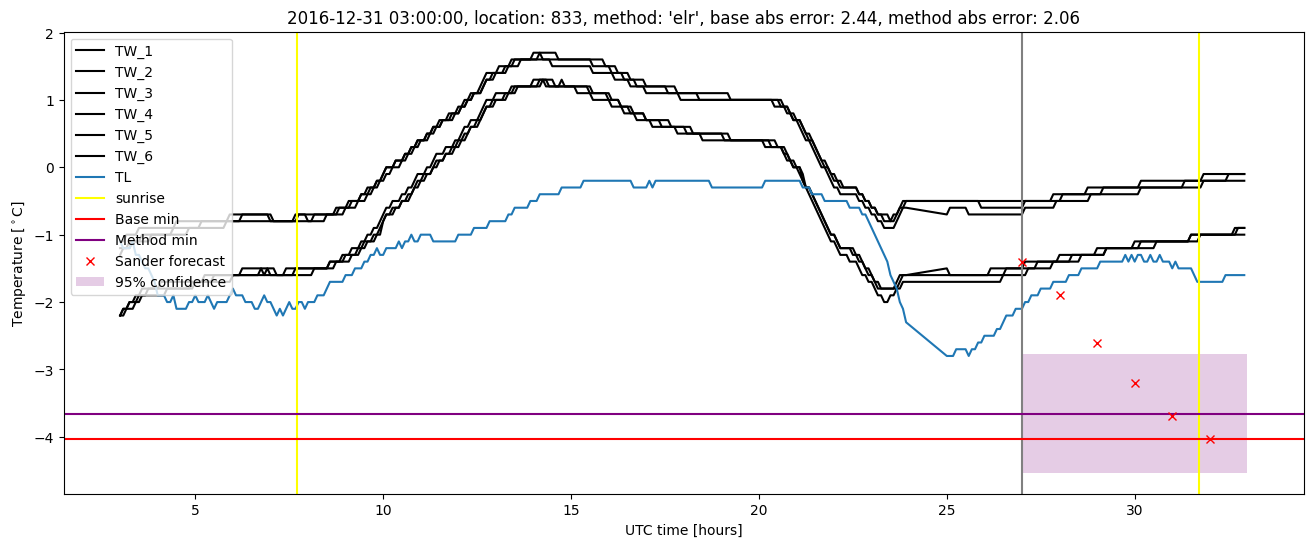
Extended logistic regression results
| names |
period |
power |
significance |
meanSquareError |
absError |
maxError |
CRPS |
IGN |
| baseline |
winter 2016 |
0.966 |
0.037 |
0.333 |
0.398 |
2.699 |
NaN |
NaN |
| elr |
winter 2016 |
0.961 |
0.000e+00 |
0.363 |
0.440 |
2.382 |
0.650 |
6.342 |
| baseline |
winter 2017 |
0.972 |
0.067 |
0.408 |
0.425 |
2.577 |
NaN |
NaN |
| elr |
winter 2017 |
0.982 |
0.044 |
0.355 |
0.398 |
2.483 |
0.531 |
4.234 |
| baseline |
winter 2018 |
0.980 |
0.065 |
0.317 |
0.401 |
2.199 |
NaN |
NaN |
| elr |
winter 2018 |
0.973 |
0.129 |
0.301 |
0.386 |
2.367 |
0.587 |
4.378 |
| baseline |
winter 2019 |
1.000 |
0.045 |
0.319 |
0.394 |
2.164 |
NaN |
NaN |
| elr |
winter 2019 |
1.000 |
0.000e+00 |
0.246 |
0.352 |
1.799 |
0.561 |
3.778 |
| baseline |
all |
0.979 |
0.056 |
0.342 |
0.404 |
2.699 |
NaN |
NaN |
| elr |
all |
0.977 |
0.048 |
0.319 |
0.397 |
2.483 |
0.588 |
4.788 |
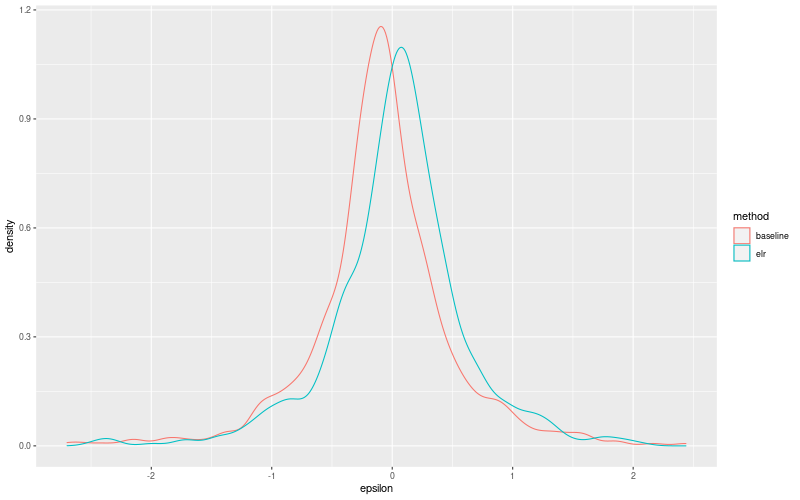
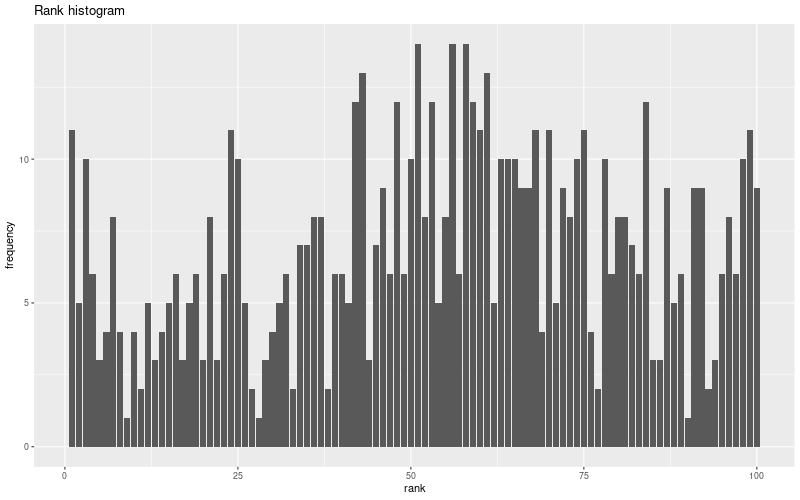
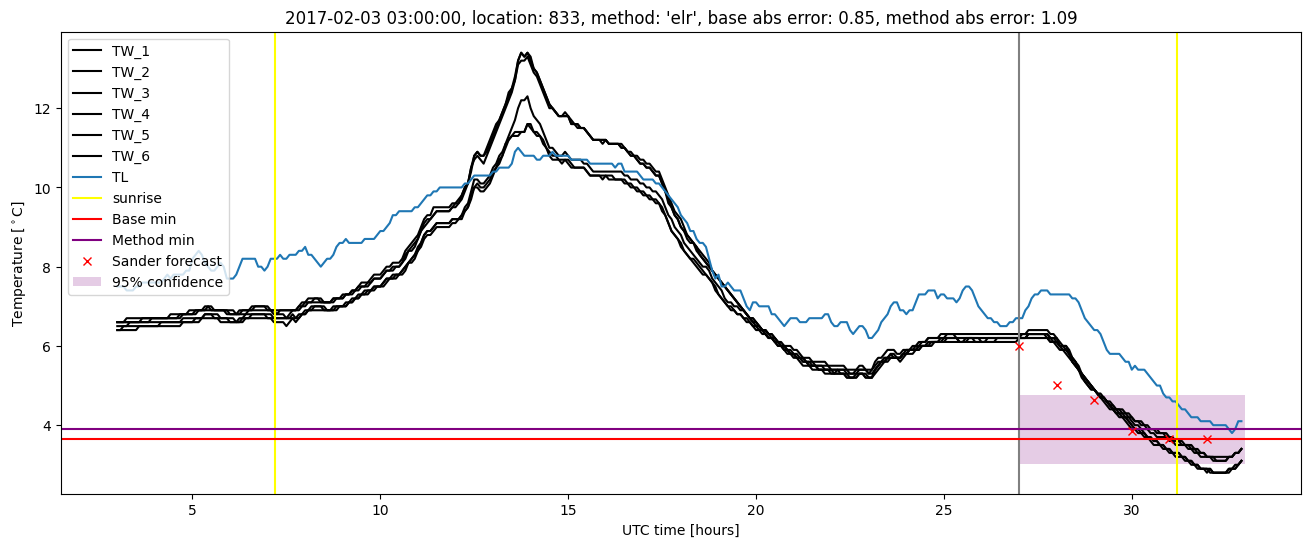
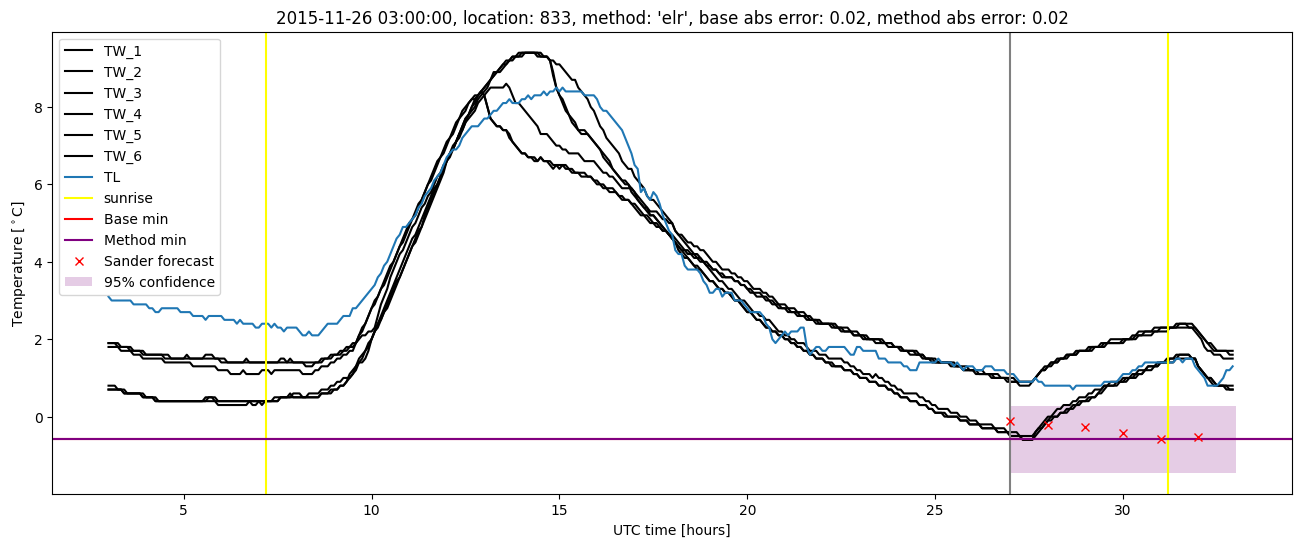
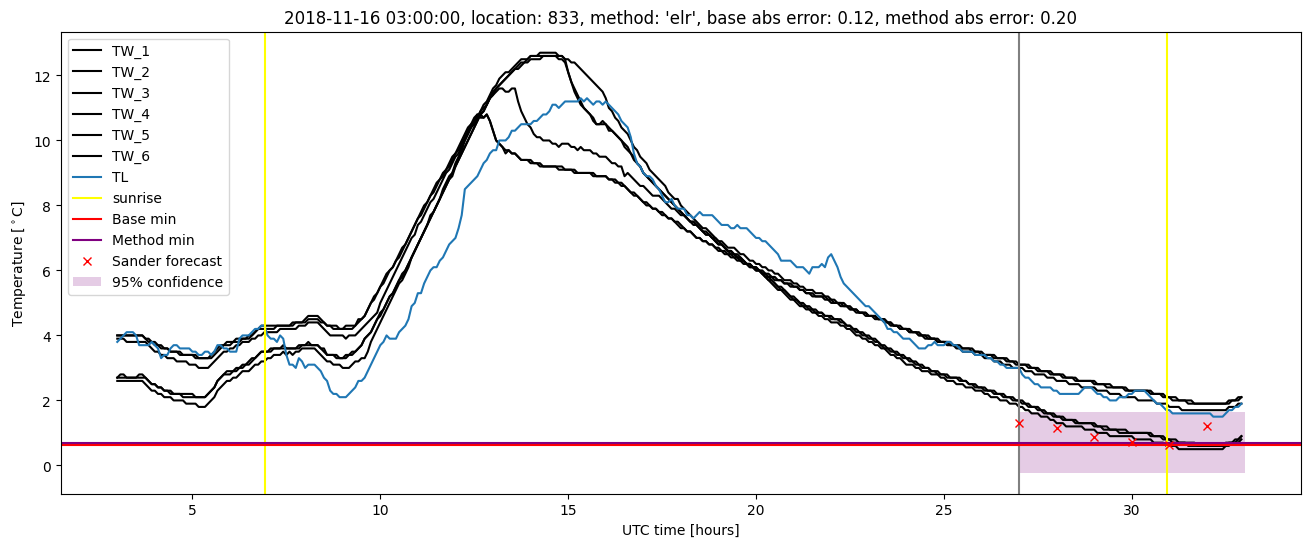
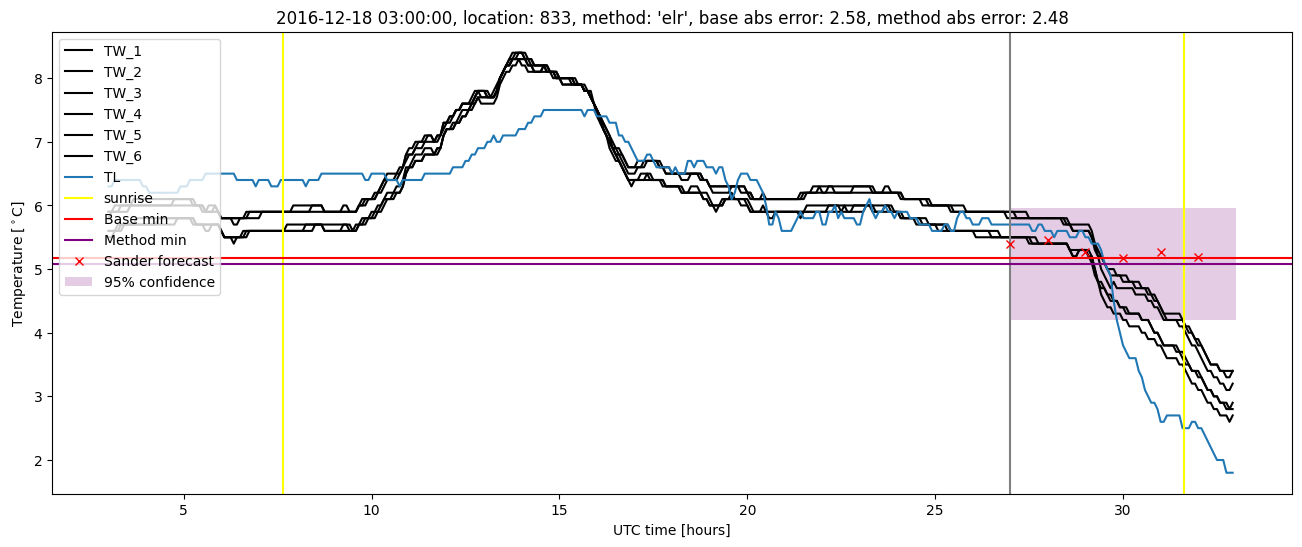
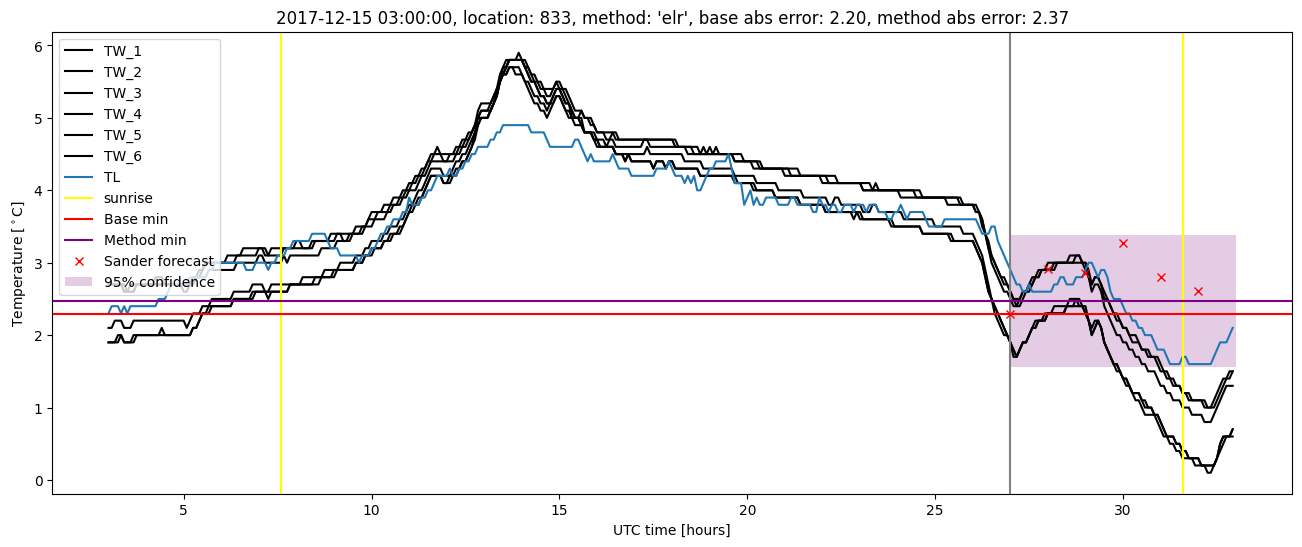
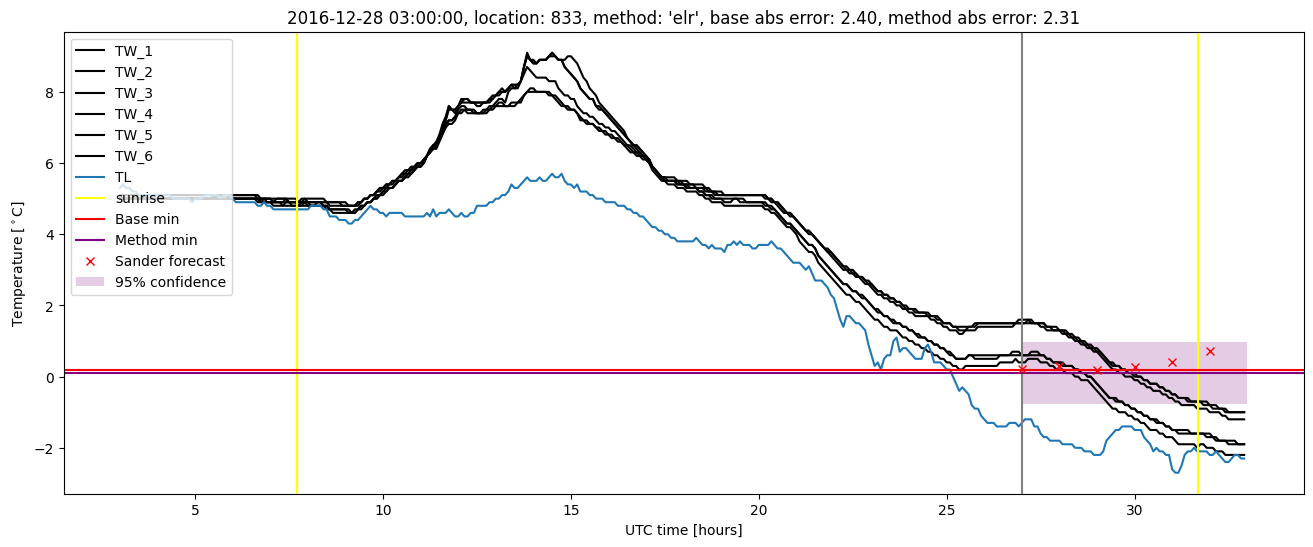
Extended logistic regression plots