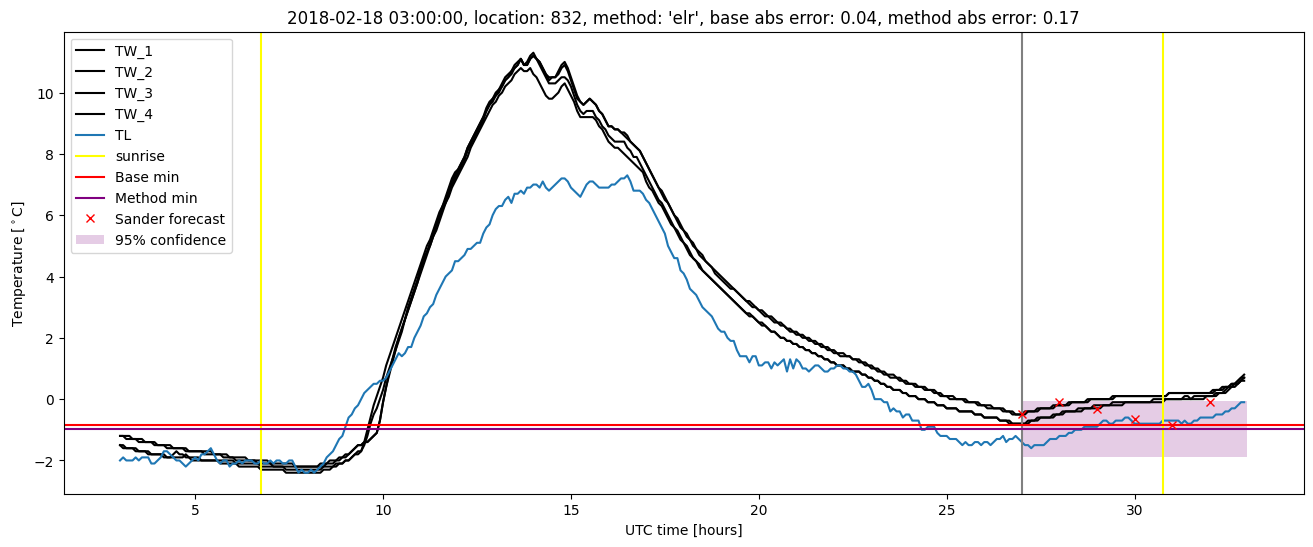
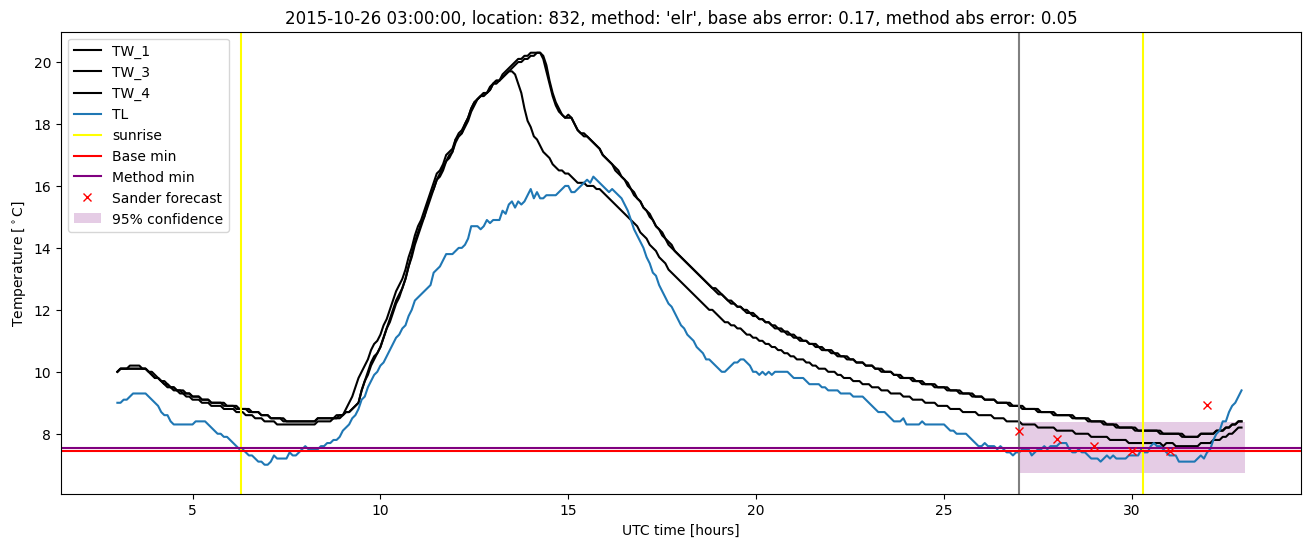
GMS location: 832
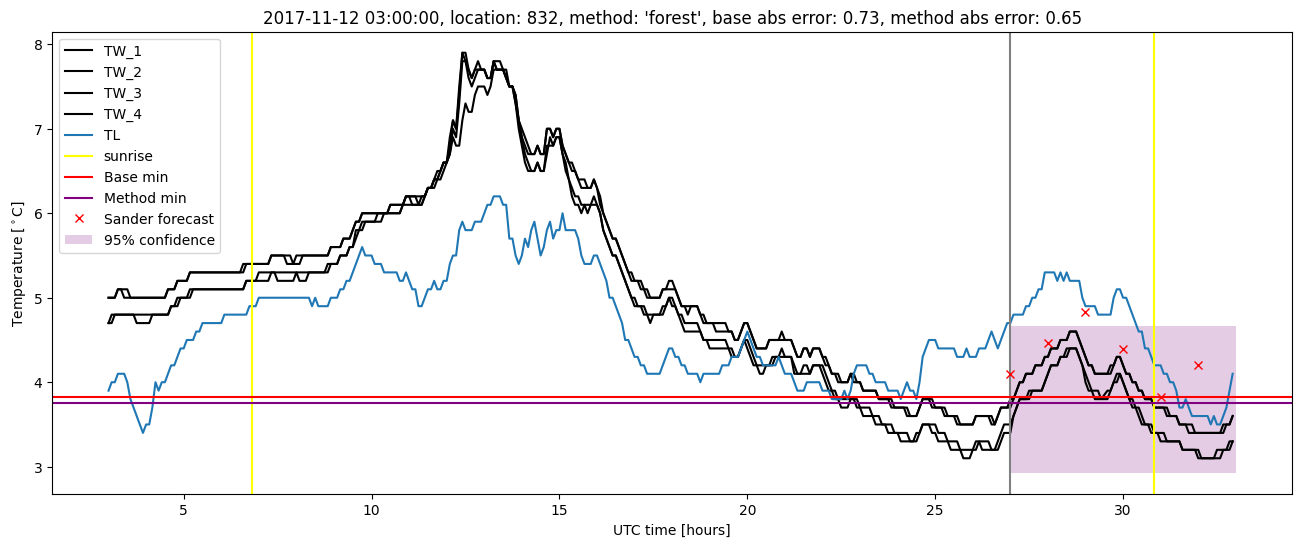
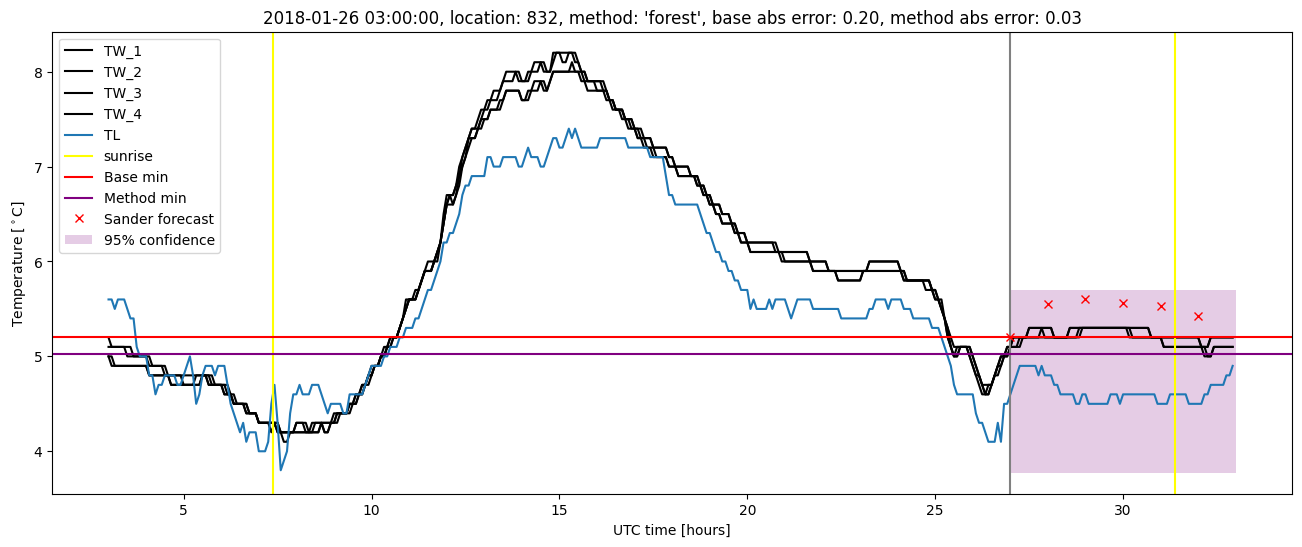
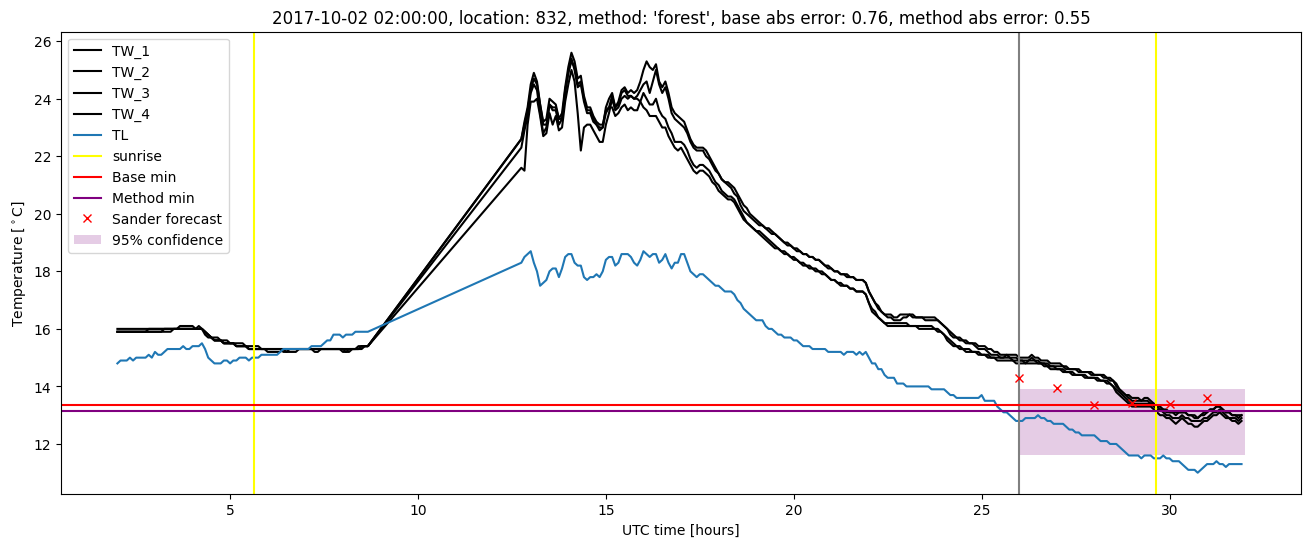
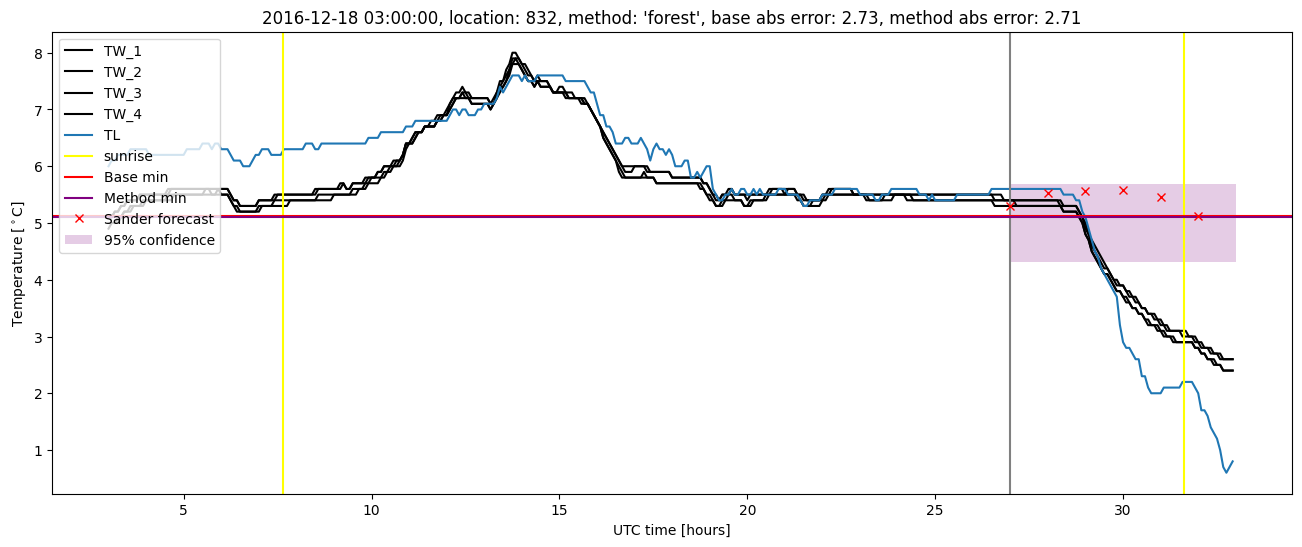
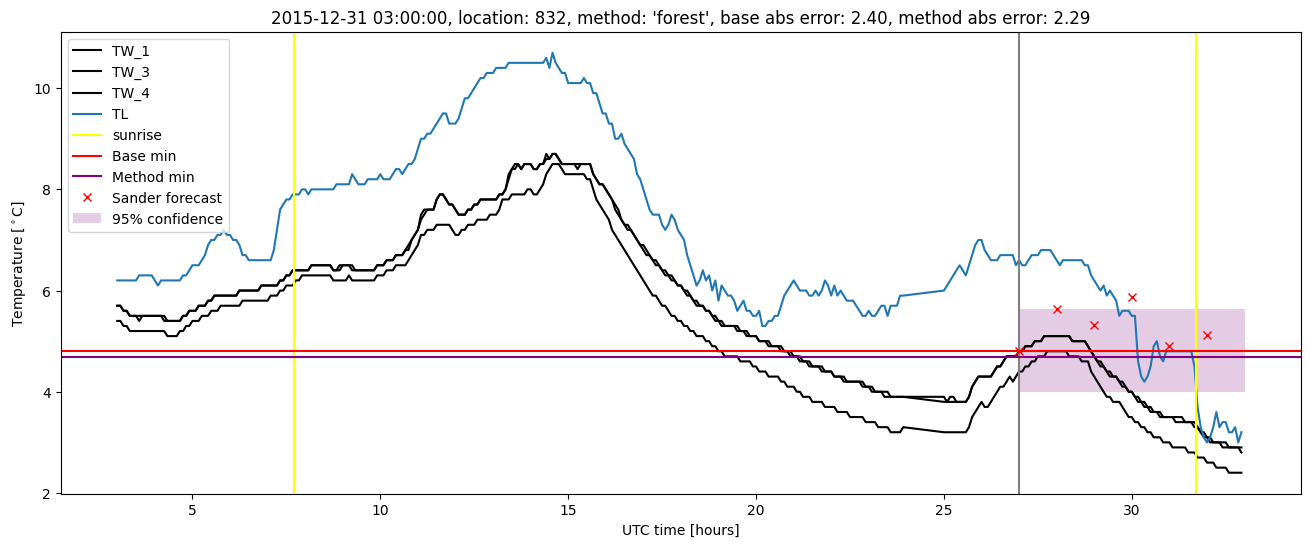
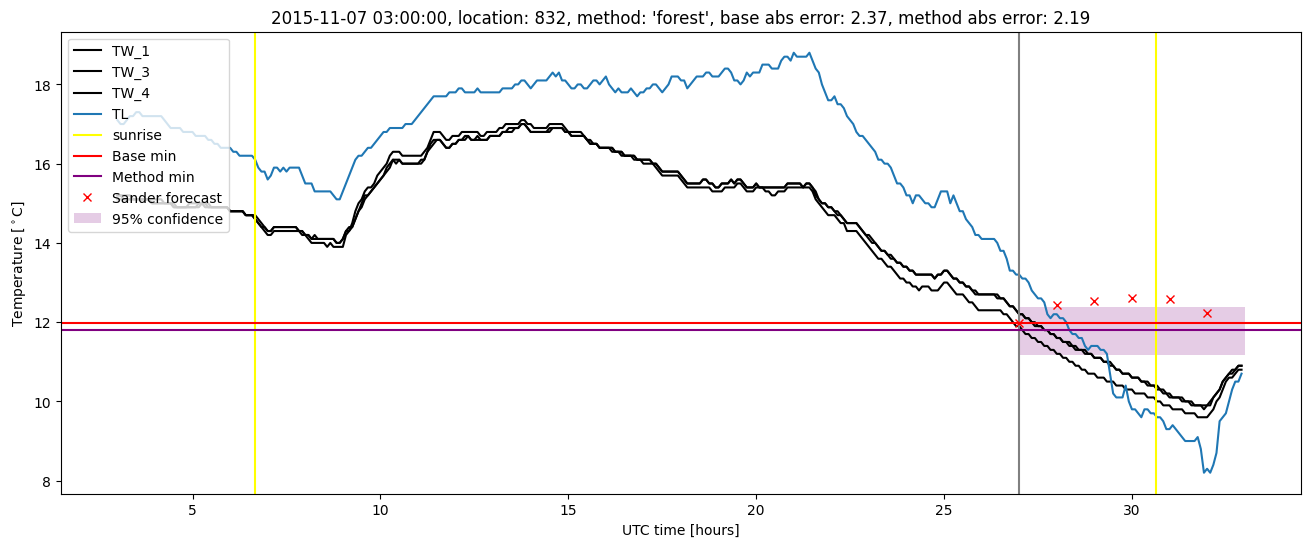
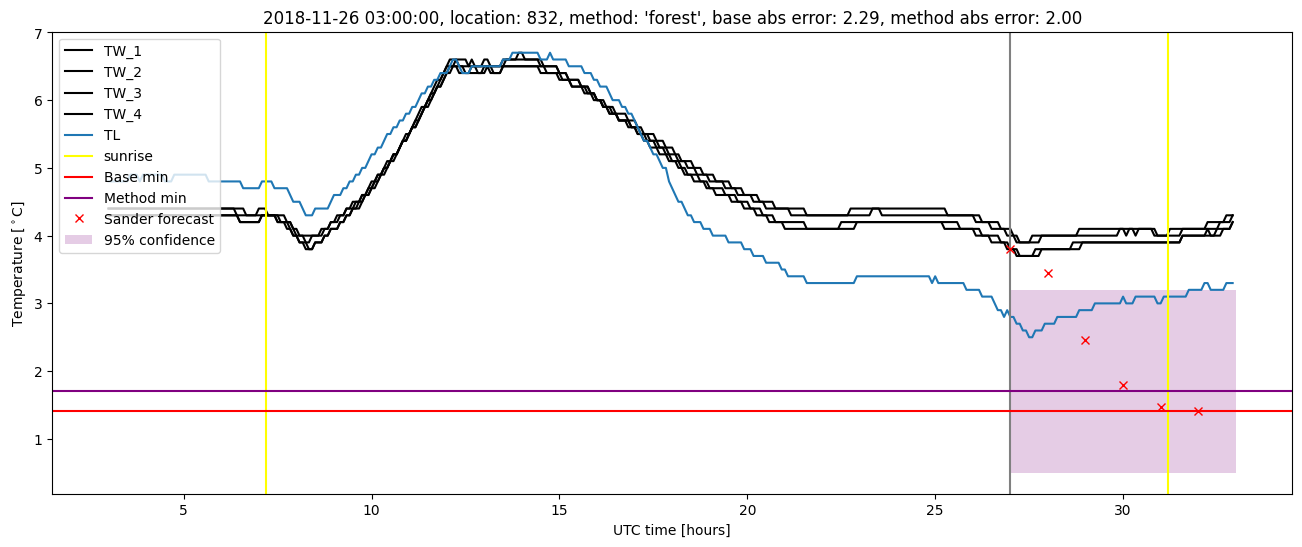
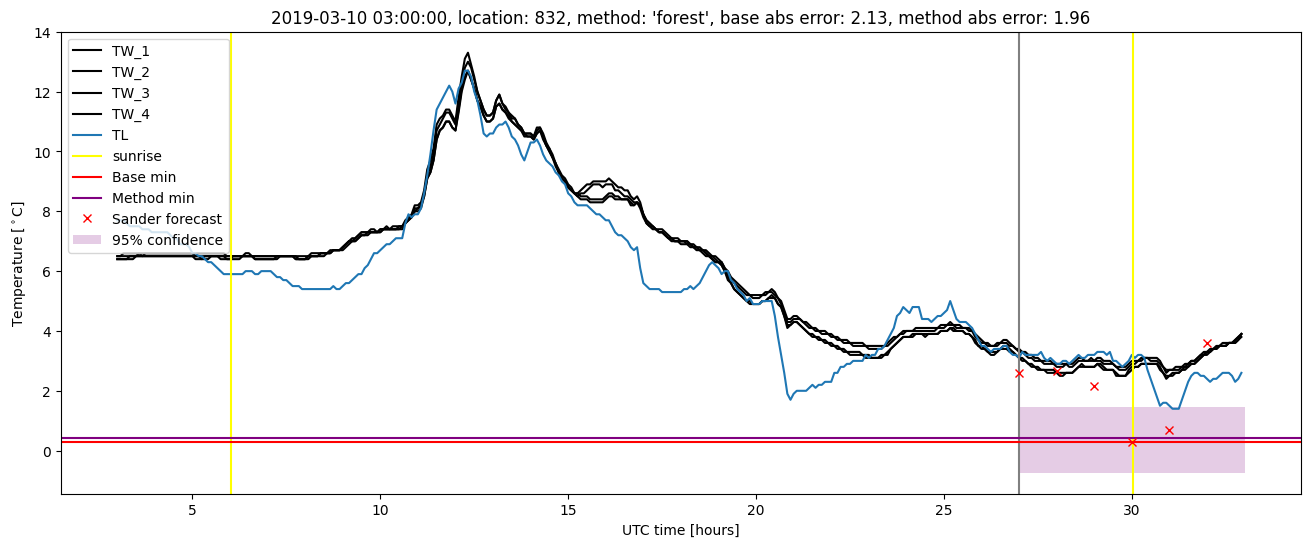
Random forest results
| names |
period |
power |
significance |
meanSquareError |
absError |
maxError |
CRPS |
IGN |
| baseline |
winter 2016 |
0.982 |
0.167 |
0.355 |
0.391 |
2.399 |
NaN |
NaN |
| forest |
winter 2016 |
0.988 |
0.111 |
0.318 |
0.380 |
2.285 |
0.488 |
4.122 |
| baseline |
winter 2017 |
0.991 |
0.077 |
0.356 |
0.425 |
2.731 |
NaN |
NaN |
| forest |
winter 2017 |
1.000 |
0.154 |
0.296 |
0.385 |
2.708 |
0.450 |
3.366 |
| baseline |
winter 2018 |
0.976 |
0.143 |
0.300 |
0.418 |
1.970 |
NaN |
NaN |
| forest |
winter 2018 |
0.992 |
0.143 |
0.257 |
0.376 |
1.782 |
0.463 |
2.587 |
| baseline |
winter 2019 |
0.986 |
0.000e+00 |
0.287 |
0.363 |
2.348 |
NaN |
NaN |
| forest |
winter 2019 |
0.993 |
0.125 |
0.205 |
0.312 |
1.996 |
0.454 |
2.679 |
| baseline |
all |
0.984 |
0.099 |
0.326 |
0.399 |
2.731 |
NaN |
NaN |
| forest |
all |
0.993 |
0.139 |
0.271 |
0.364 |
2.708 |
0.465 |
3.235 |
Random forest plots
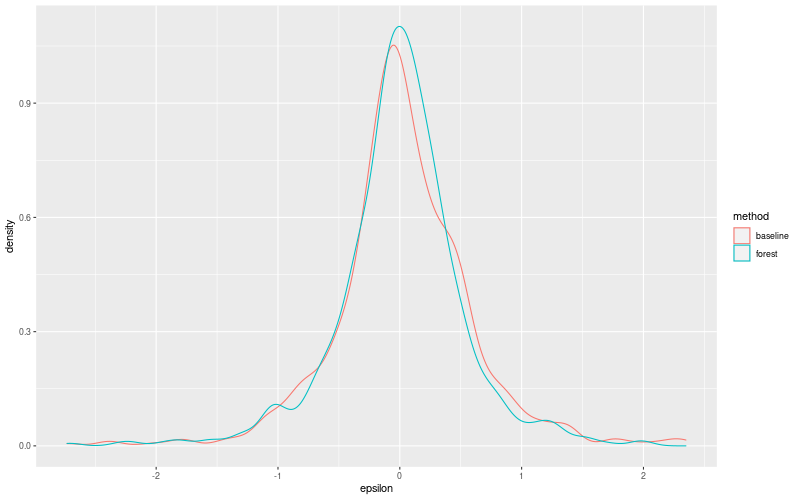
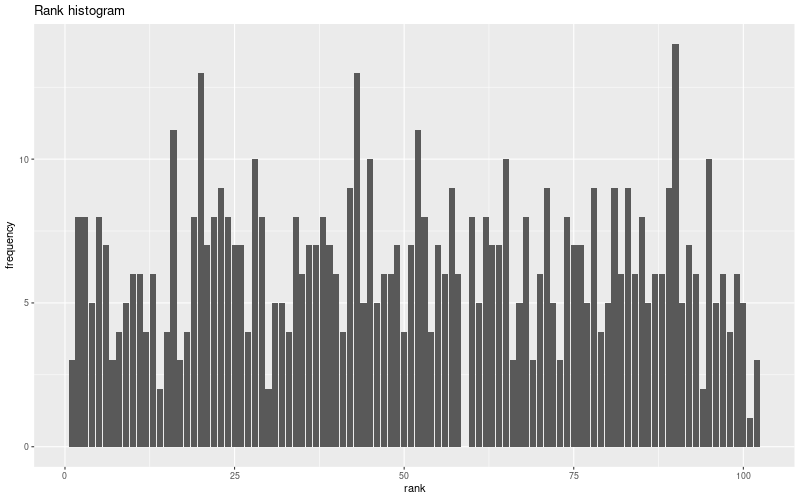
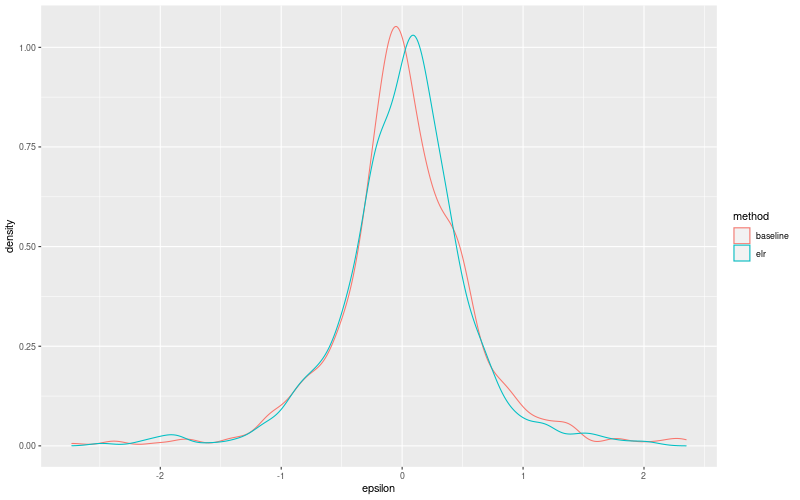
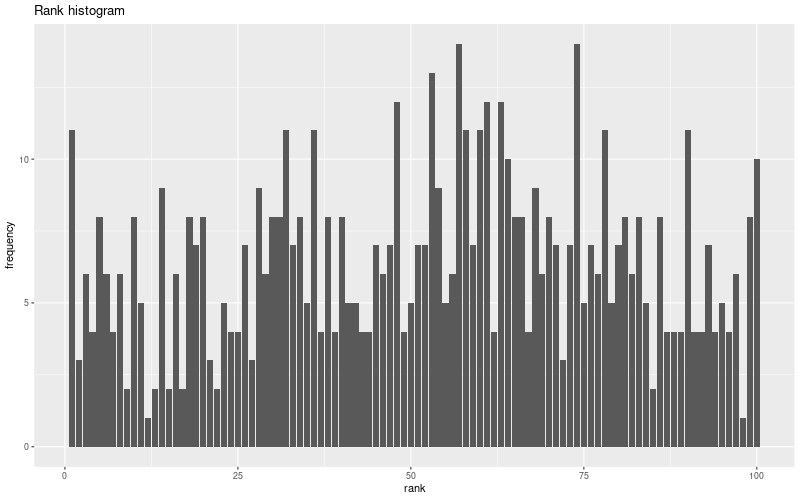
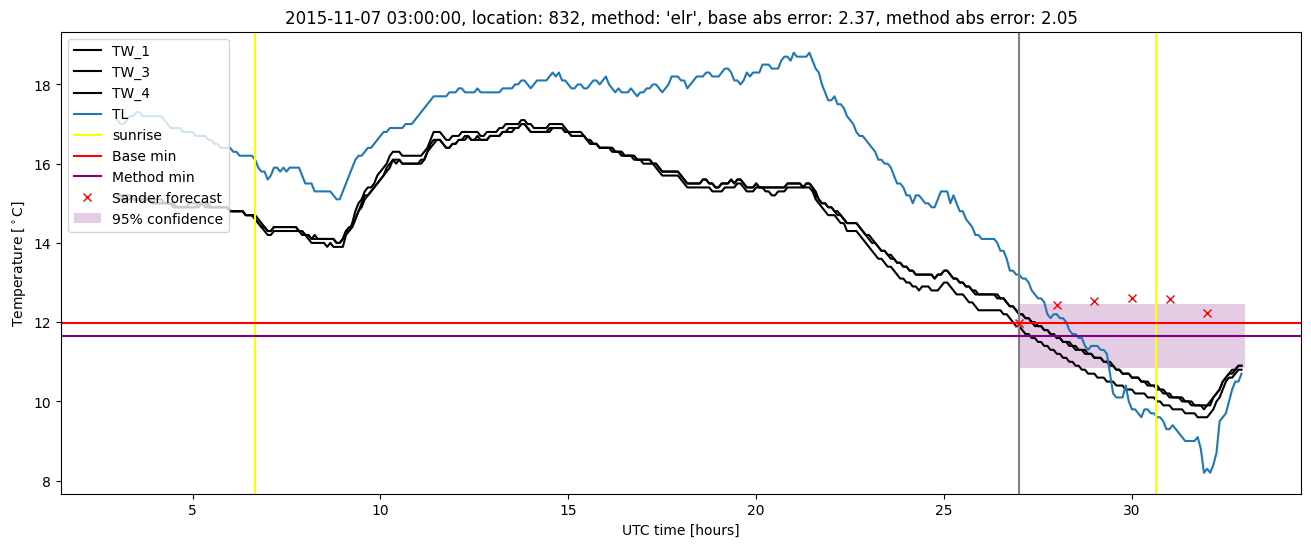
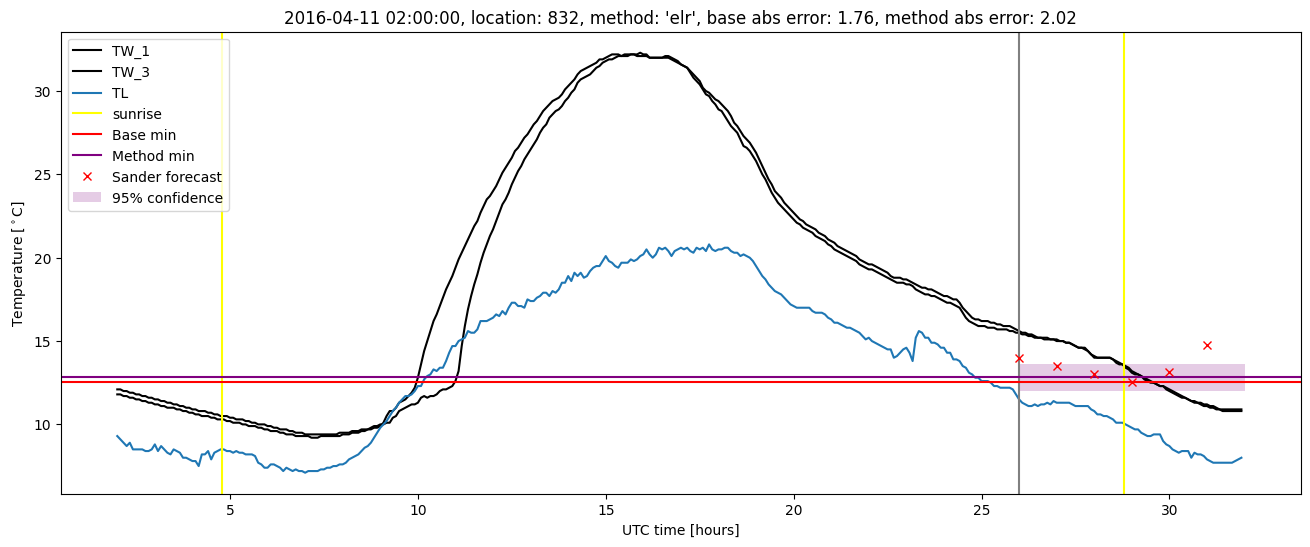
Extended logistic regression results
| names |
period |
power |
significance |
meanSquareError |
absError |
maxError |
CRPS |
IGN |
| baseline |
winter 2016 |
0.982 |
0.167 |
0.355 |
0.391 |
2.399 |
NaN |
NaN |
| elr |
winter 2016 |
0.994 |
0.111 |
0.335 |
0.407 |
2.170 |
0.541 |
5.631 |
| baseline |
winter 2017 |
0.991 |
0.077 |
0.356 |
0.425 |
2.731 |
NaN |
NaN |
| elr |
winter 2017 |
0.982 |
0.103 |
0.306 |
0.395 |
2.482 |
0.513 |
4.161 |
| baseline |
winter 2018 |
0.976 |
0.143 |
0.300 |
0.418 |
1.970 |
NaN |
NaN |
| elr |
winter 2018 |
0.992 |
0.143 |
0.267 |
0.370 |
1.910 |
0.514 |
3.632 |
| baseline |
winter 2019 |
0.986 |
0.000e+00 |
0.287 |
0.363 |
2.348 |
NaN |
NaN |
| elr |
winter 2019 |
0.993 |
0.125 |
0.229 |
0.348 |
1.944 |
0.477 |
3.205 |
| baseline |
all |
0.984 |
0.099 |
0.326 |
0.399 |
2.731 |
NaN |
NaN |
| elr |
all |
0.991 |
0.119 |
0.287 |
0.382 |
2.482 |
0.513 |
4.232 |
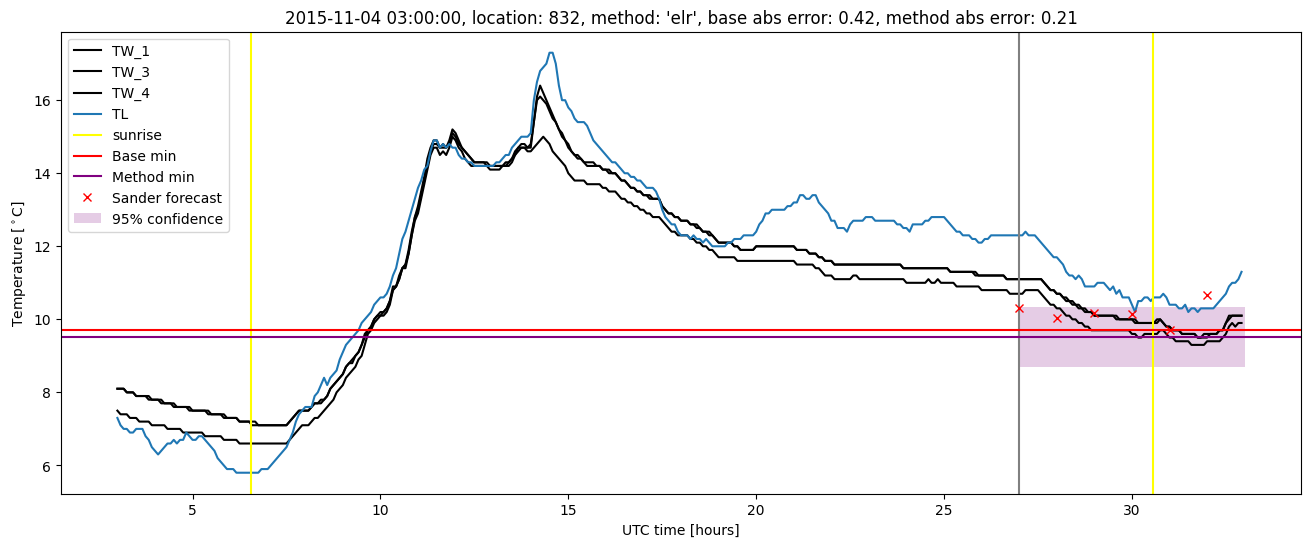
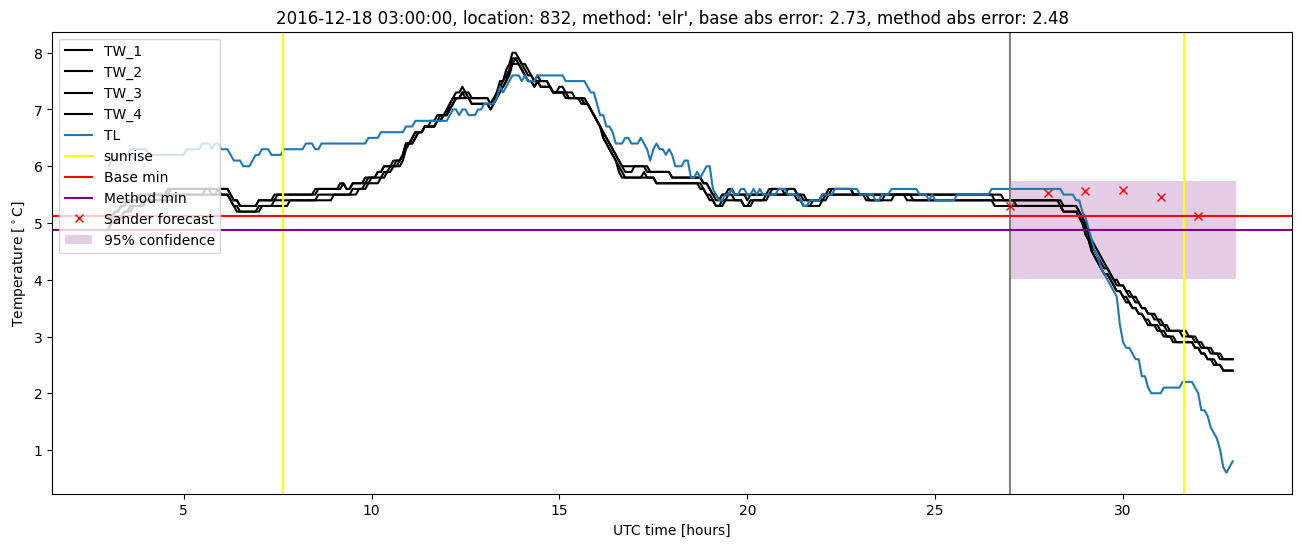
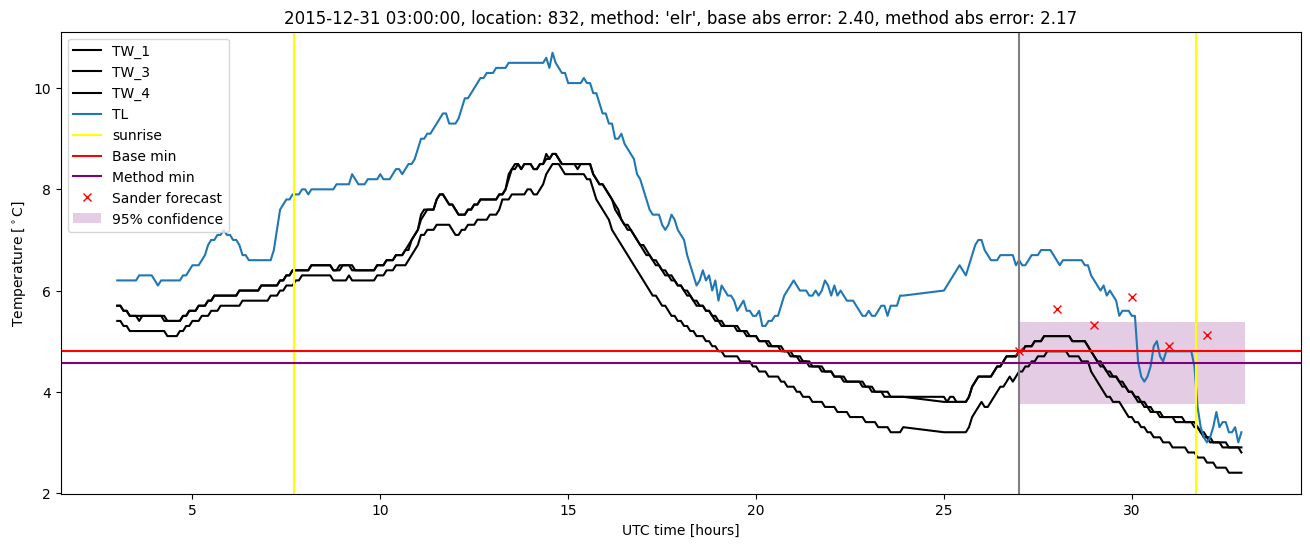
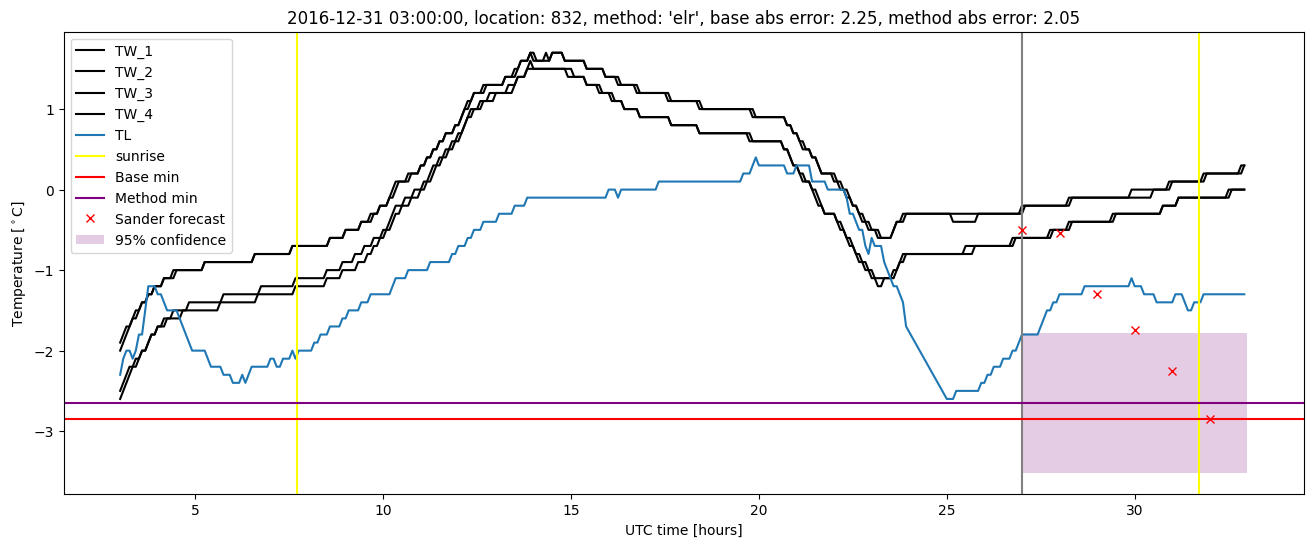
Extended logistic regression plots