GMS location: 831
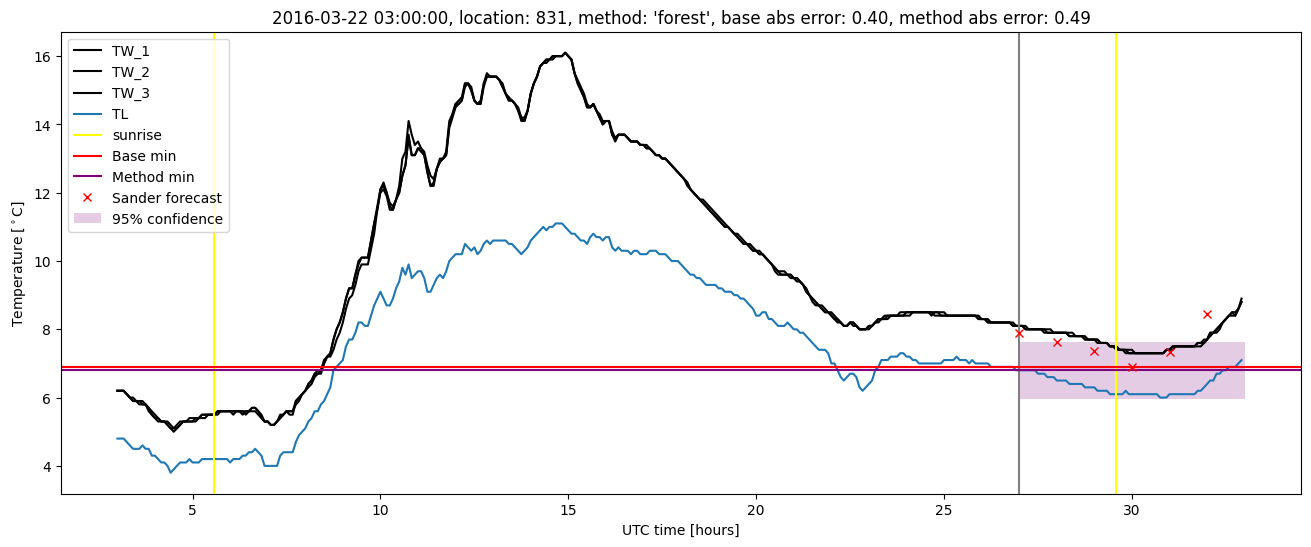
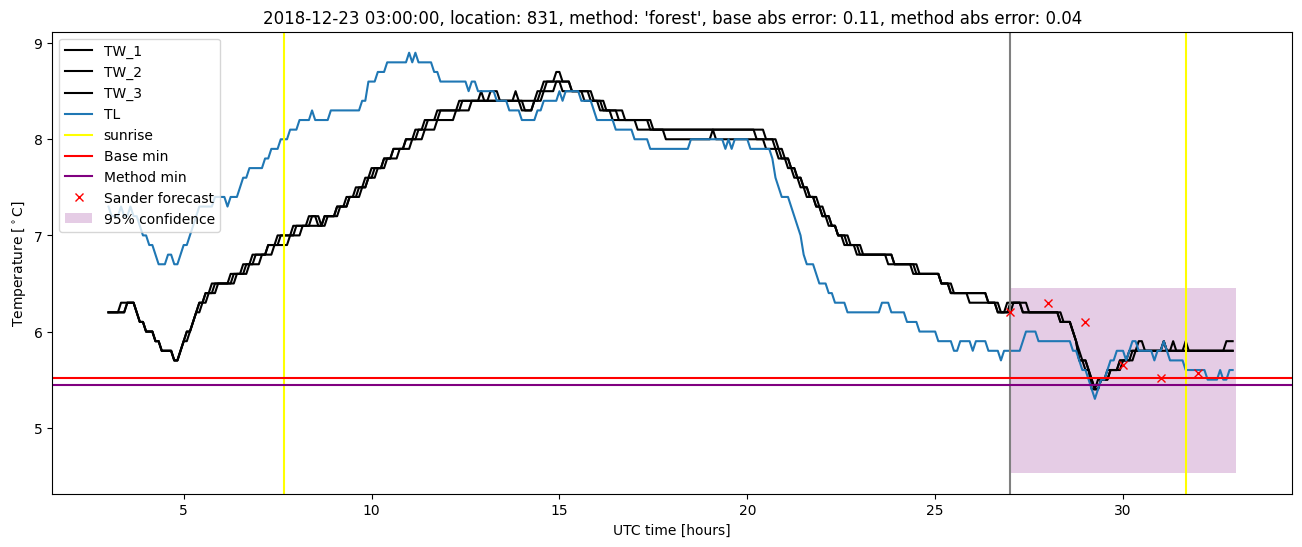
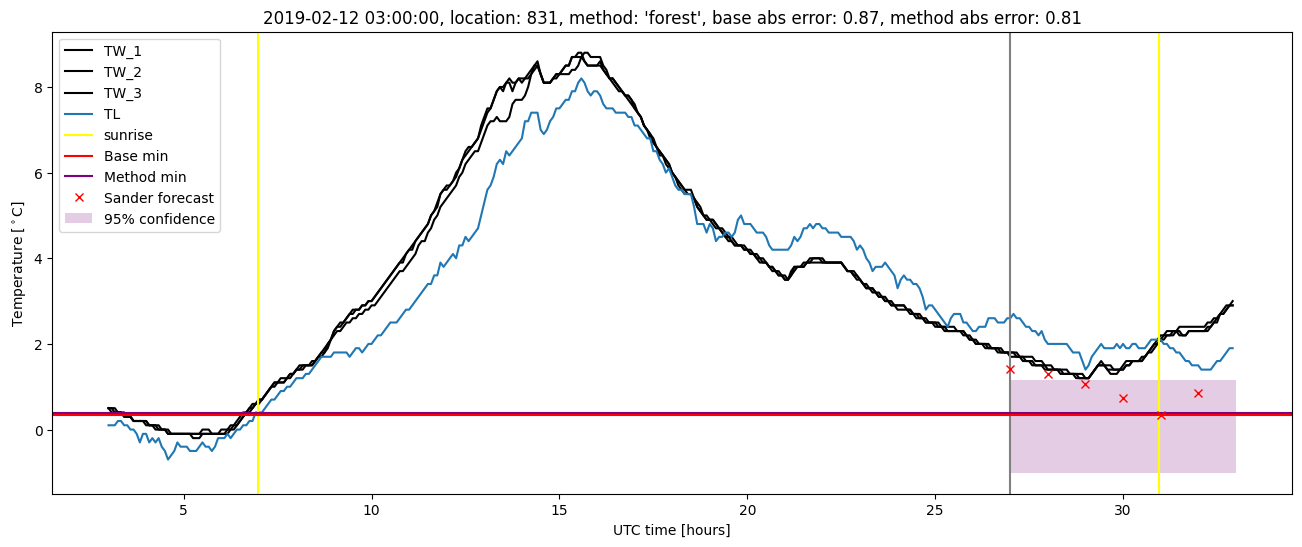
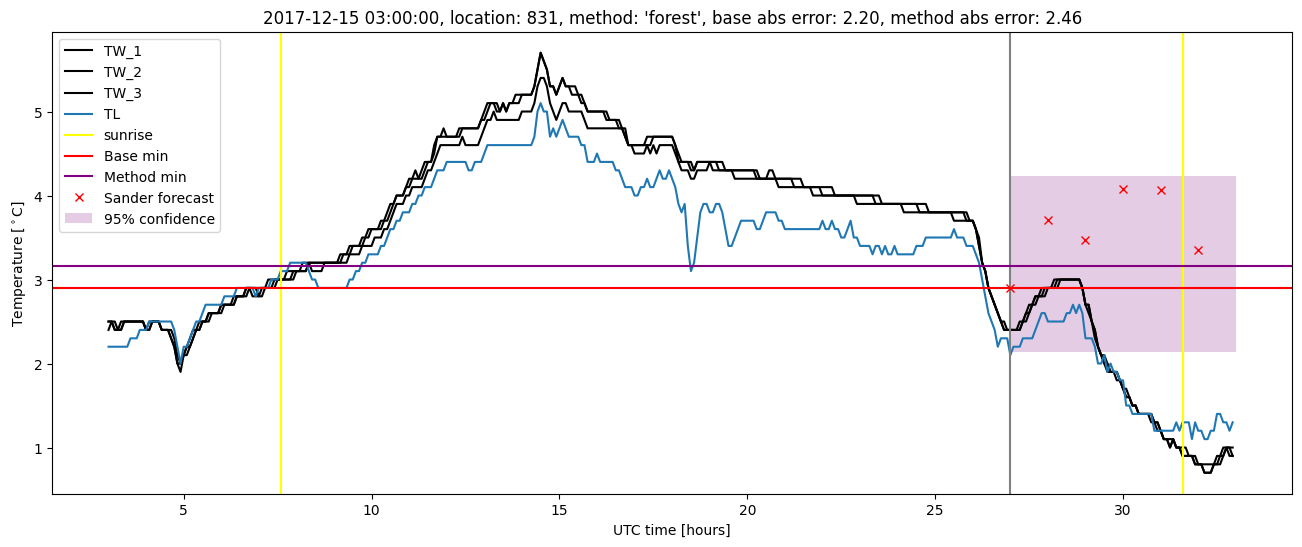
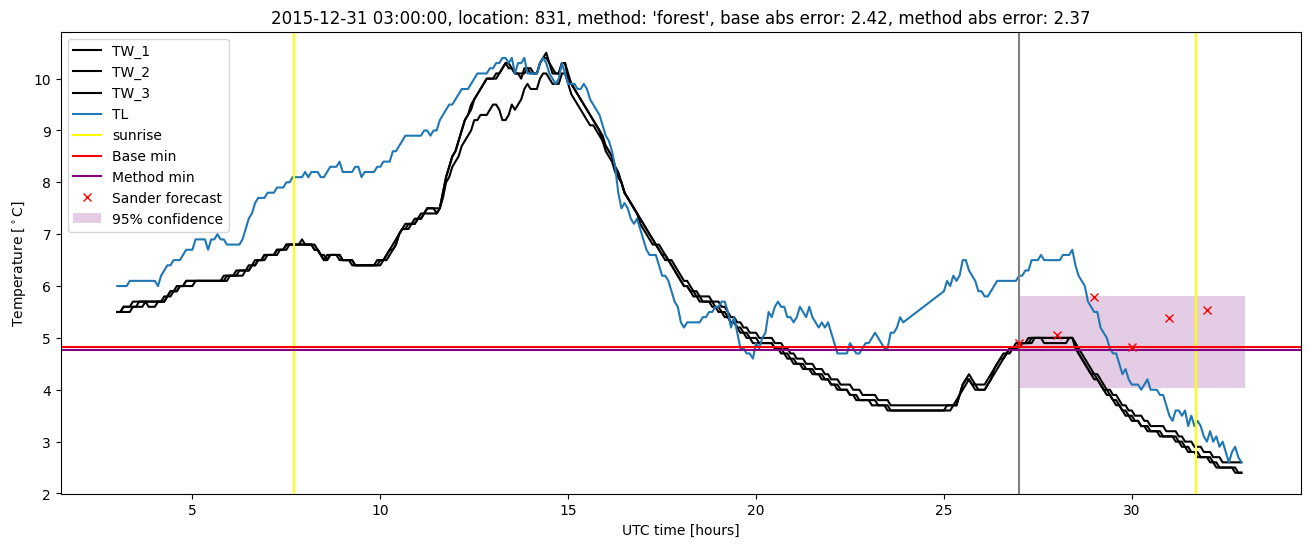
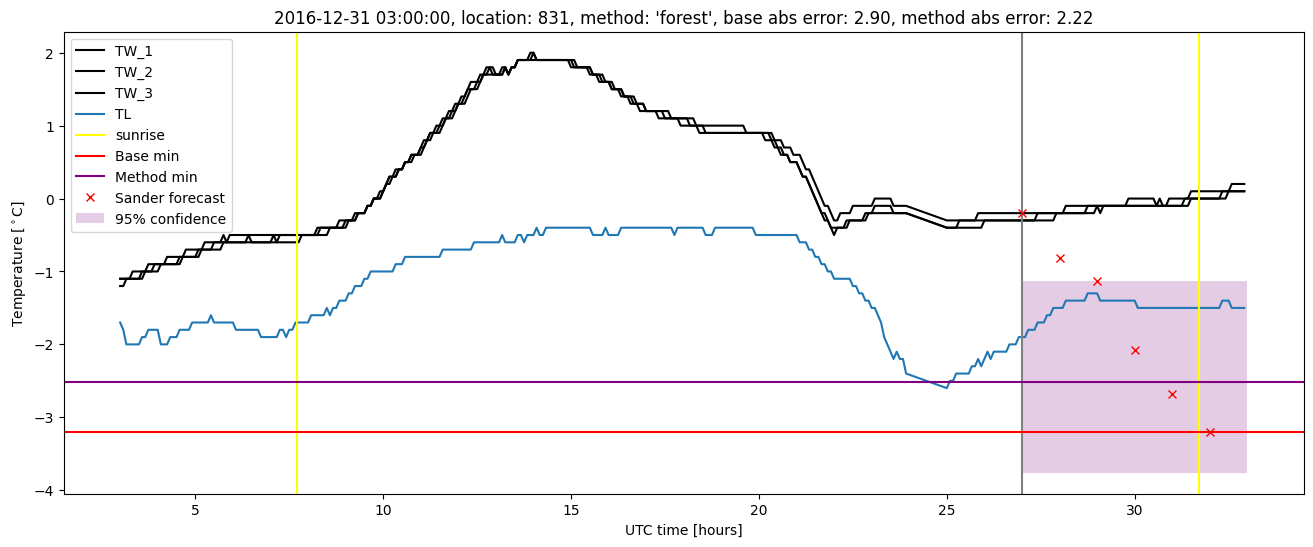
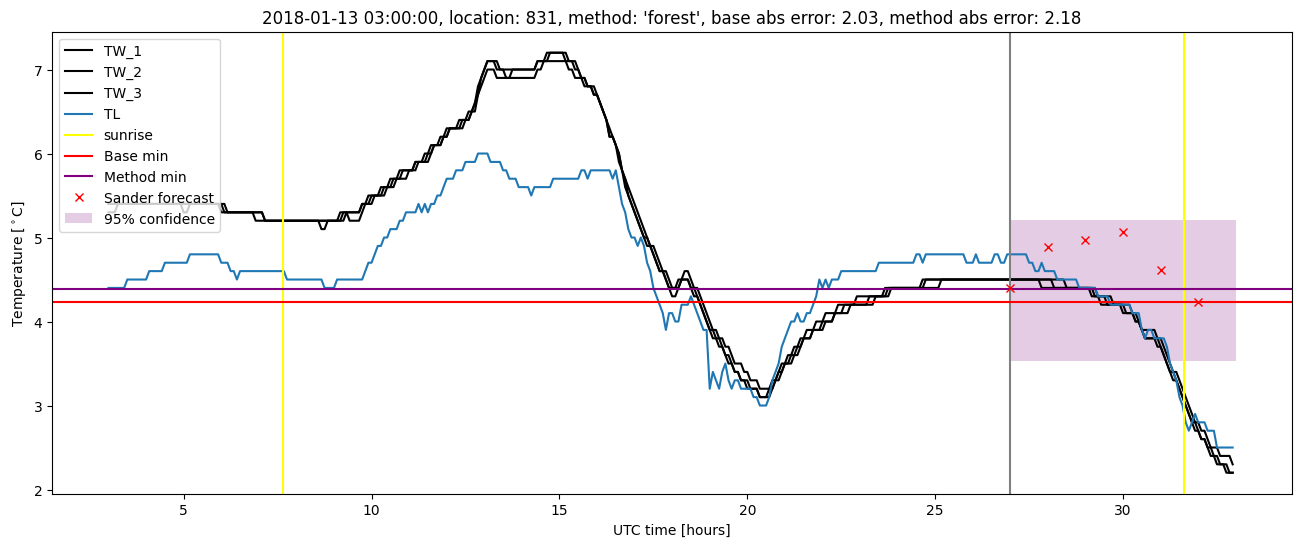
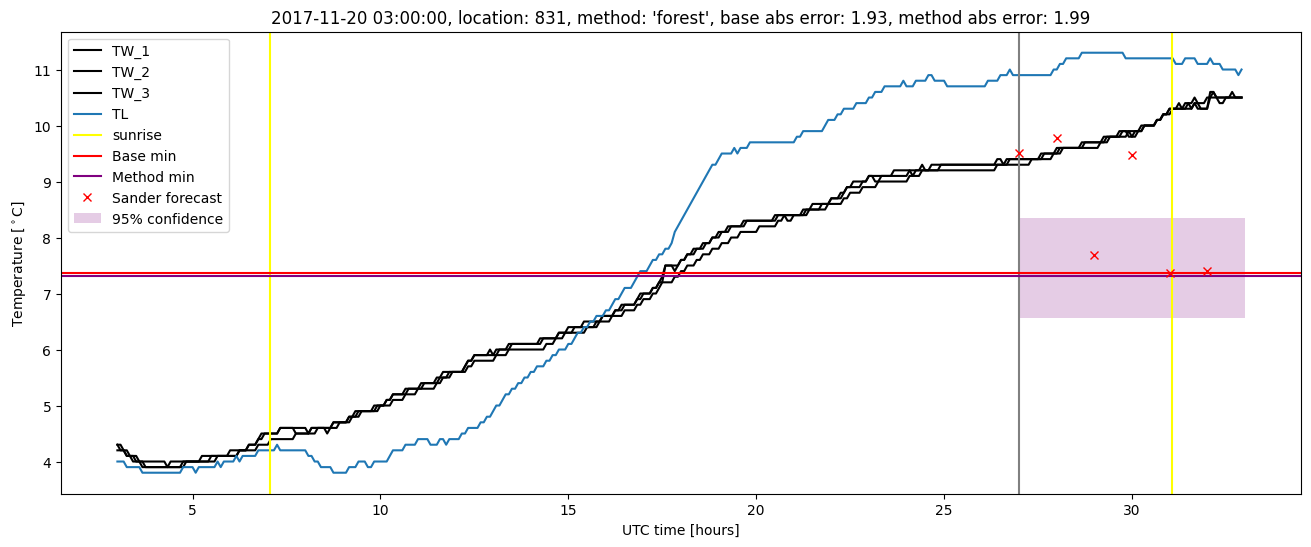
Random forest results
| names |
period |
power |
significance |
meanSquareError |
absError |
maxError |
CRPS |
IGN |
| baseline |
winter 2016 |
0.960 |
0.278 |
0.361 |
0.446 |
2.421 |
NaN |
NaN |
| forest |
winter 2016 |
0.994 |
0.111 |
0.285 |
0.385 |
2.367 |
0.451 |
3.945 |
| baseline |
winter 2017 |
0.958 |
0.121 |
0.398 |
0.451 |
2.902 |
NaN |
NaN |
| forest |
winter 2017 |
0.992 |
0.061 |
0.299 |
0.379 |
2.223 |
0.446 |
3.415 |
| baseline |
winter 2018 |
0.987 |
0.148 |
0.321 |
0.394 |
2.199 |
NaN |
NaN |
| forest |
winter 2018 |
0.974 |
0.111 |
0.301 |
0.381 |
2.462 |
0.439 |
3.088 |
| baseline |
winter 2019 |
0.981 |
0.067 |
0.264 |
0.371 |
2.071 |
NaN |
NaN |
| forest |
winter 2019 |
0.994 |
0.067 |
0.183 |
0.318 |
1.363 |
0.446 |
2.761 |
| baseline |
all |
0.972 |
0.150 |
0.335 |
0.415 |
2.902 |
NaN |
NaN |
| forest |
all |
0.988 |
0.086 |
0.267 |
0.366 |
2.462 |
0.446 |
3.317 |
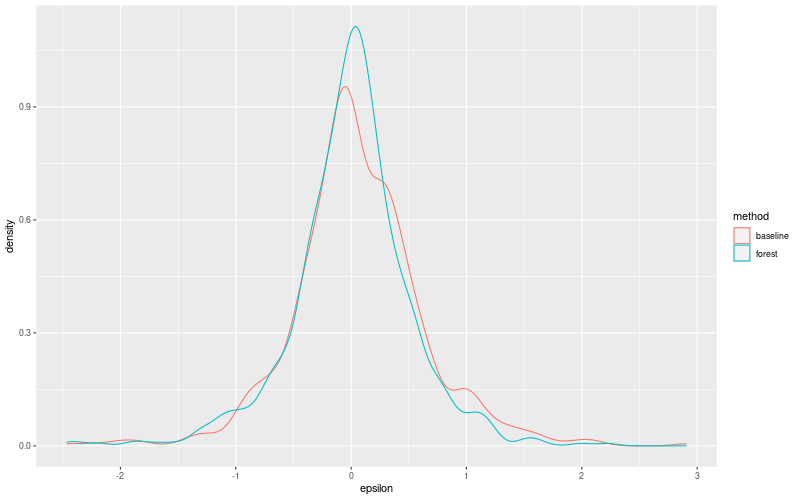
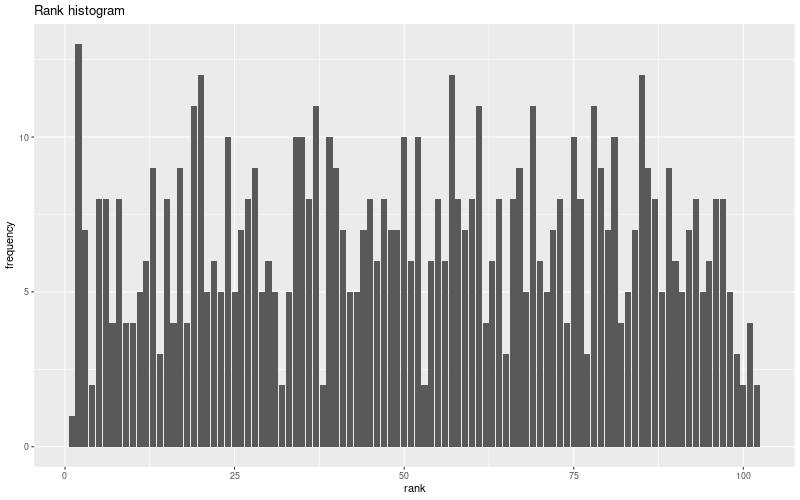
Random forest plots
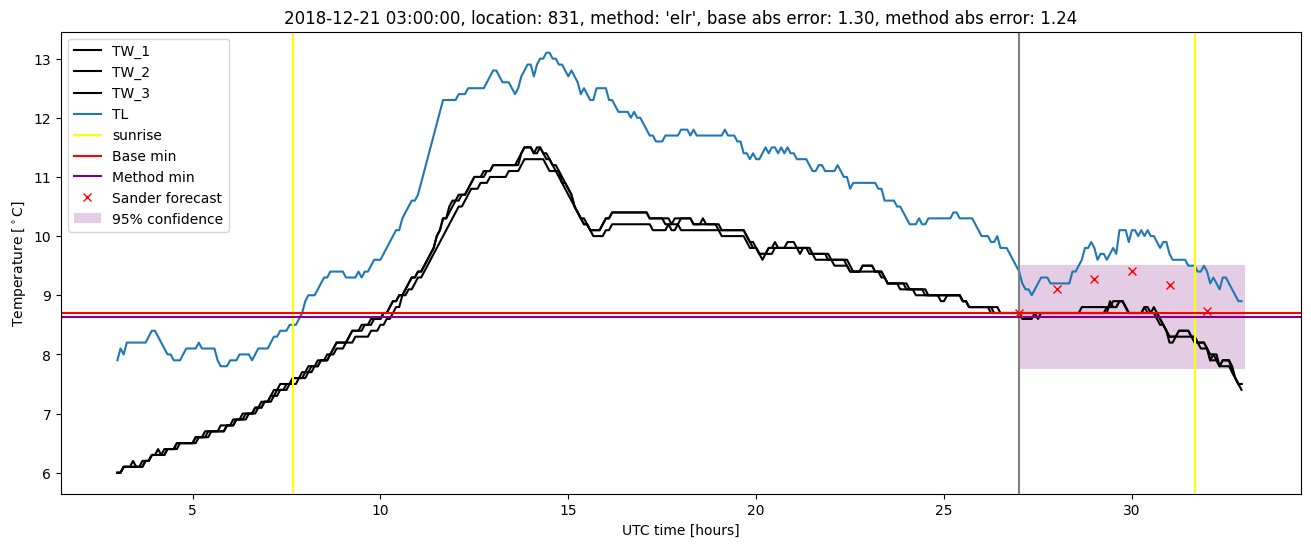
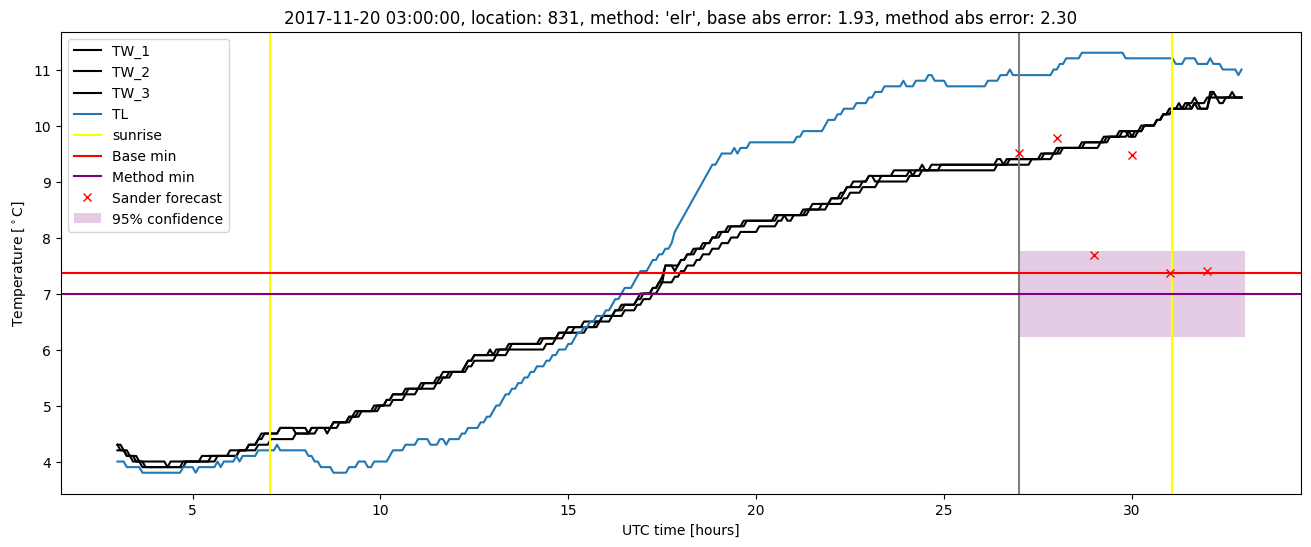
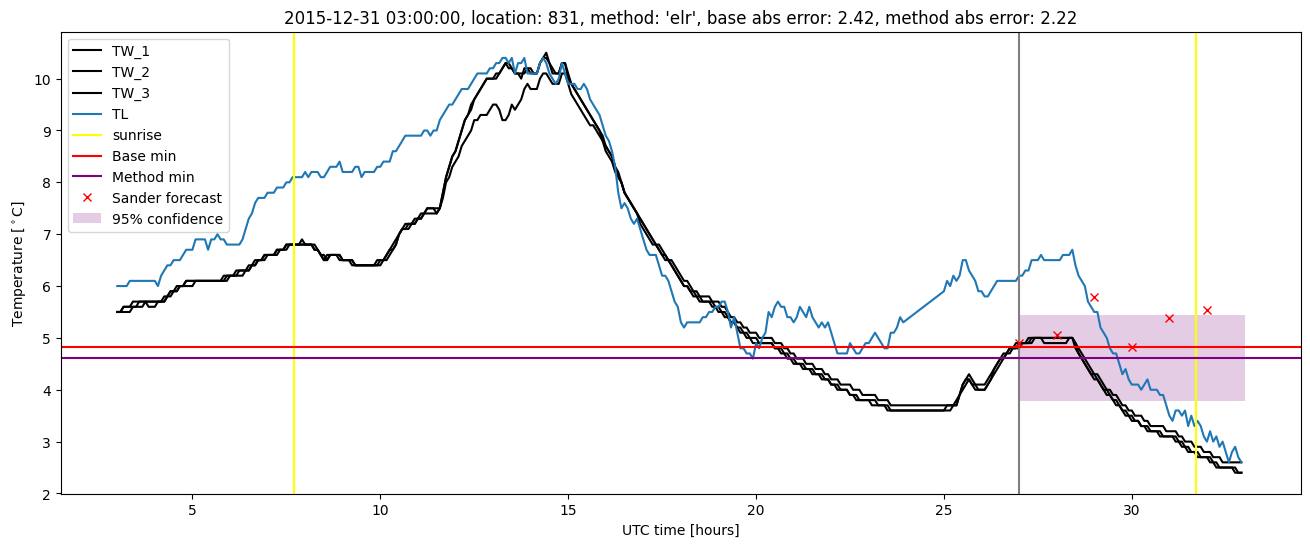
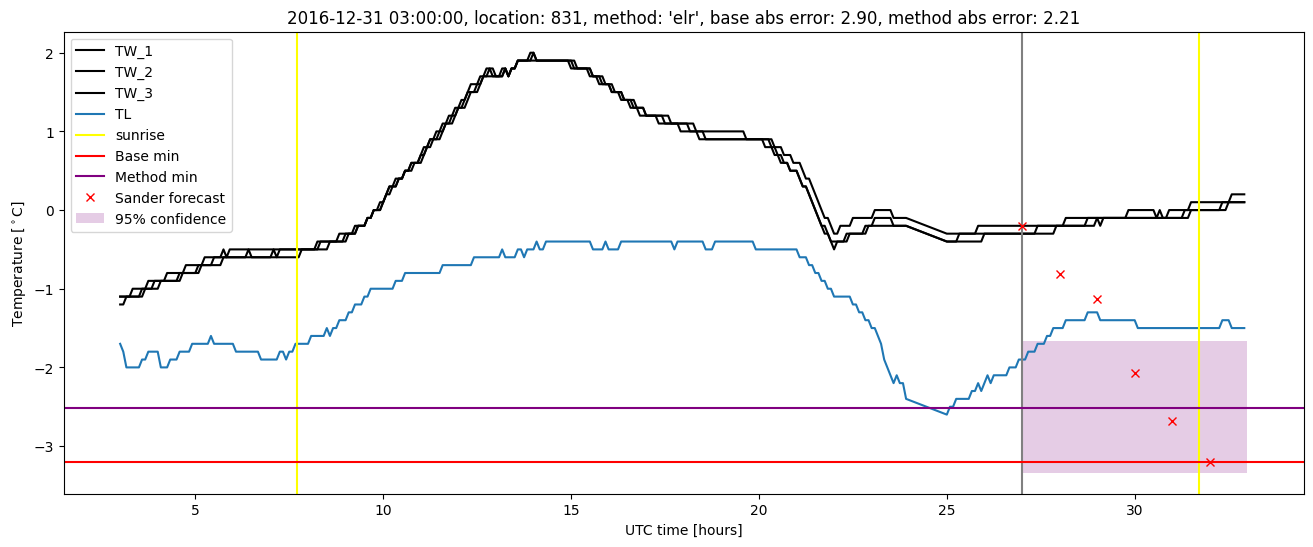
Extended logistic regression results
| names |
period |
power |
significance |
meanSquareError |
absError |
maxError |
CRPS |
IGN |
| baseline |
winter 2016 |
0.960 |
0.278 |
0.361 |
0.446 |
2.421 |
NaN |
NaN |
| elr |
winter 2016 |
0.977 |
0.056 |
0.295 |
0.401 |
2.220 |
0.529 |
5.077 |
| baseline |
winter 2017 |
0.958 |
0.121 |
0.398 |
0.451 |
2.902 |
NaN |
NaN |
| elr |
winter 2017 |
0.975 |
0.091 |
0.284 |
0.381 |
2.211 |
0.499 |
4.460 |
| baseline |
winter 2018 |
0.987 |
0.148 |
0.321 |
0.394 |
2.199 |
NaN |
NaN |
| elr |
winter 2018 |
0.980 |
0.111 |
0.320 |
0.404 |
2.304 |
0.525 |
6.285 |
| baseline |
winter 2019 |
0.981 |
0.067 |
0.264 |
0.371 |
2.071 |
NaN |
NaN |
| elr |
winter 2019 |
0.994 |
0.067 |
0.172 |
0.320 |
1.239 |
0.480 |
3.348 |
| baseline |
all |
0.972 |
0.150 |
0.335 |
0.415 |
2.902 |
NaN |
NaN |
| elr |
all |
0.982 |
0.086 |
0.269 |
0.377 |
2.304 |
0.510 |
4.830 |
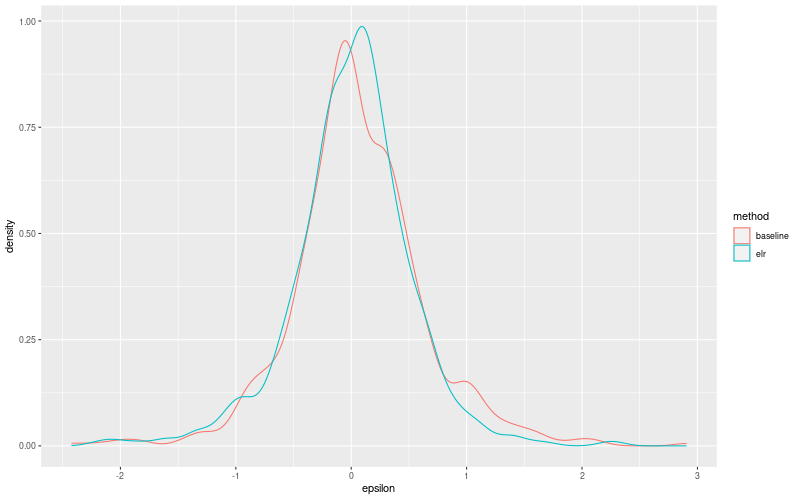
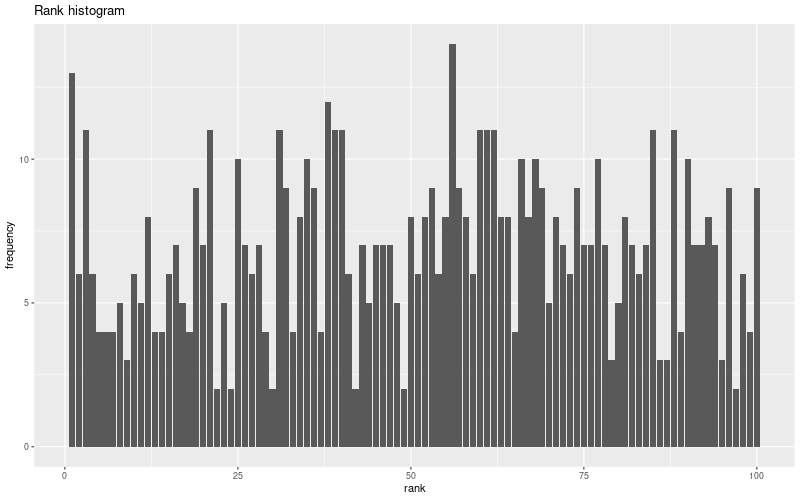
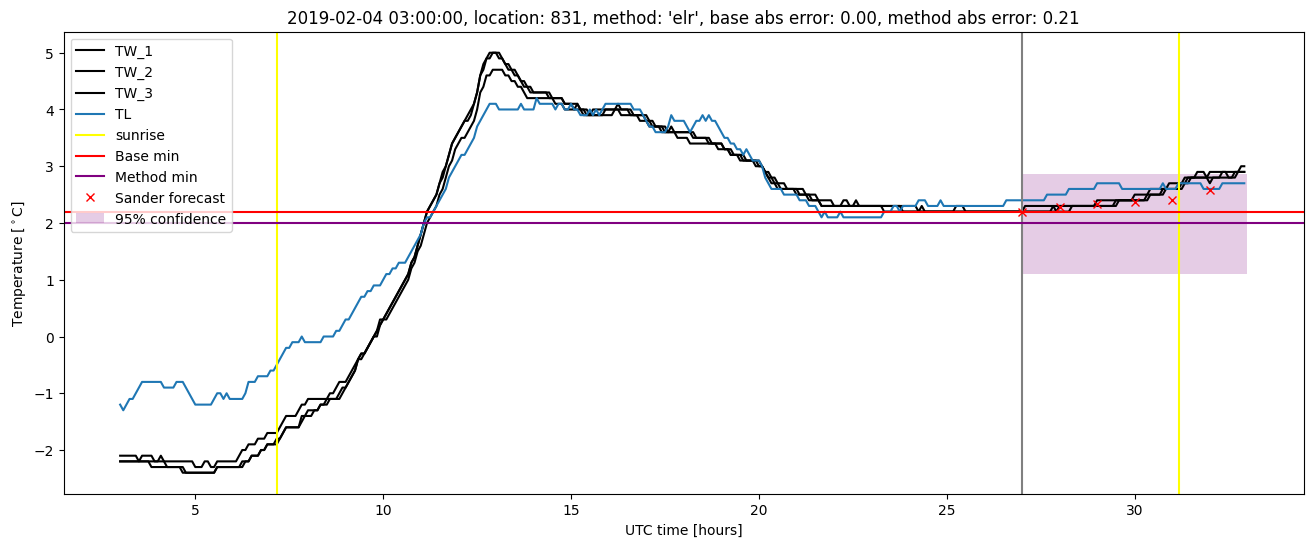
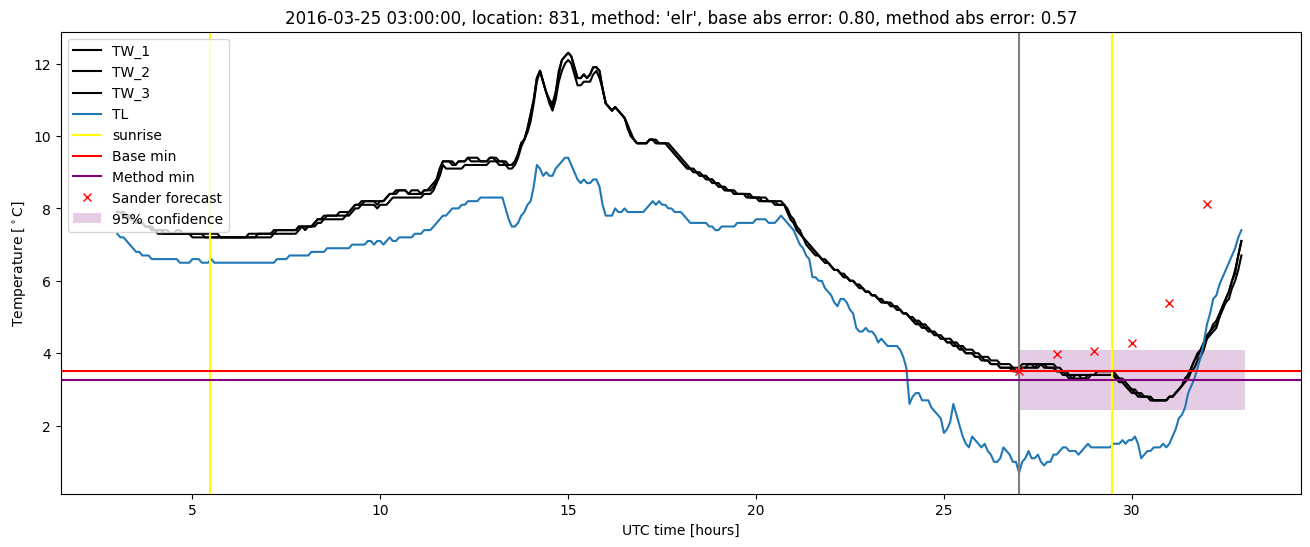
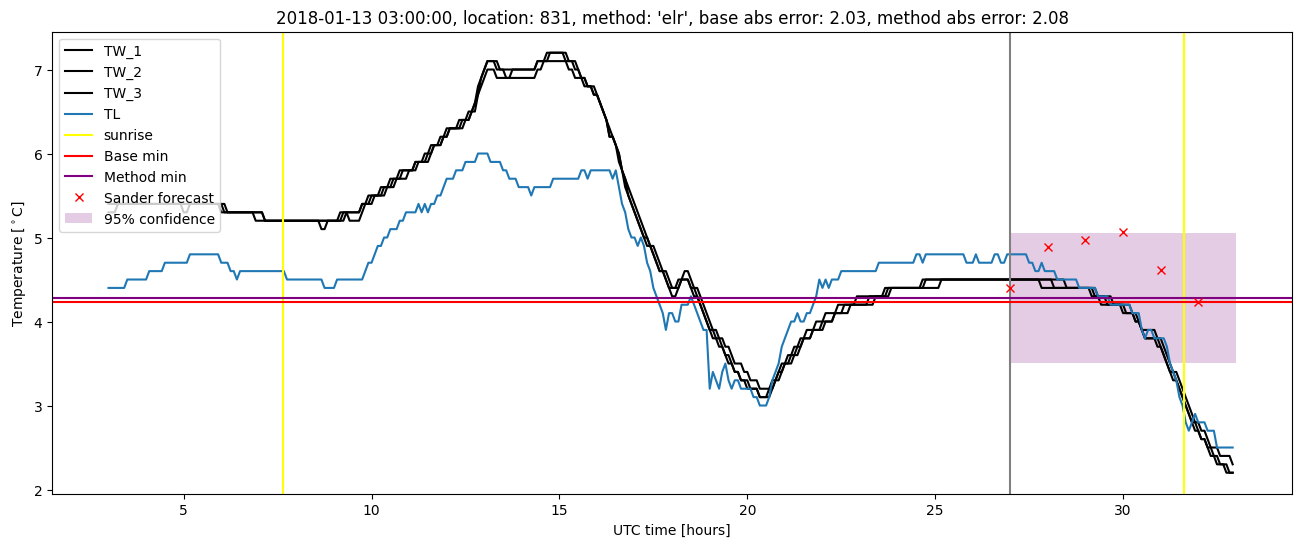
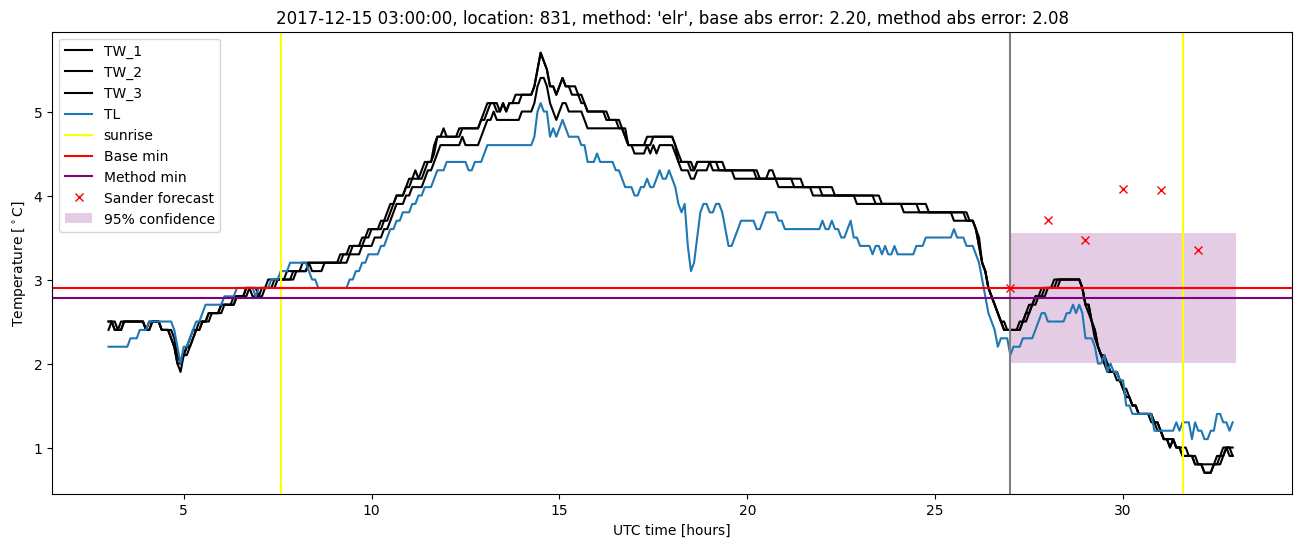
Extended logistic regression plots