GMS location: 818
Random forest results
| names |
period |
power |
significance |
meanSquareError |
absError |
maxError |
CRPS |
IGN |
| baseline |
winter 2016 |
0.913 |
0.000e+00 |
0.482 |
0.554 |
2.260 |
NaN |
NaN |
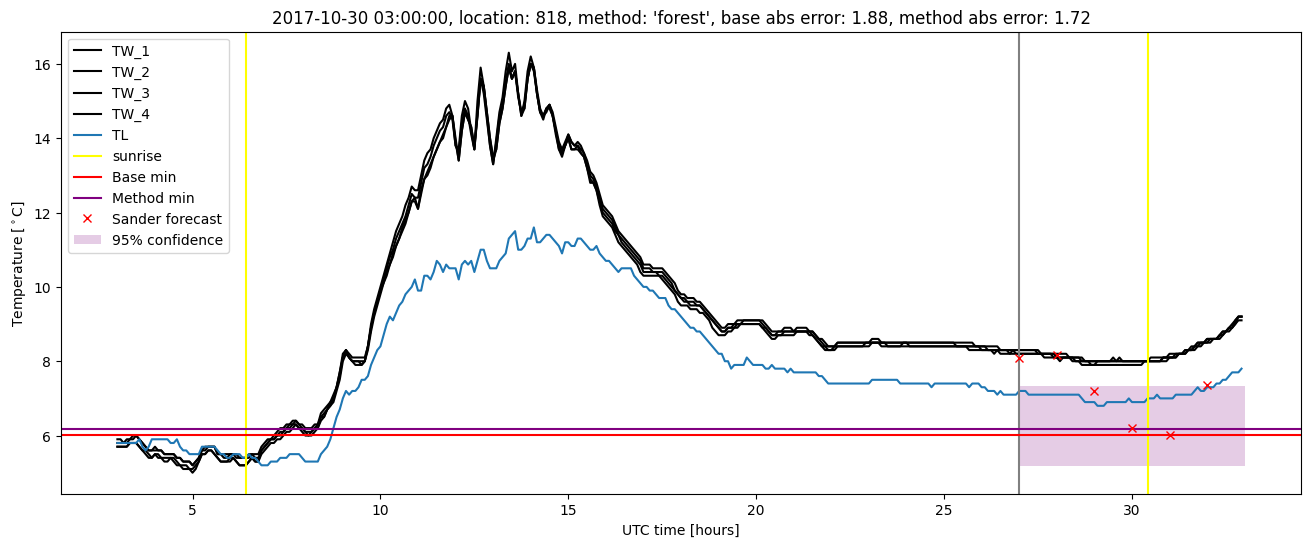
| forest |
winter 2016 |
1.000 |
0.000e+00 |
0.357 |
0.485 |
1.701 |
0.363 |
1.182 |
| baseline |
winter 2017 |
0.983 |
0.083 |
0.568 |
0.538 |
2.317 |
NaN |
NaN |
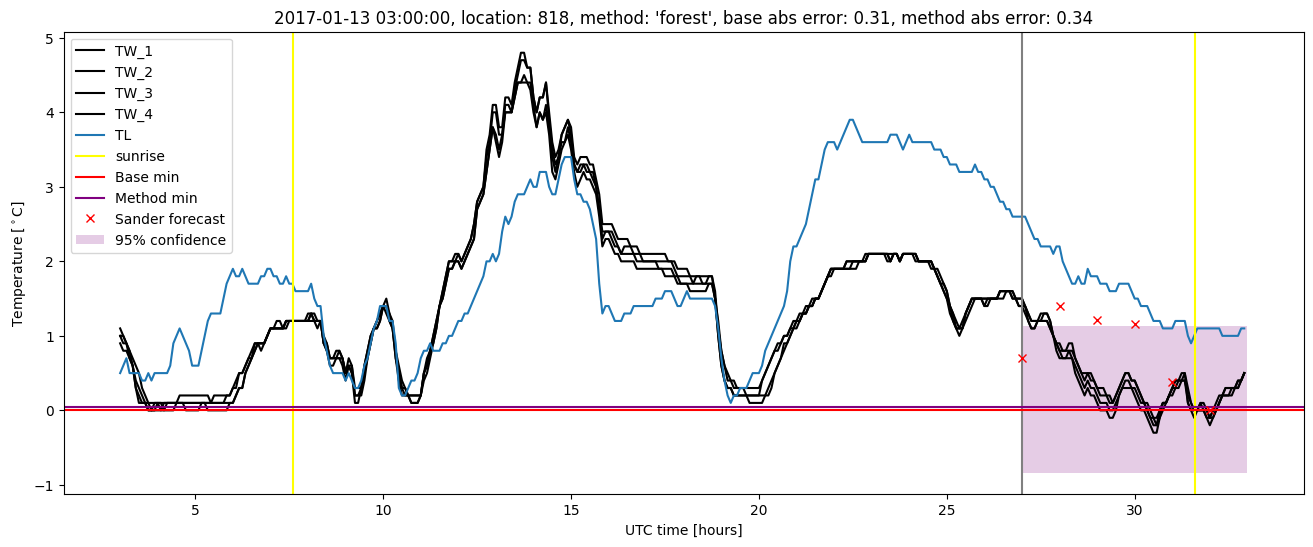
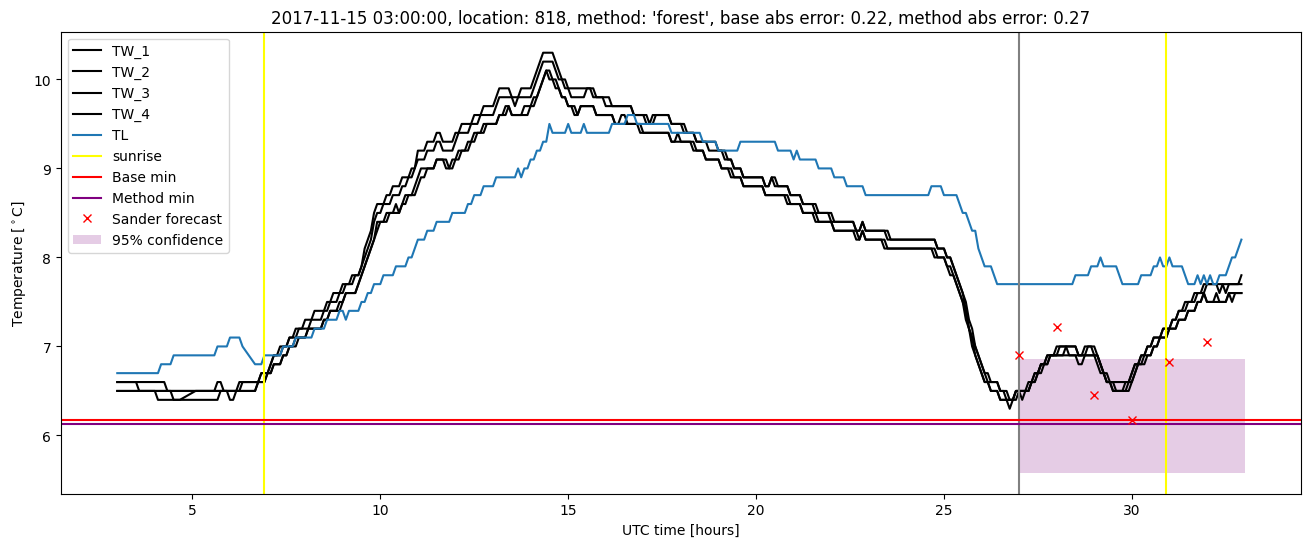
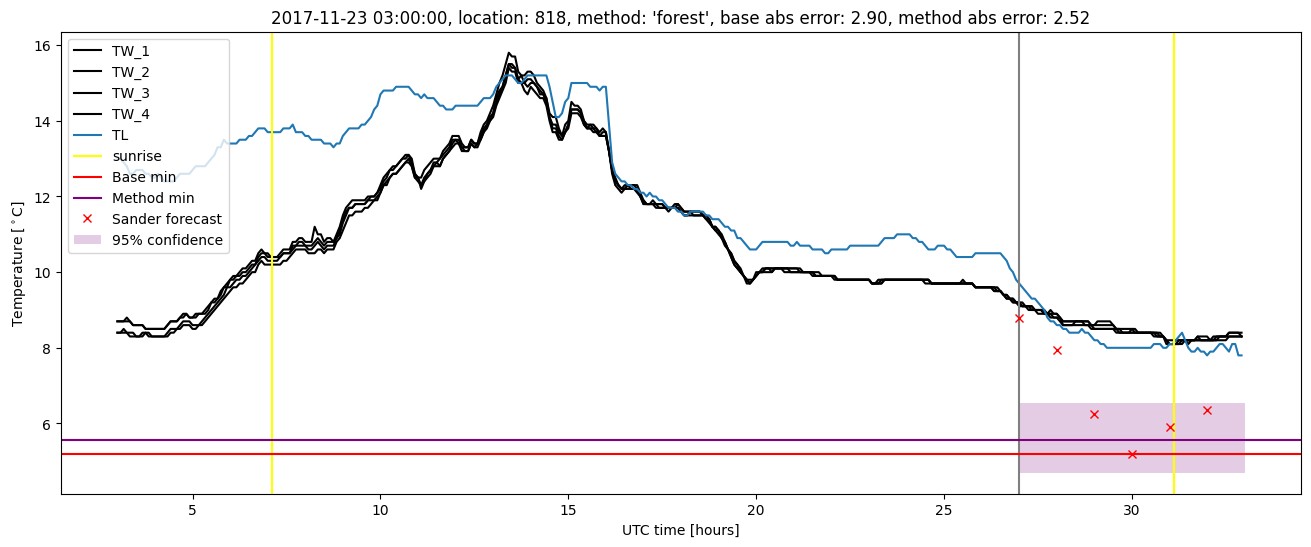
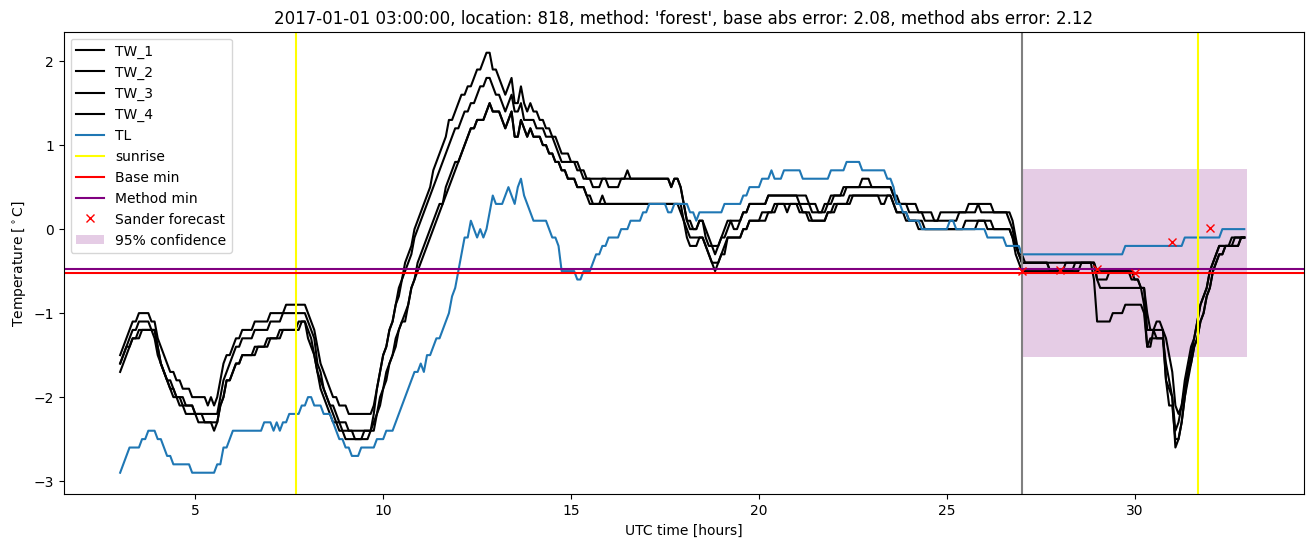
| forest |
winter 2017 |
0.991 |
0.083 |
0.326 |
0.415 |
2.125 |
0.411 |
2.022 |
| baseline |
winter 2018 |
0.987 |
0.042 |
0.594 |
0.567 |
2.898 |
NaN |
NaN |
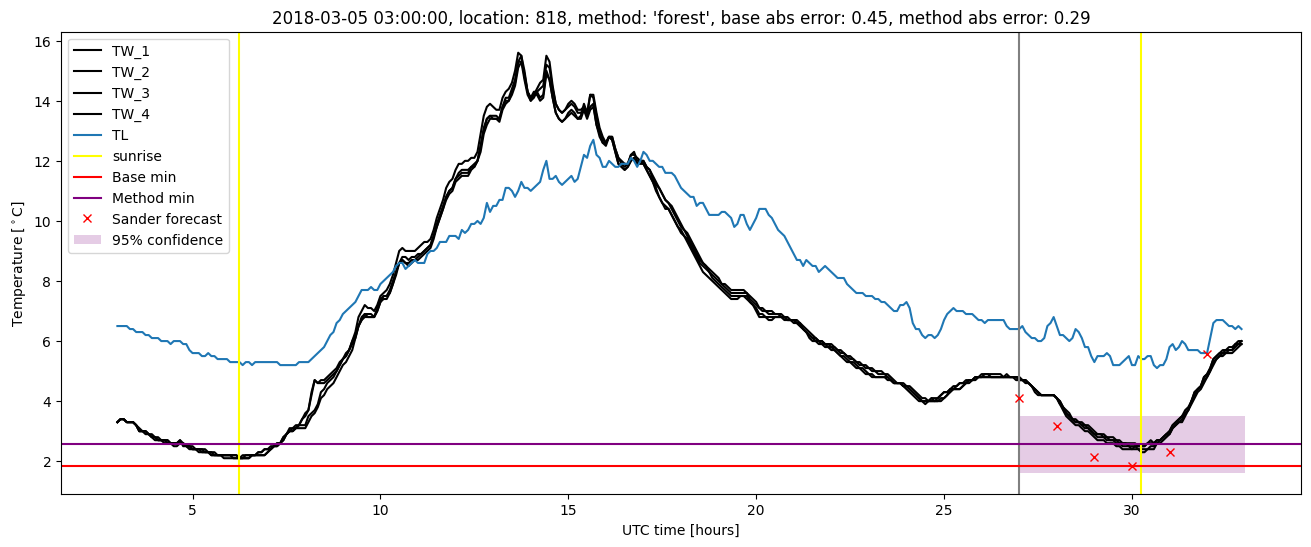
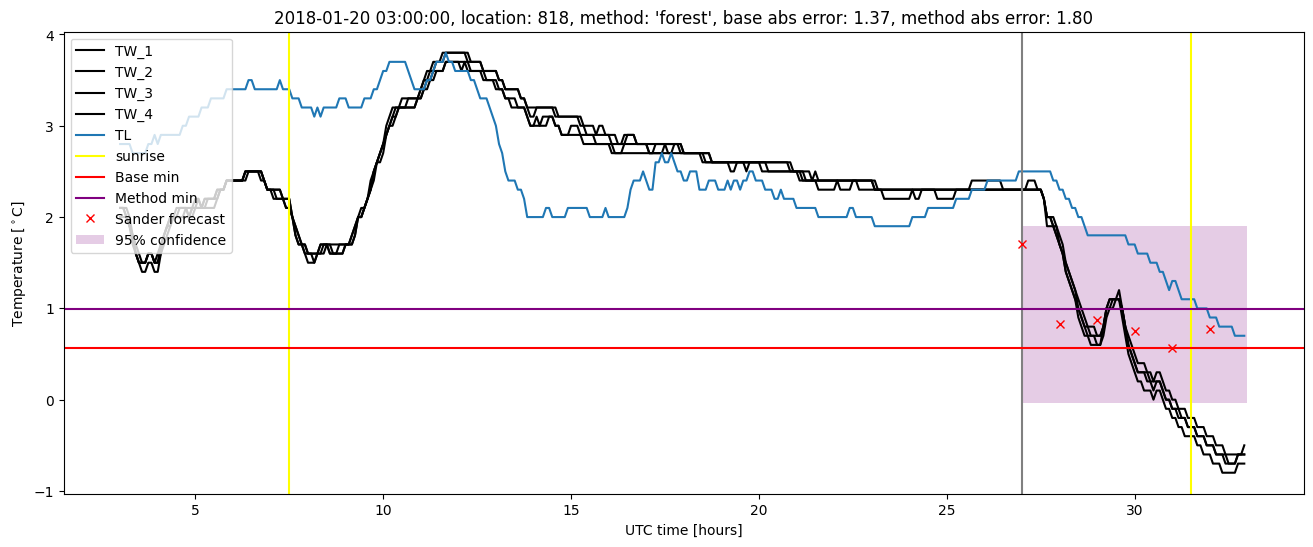
| forest |
winter 2018 |
0.980 |
0.083 |
0.344 |
0.430 |
2.525 |
0.411 |
2.193 |
| baseline |
winter 2019 |
1.000 |
NaN |
0.696 |
0.719 |
1.495 |
NaN |
NaN |
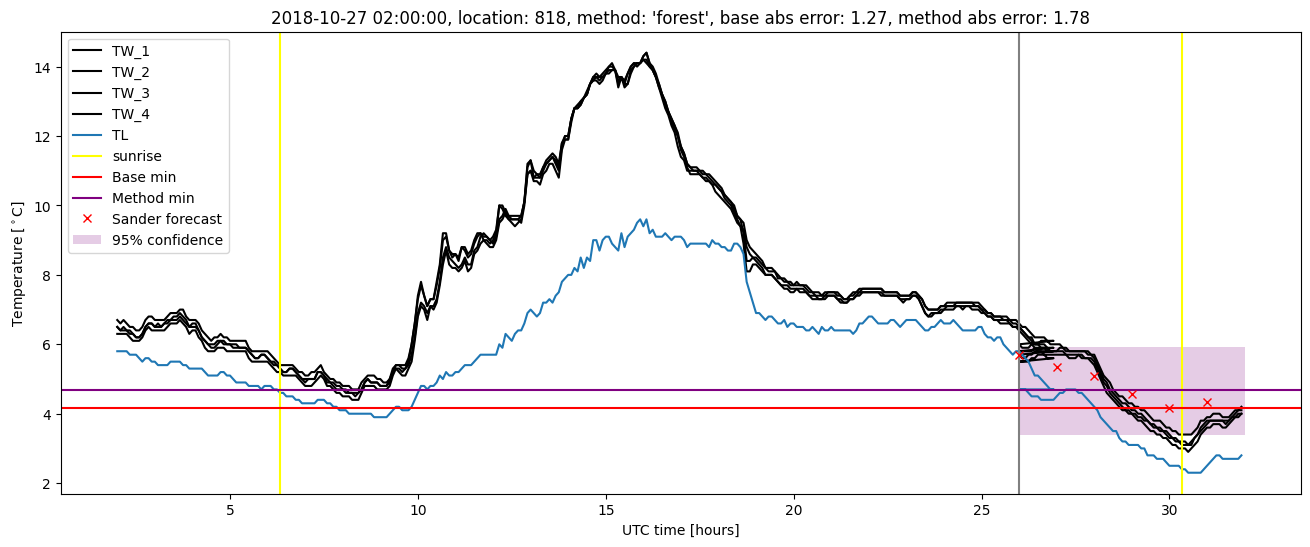
| forest |
winter 2019 |
1.000 |
NaN |
0.403 |
0.463 |
1.777 |
0.376 |
1.325 |
| baseline |
all |
0.976 |
0.066 |
0.578 |
0.564 |
2.898 |
NaN |
NaN |
| forest |
all |
0.988 |
0.082 |
0.343 |
0.433 |
2.525 |
0.403 |
1.953 |
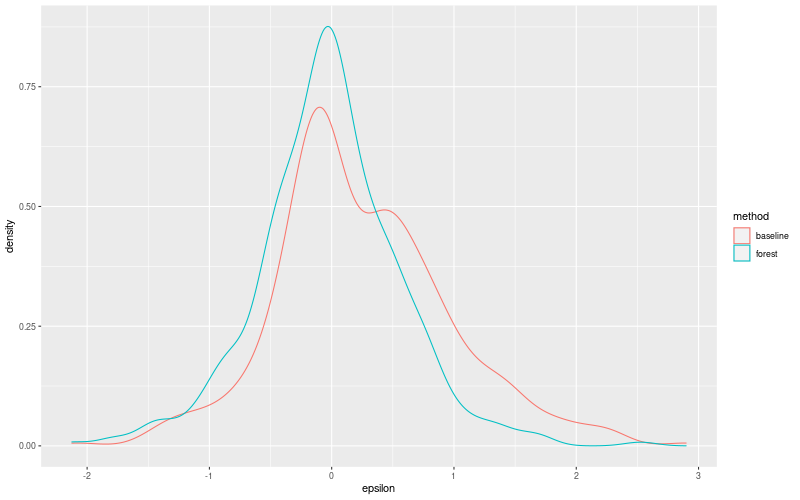
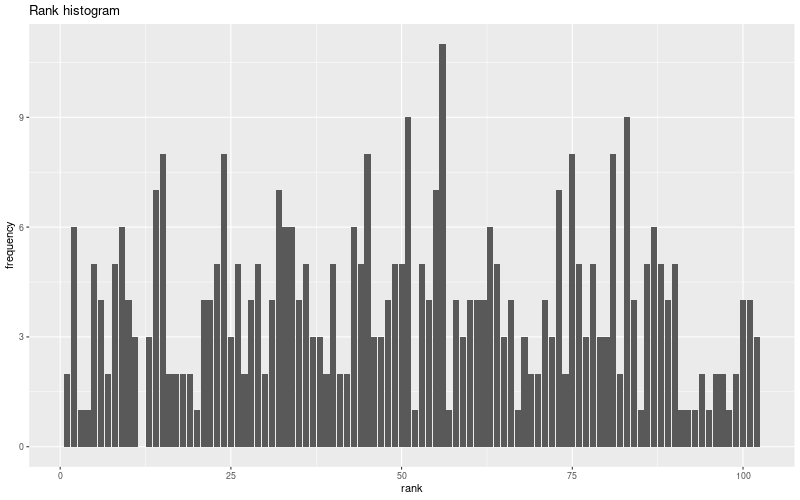
Random forest plots
Extended logistic regression results
| names |
period |
power |
significance |
meanSquareError |
absError |
maxError |
CRPS |
IGN |
| baseline |
winter 2016 |
0.913 |
0.000e+00 |
0.482 |
0.554 |
2.260 |
NaN |
NaN |
| elr |
winter 2016 |
0.935 |
0.000e+00 |
0.426 |
0.495 |
2.023 |
0.548 |
4.089 |
| baseline |
winter 2017 |
0.983 |
0.083 |
0.568 |
0.538 |
2.317 |
NaN |
NaN |
| elr |
winter 2017 |
0.983 |
0.083 |
0.306 |
0.415 |
1.875 |
0.543 |
3.732 |
| baseline |
winter 2018 |
0.987 |
0.042 |
0.594 |
0.567 |
2.898 |
NaN |
NaN |
| elr |
winter 2018 |
0.987 |
0.125 |
0.365 |
0.459 |
2.026 |
0.554 |
4.650 |
| baseline |
winter 2019 |
1.000 |
NaN |
0.696 |
0.719 |
1.495 |
NaN |
NaN |
| elr |
winter 2019 |
1.000 |
NaN |
0.365 |
0.404 |
1.977 |
0.519 |
3.520 |
| baseline |
all |
0.976 |
0.066 |
0.578 |
0.564 |
2.898 |
NaN |
NaN |
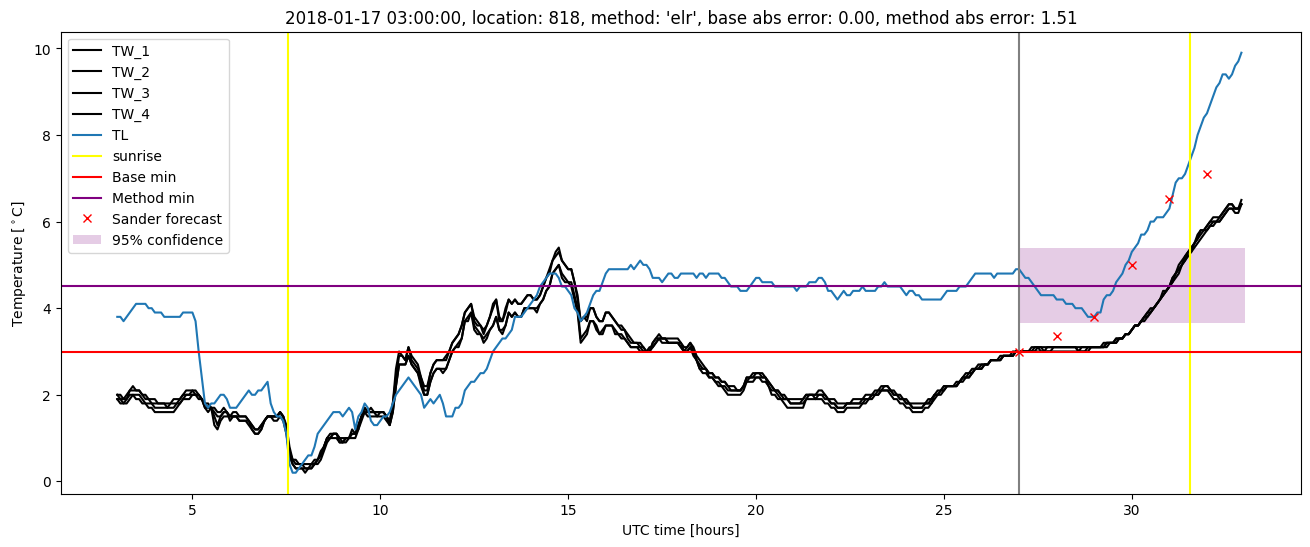
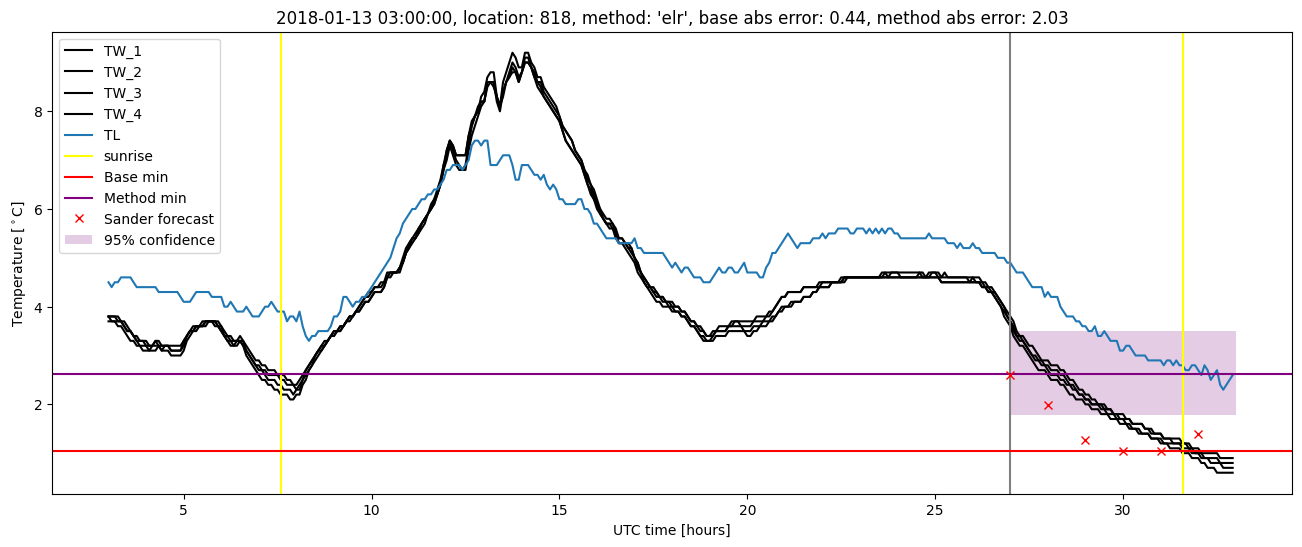
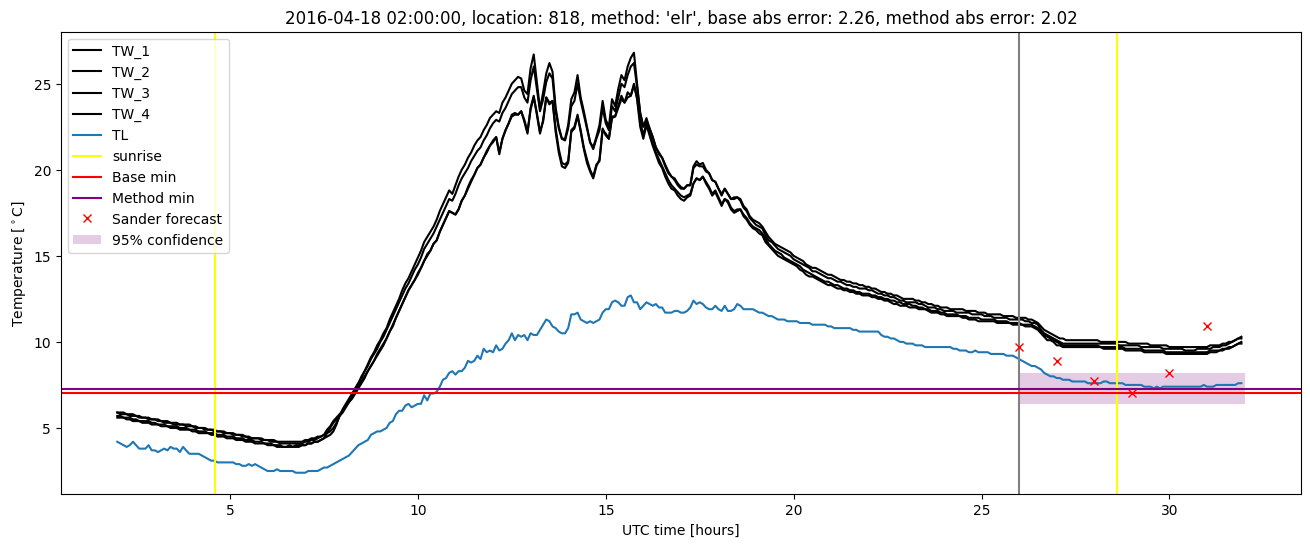
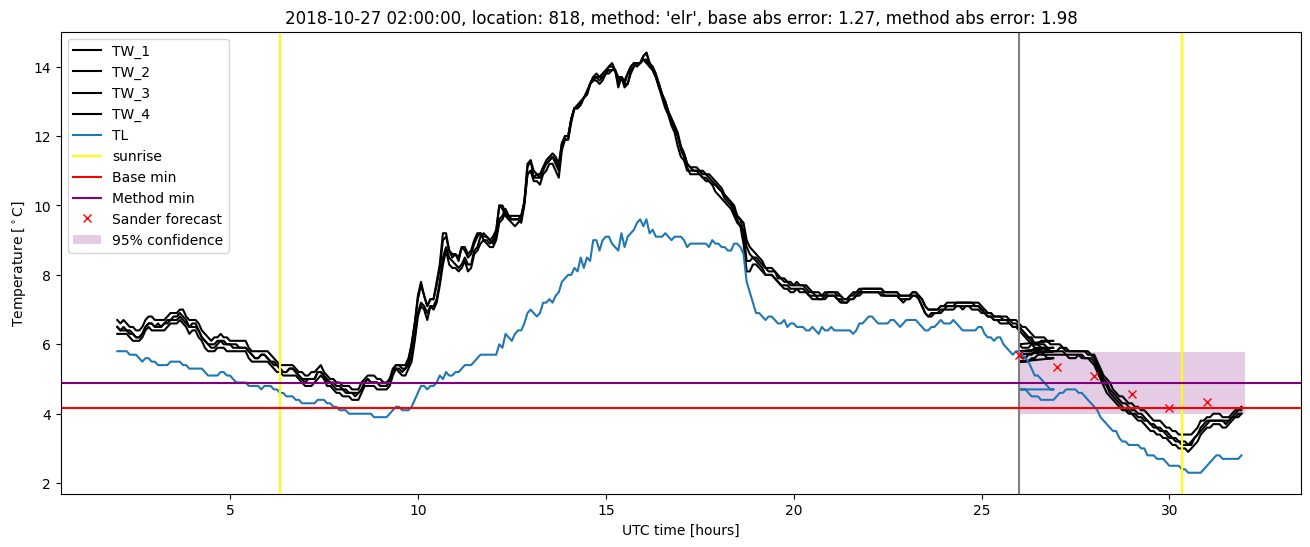
| elr |
all |
0.979 |
0.098 |
0.350 |
0.443 |
2.026 |
0.547 |
4.163 |
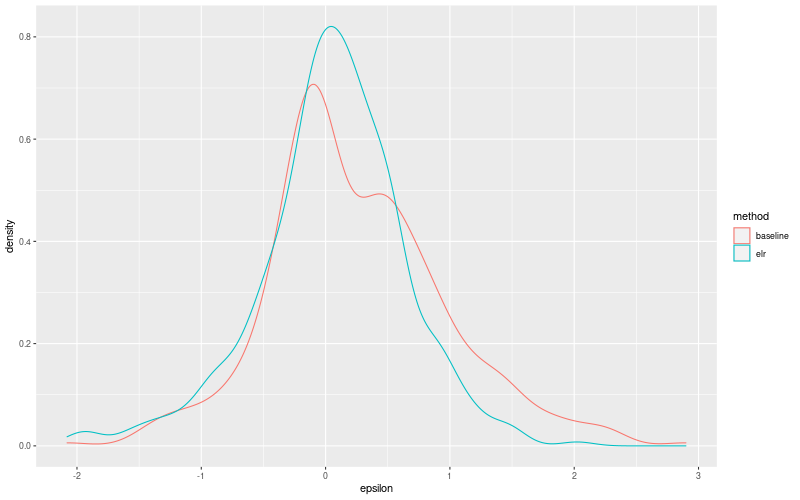
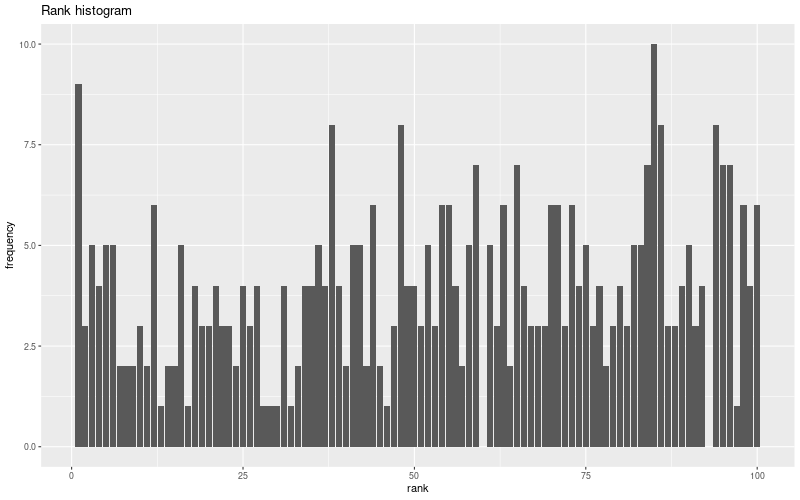
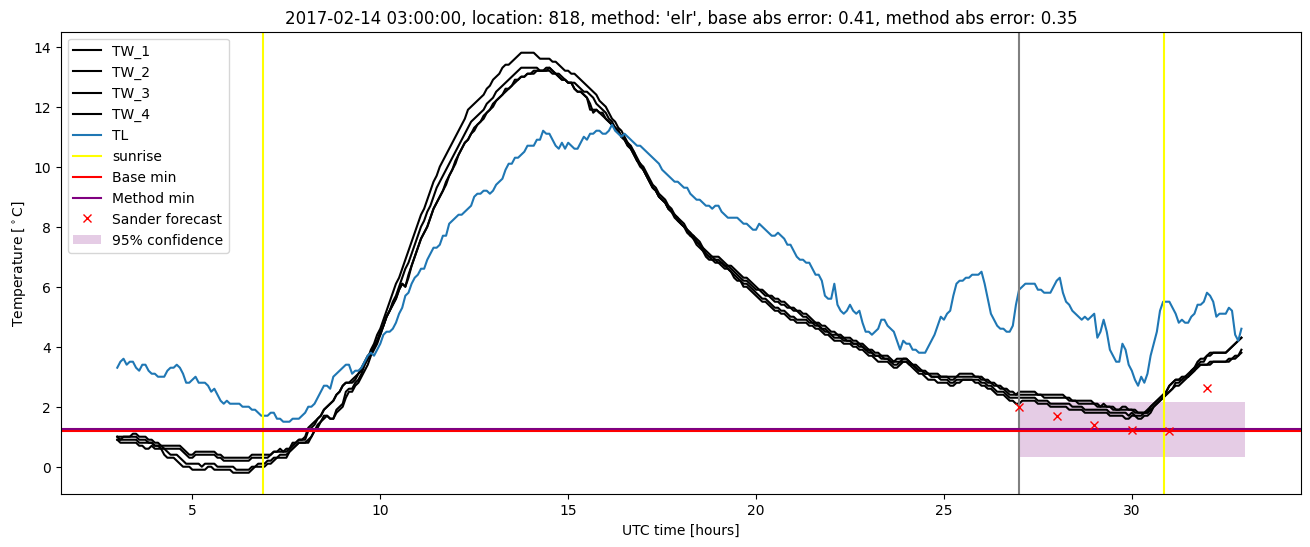
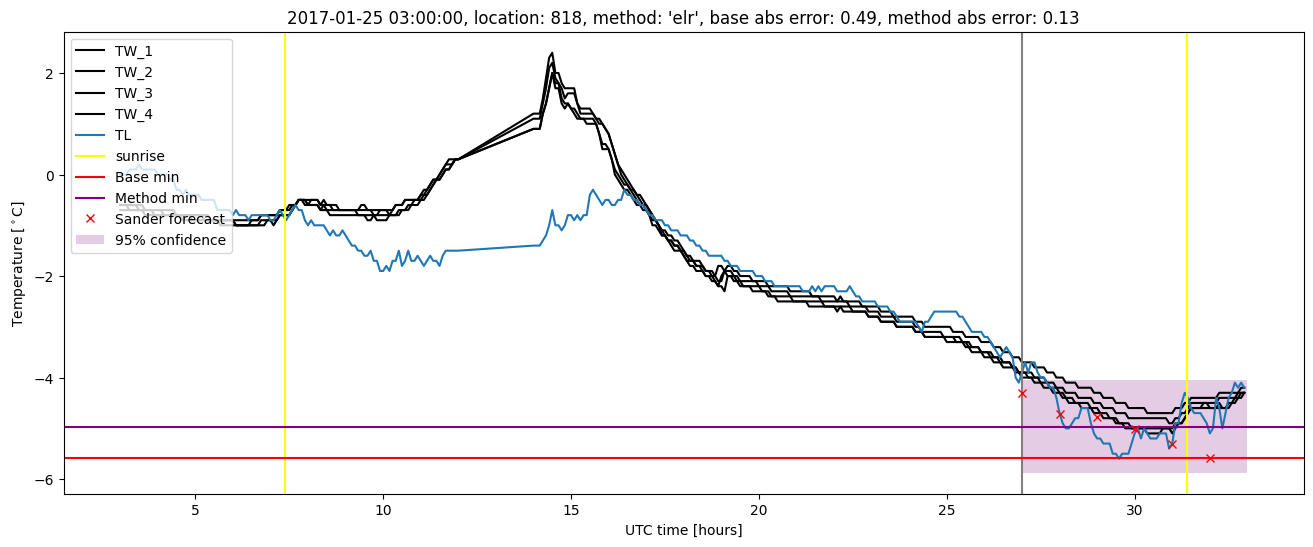
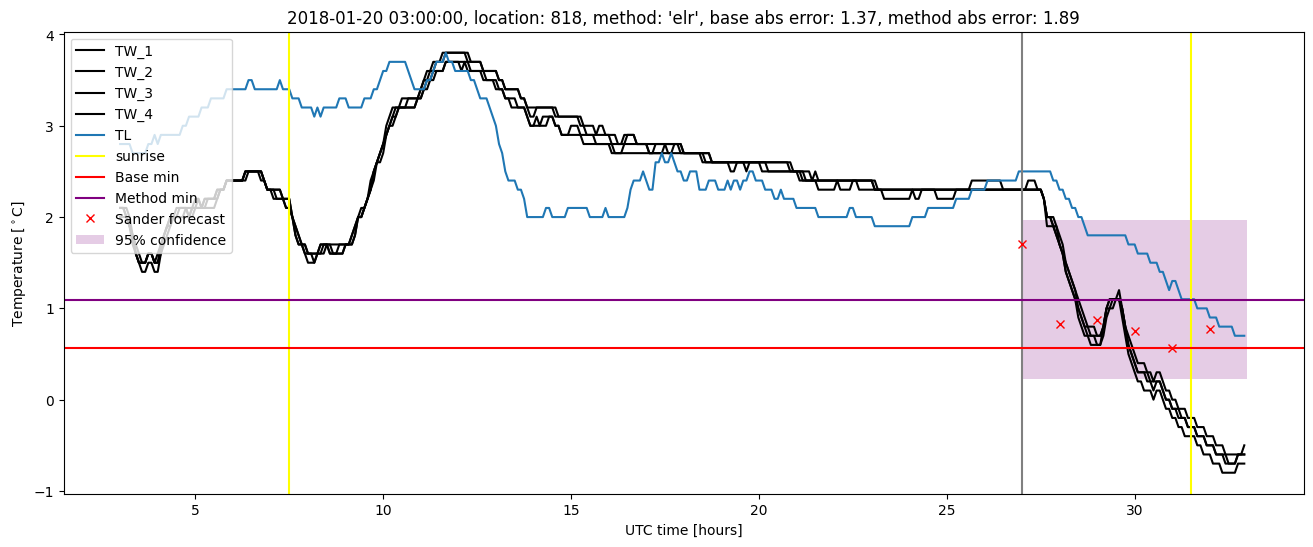
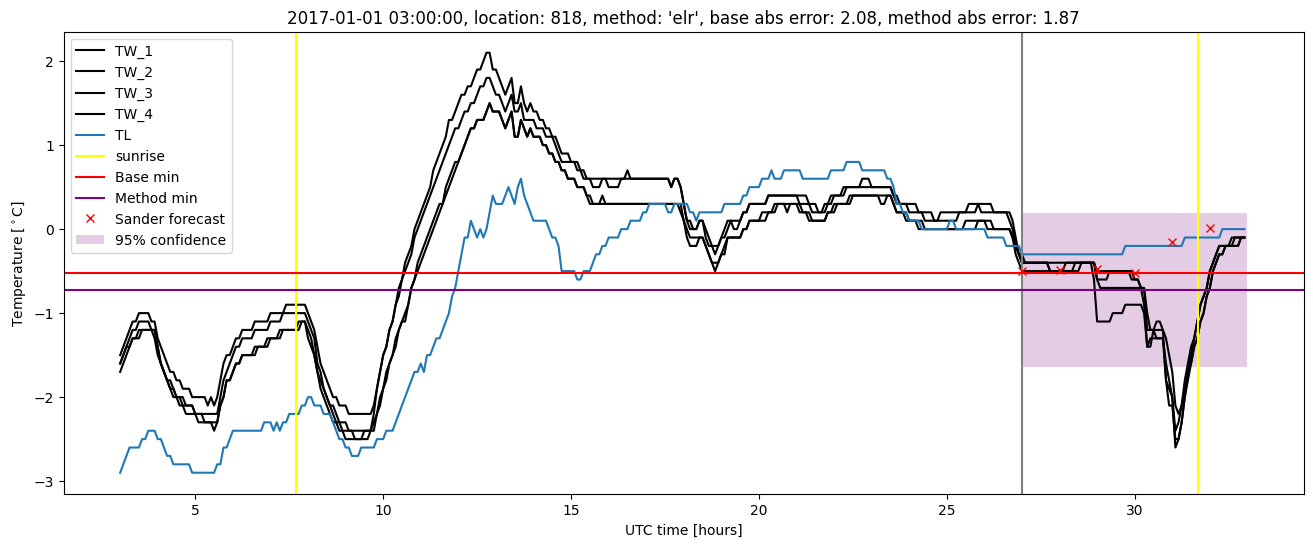
Extended logistic regression plots