GMS location: 816
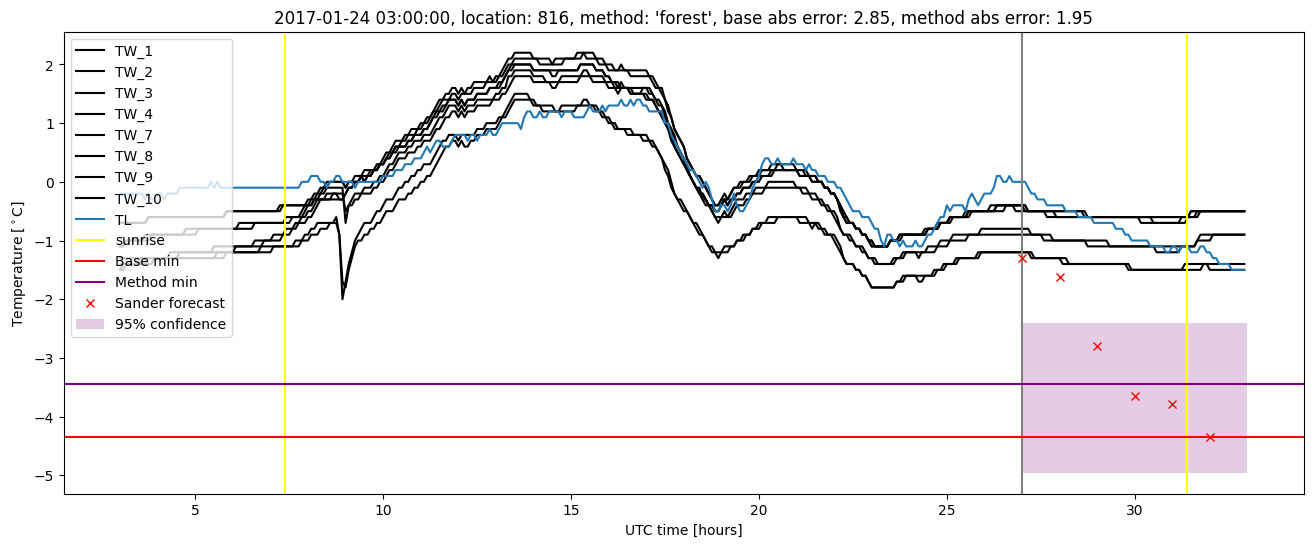
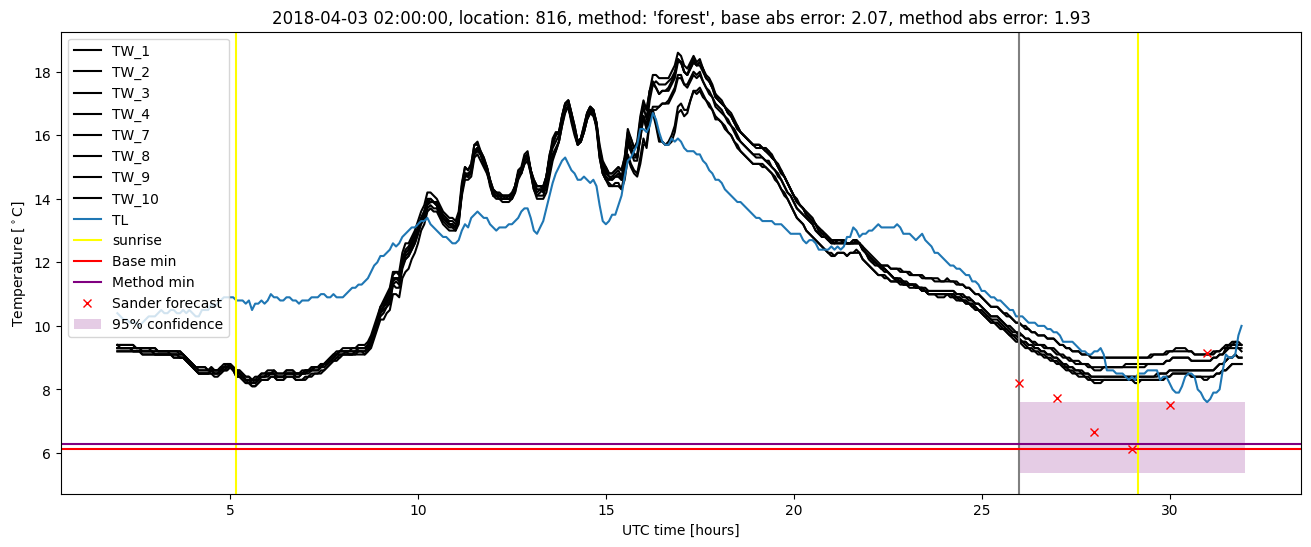
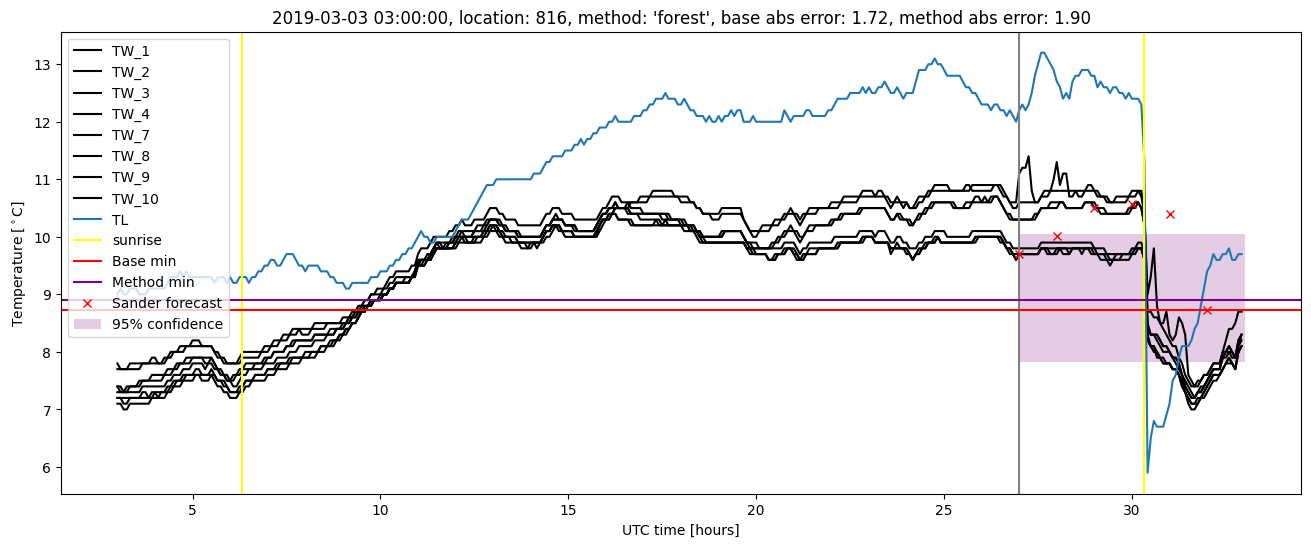
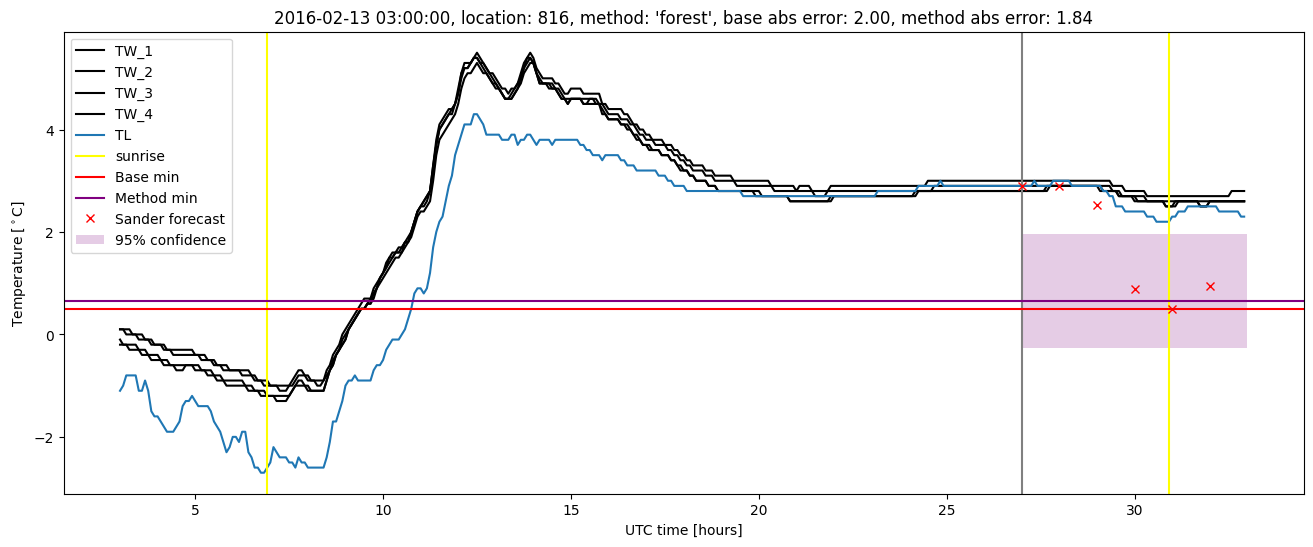
Random forest results
| names |
period |
power |
significance |
meanSquareError |
absError |
maxError |
CRPS |
IGN |
| baseline |
winter 2016 |
0.984 |
0.118 |
0.451 |
0.495 |
2.234 |
NaN |
NaN |
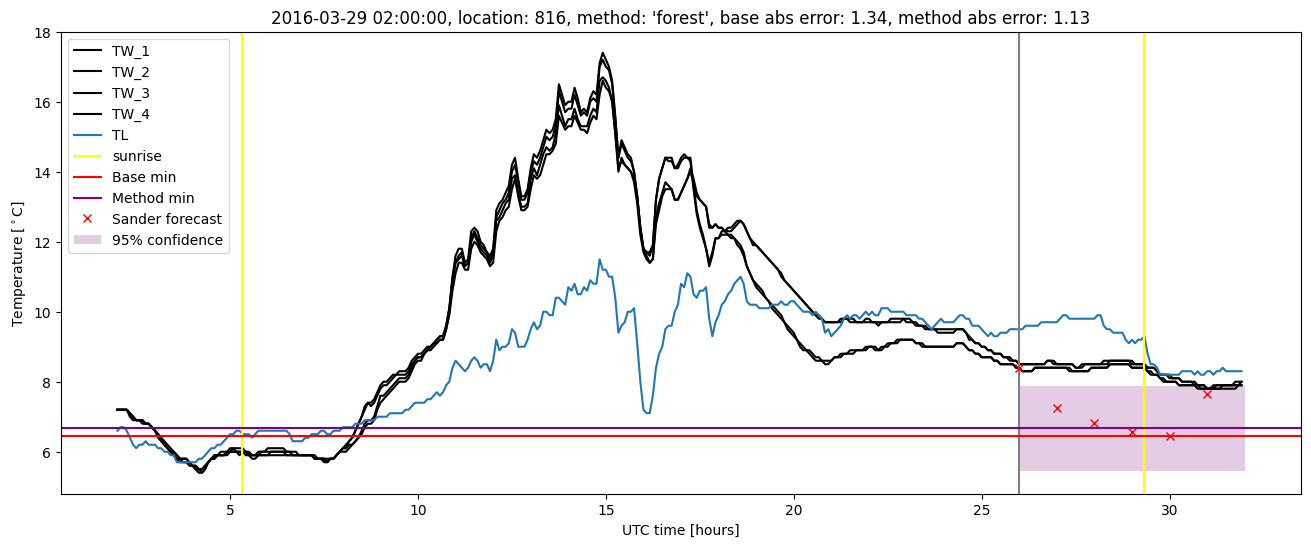
| forest |
winter 2016 |
0.995 |
0.059 |
0.403 |
0.473 |
2.095 |
0.464 |
3.435 |
| baseline |
winter 2017 |
0.991 |
0.056 |
0.274 |
0.363 |
2.848 |
NaN |
NaN |
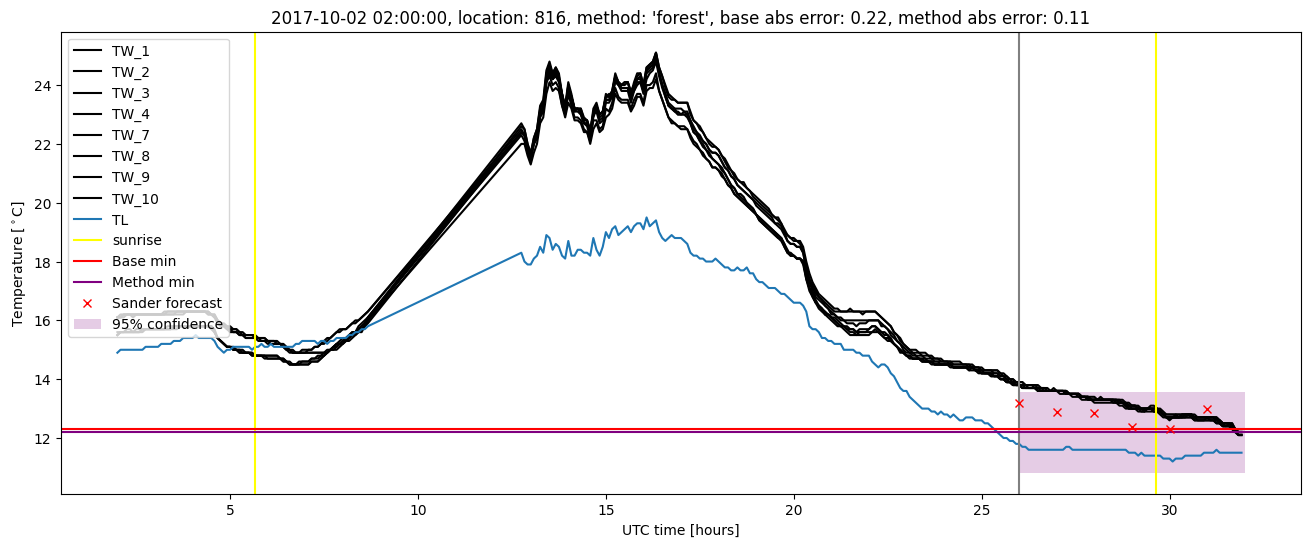
| forest |
winter 2017 |
0.983 |
0.056 |
0.222 |
0.348 |
1.948 |
0.460 |
2.676 |
| baseline |
winter 2018 |
0.987 |
0.042 |
0.418 |
0.481 |
2.069 |
NaN |
NaN |
| forest |
winter 2018 |
0.987 |
0.042 |
0.344 |
0.444 |
1.927 |
0.437 |
2.340 |
| baseline |
winter 2019 |
0.984 |
0.048 |
0.364 |
0.431 |
1.940 |
NaN |
NaN |
| forest |
winter 2019 |
0.984 |
0.048 |
0.287 |
0.380 |
1.905 |
0.437 |
2.315 |
| baseline |
all |
0.986 |
0.061 |
0.384 |
0.448 |
2.848 |
NaN |
NaN |
| forest |
all |
0.988 |
0.051 |
0.322 |
0.417 |
2.095 |
0.451 |
2.743 |
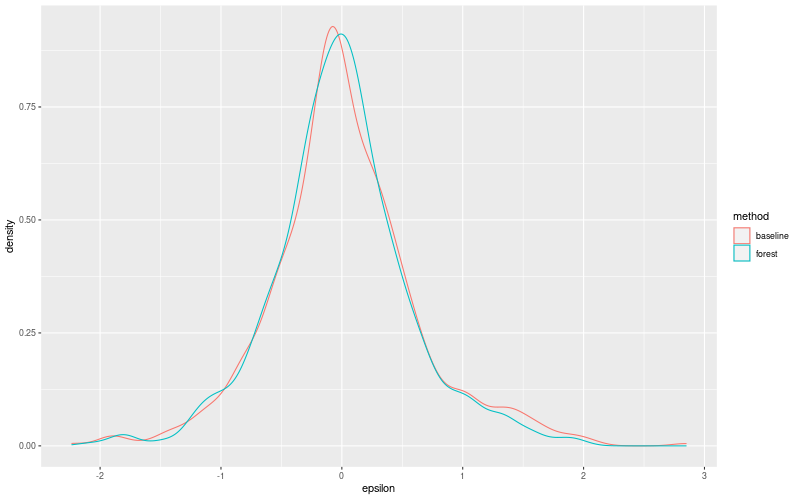
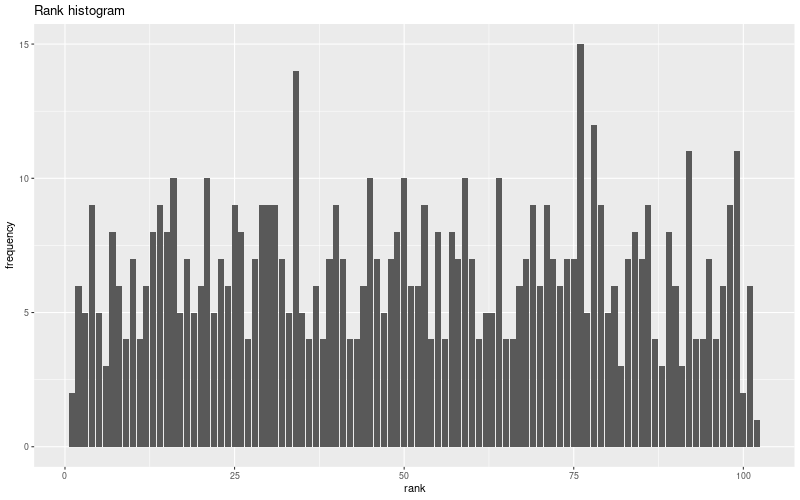
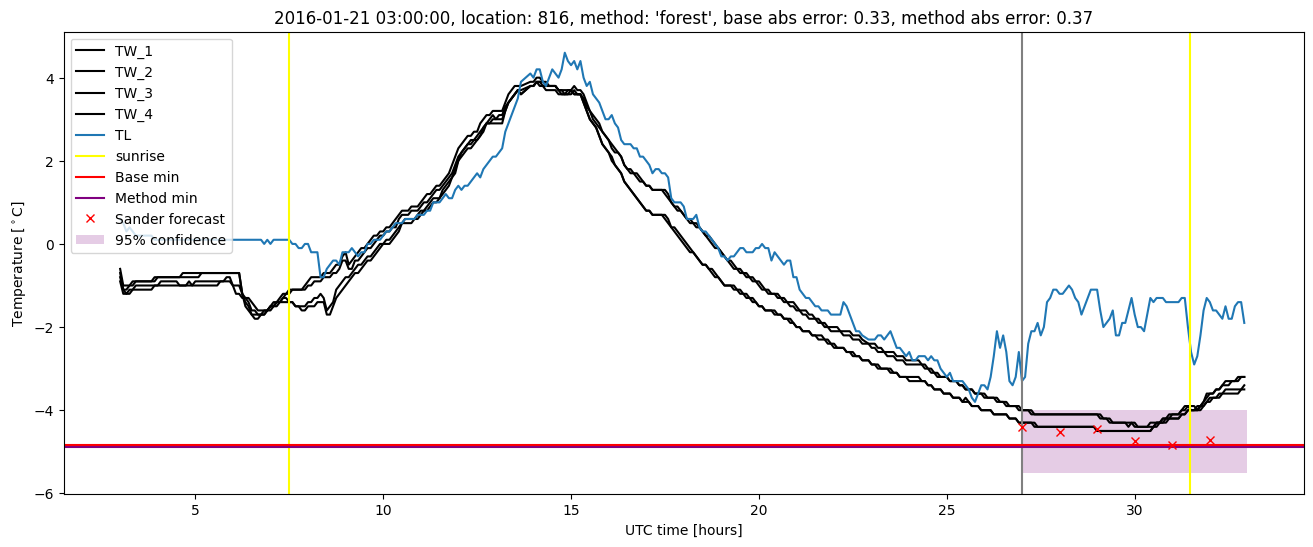
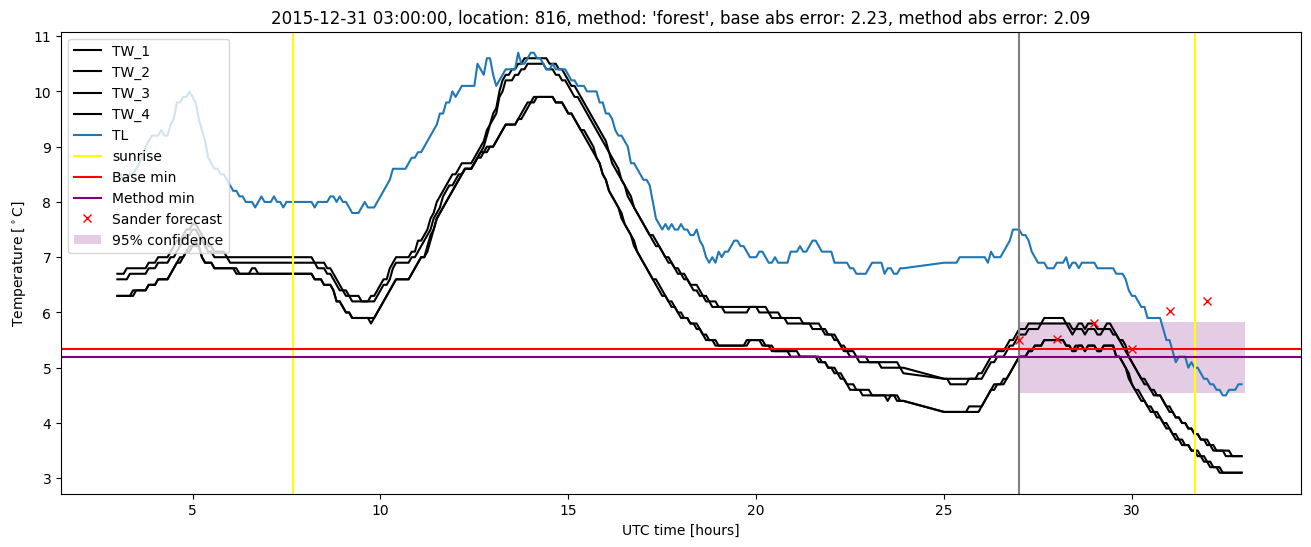
Random forest plots
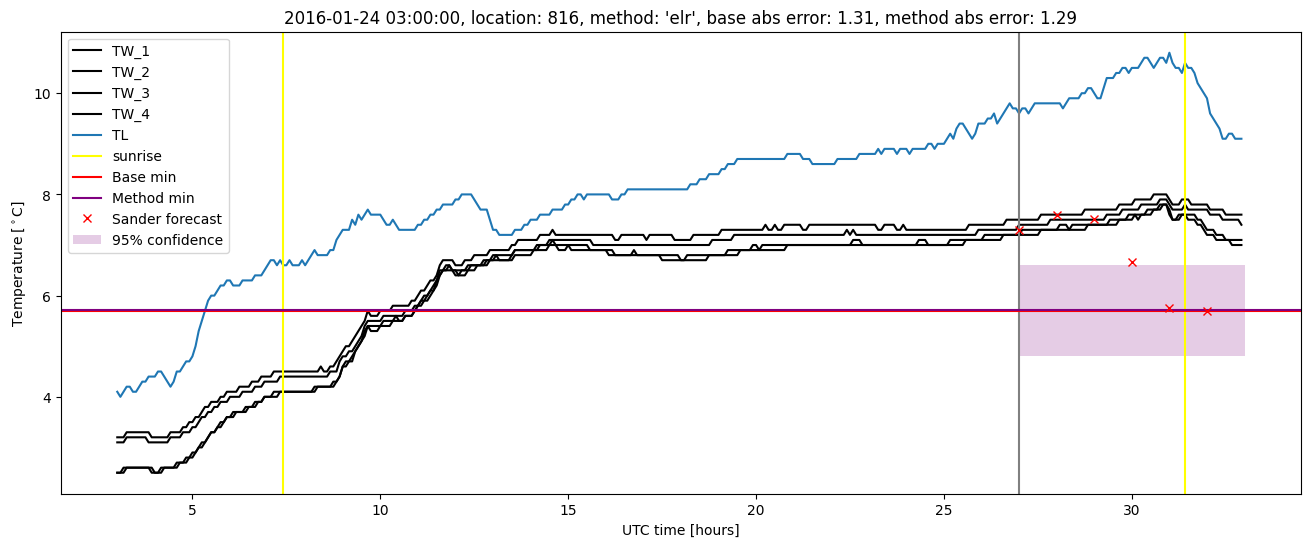
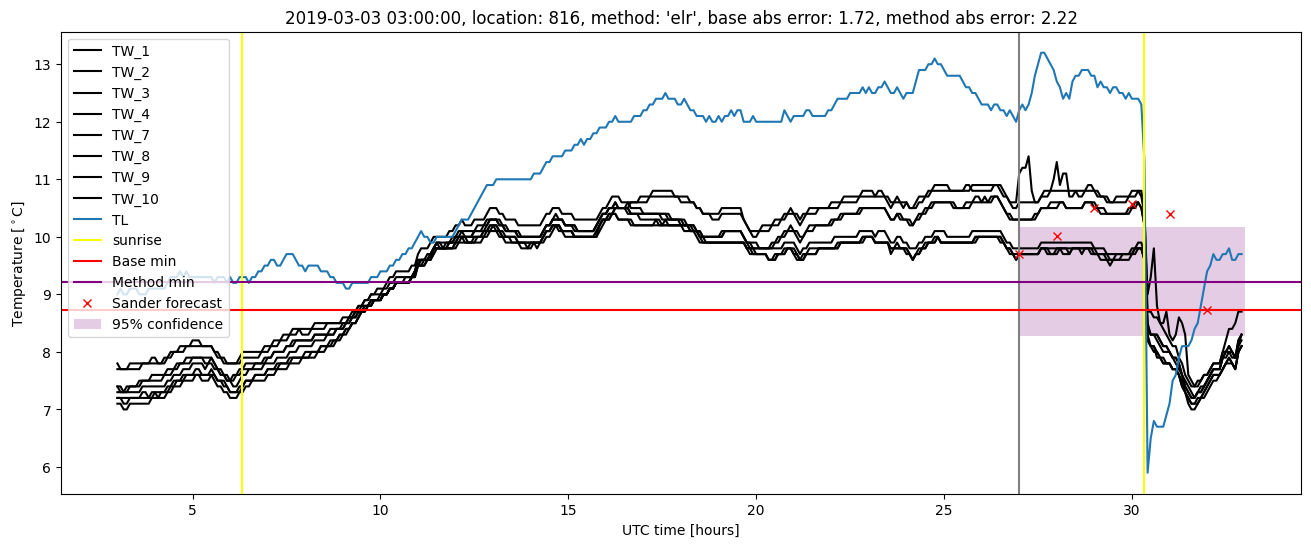
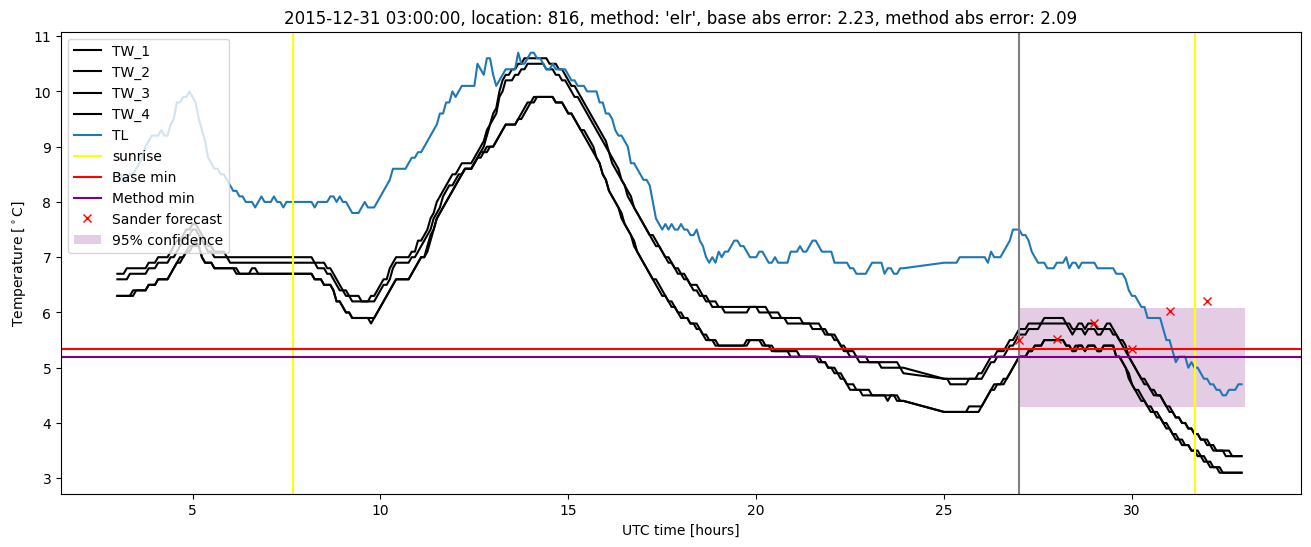
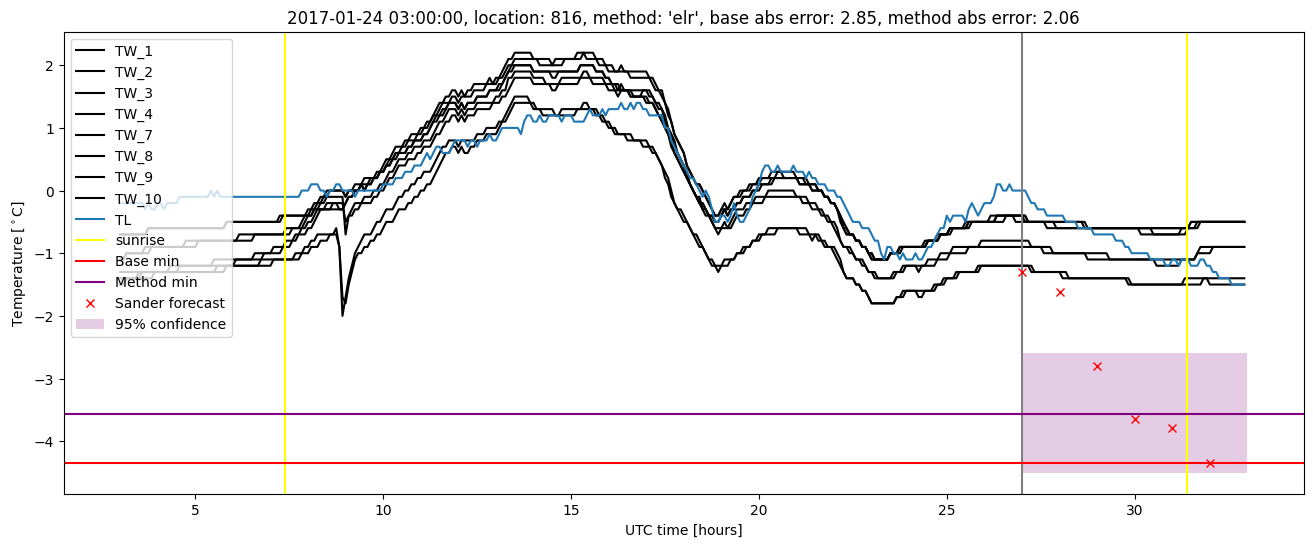
Extended logistic regression results
| names |
period |
power |
significance |
meanSquareError |
absError |
maxError |
CRPS |
IGN |
| baseline |
winter 2016 |
0.984 |
0.118 |
0.451 |
0.495 |
2.234 |
NaN |
NaN |
| elr |
winter 2016 |
0.984 |
0.059 |
0.412 |
0.487 |
2.088 |
0.539 |
4.015 |
| baseline |
winter 2017 |
0.991 |
0.056 |
0.274 |
0.363 |
2.848 |
NaN |
NaN |
| elr |
winter 2017 |
0.983 |
0.083 |
0.234 |
0.371 |
2.059 |
0.531 |
3.173 |
| baseline |
winter 2018 |
0.987 |
0.042 |
0.418 |
0.481 |
2.069 |
NaN |
NaN |
| elr |
winter 2018 |
0.987 |
0.042 |
0.350 |
0.451 |
1.947 |
0.494 |
3.219 |
| baseline |
winter 2019 |
0.984 |
0.048 |
0.364 |
0.431 |
1.940 |
NaN |
NaN |
| elr |
winter 2019 |
0.976 |
0.048 |
0.326 |
0.412 |
2.219 |
0.472 |
2.658 |
| baseline |
all |
0.986 |
0.061 |
0.384 |
0.448 |
2.848 |
NaN |
NaN |
| elr |
all |
0.983 |
0.061 |
0.338 |
0.436 |
2.219 |
0.511 |
3.329 |
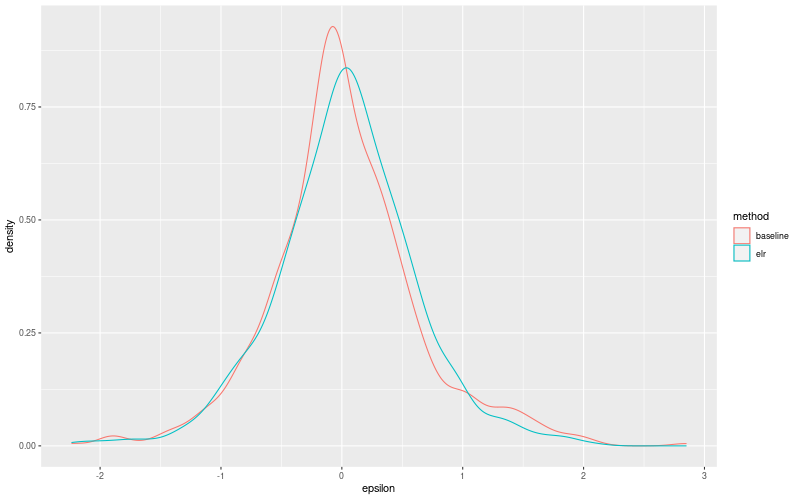
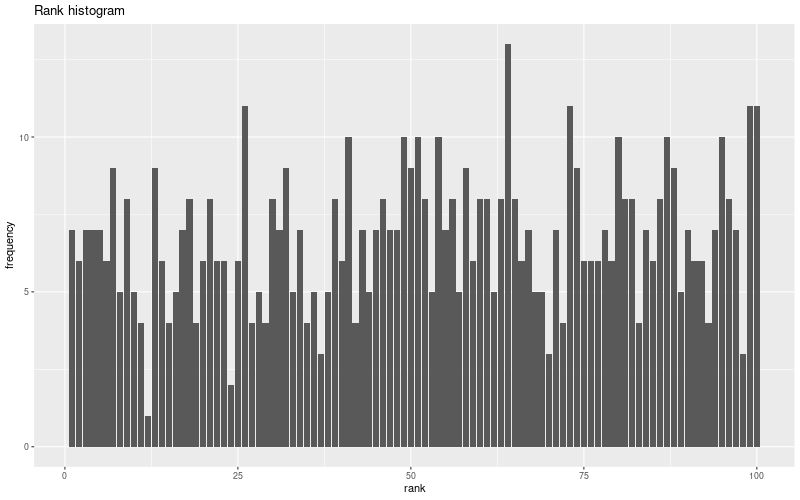
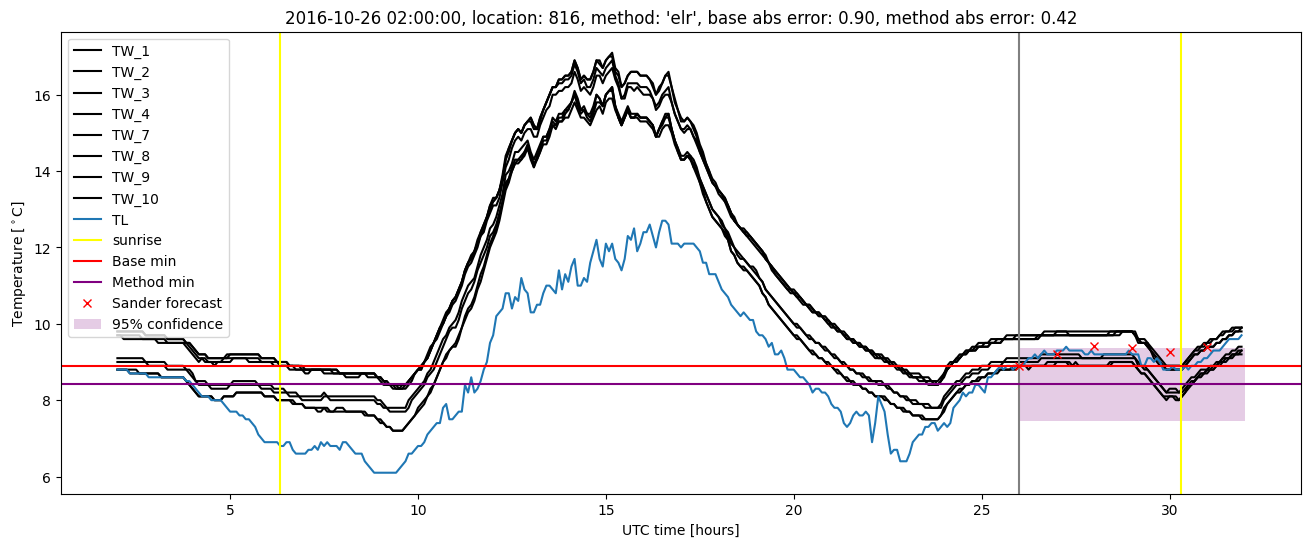
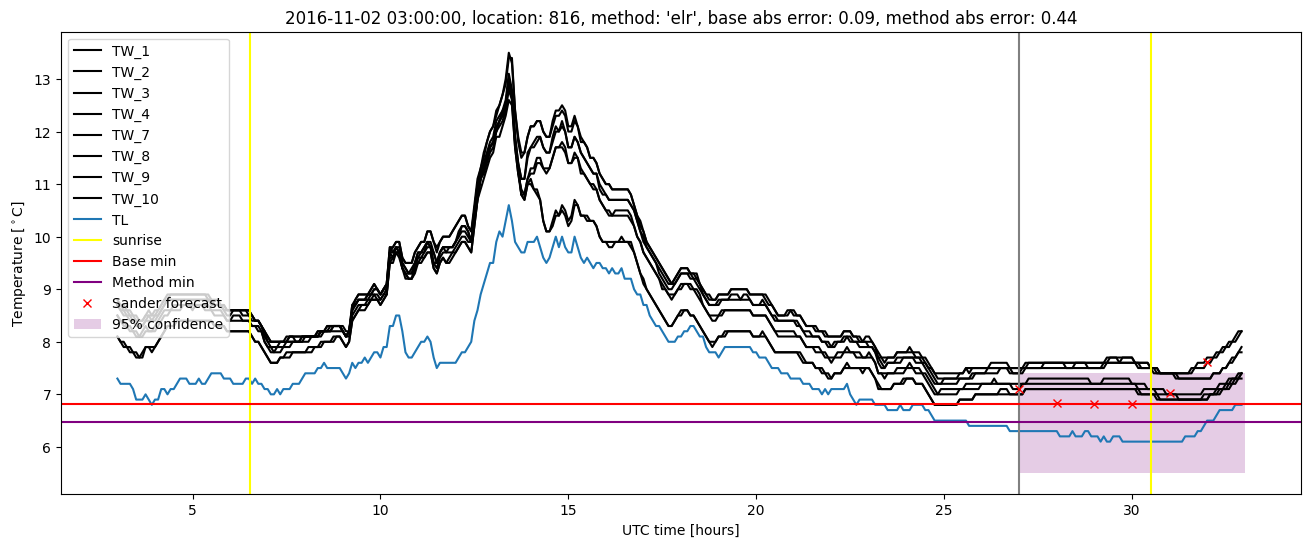
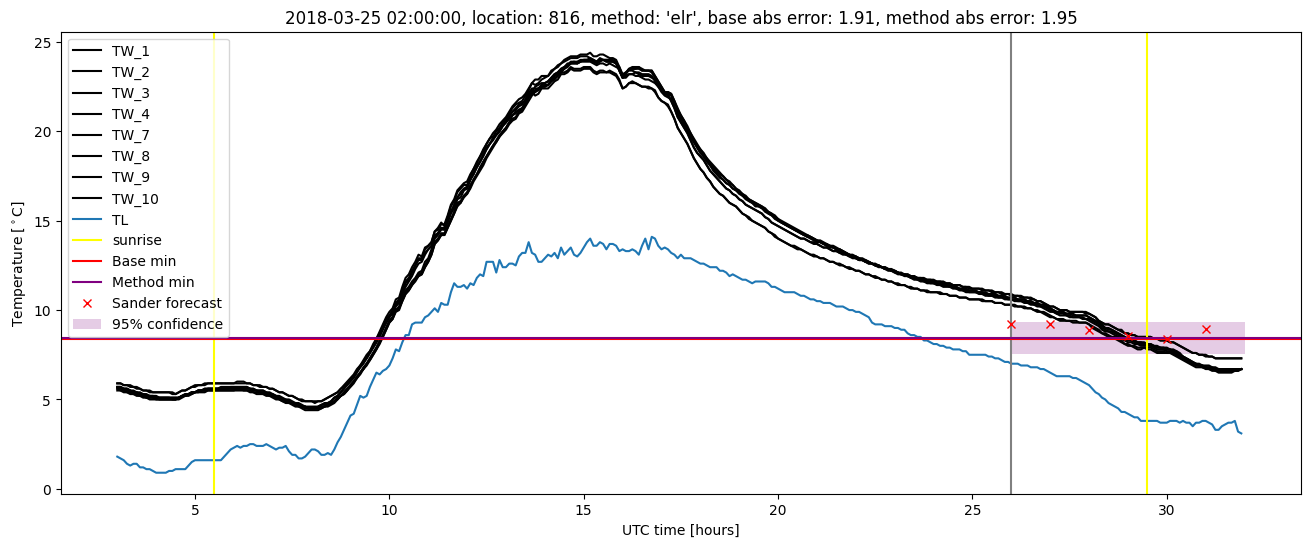
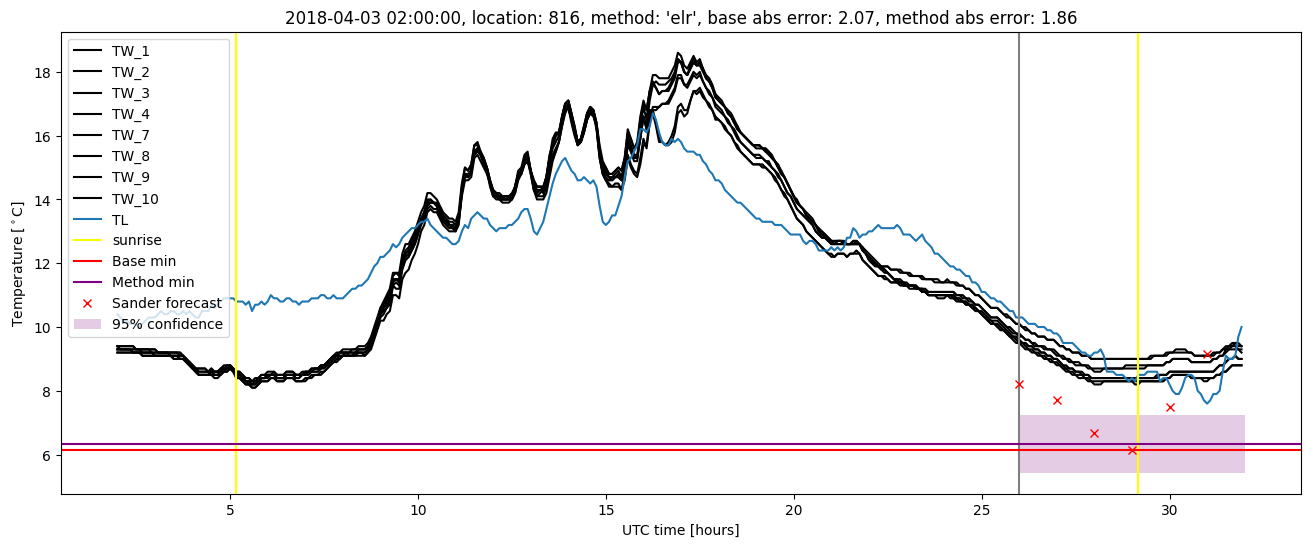
Extended logistic regression plots