GMS location: 815
Random forest results
| names |
period |
power |
significance |
meanSquareError |
absError |
maxError |
CRPS |
IGN |
| baseline |
winter 2016 |
0.975 |
0.105 |
0.480 |
0.504 |
3.099 |
NaN |
NaN |
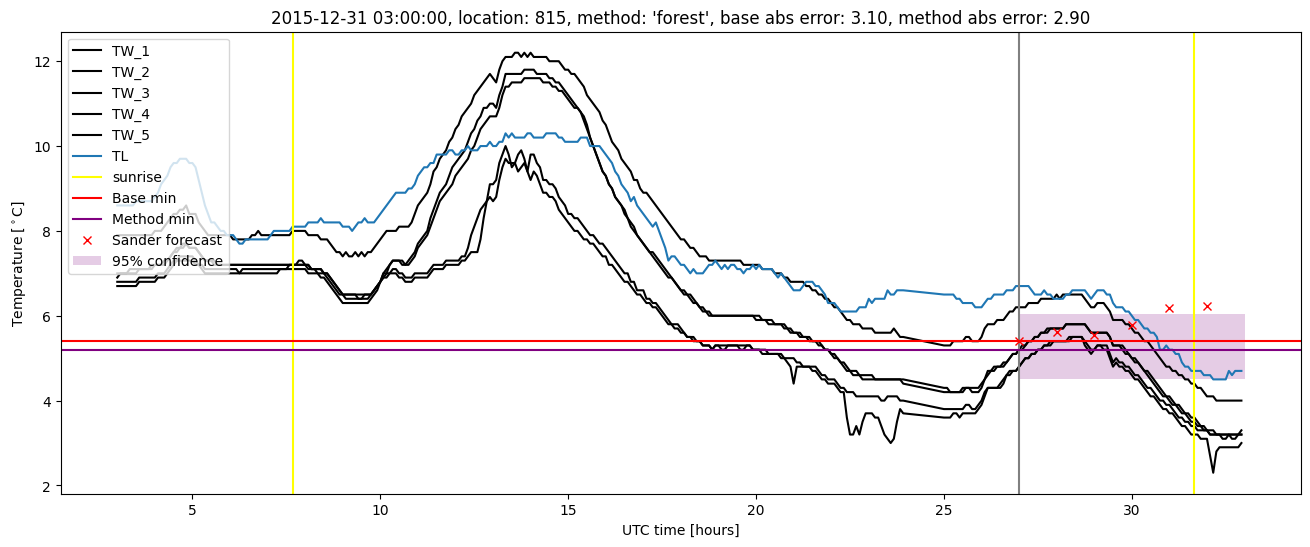
| forest |
winter 2016 |
0.992 |
0.053 |
0.425 |
0.461 |
2.896 |
0.464 |
3.401 |
| baseline |
winter 2017 |
0.983 |
0.135 |
0.362 |
0.435 |
2.365 |
NaN |
NaN |
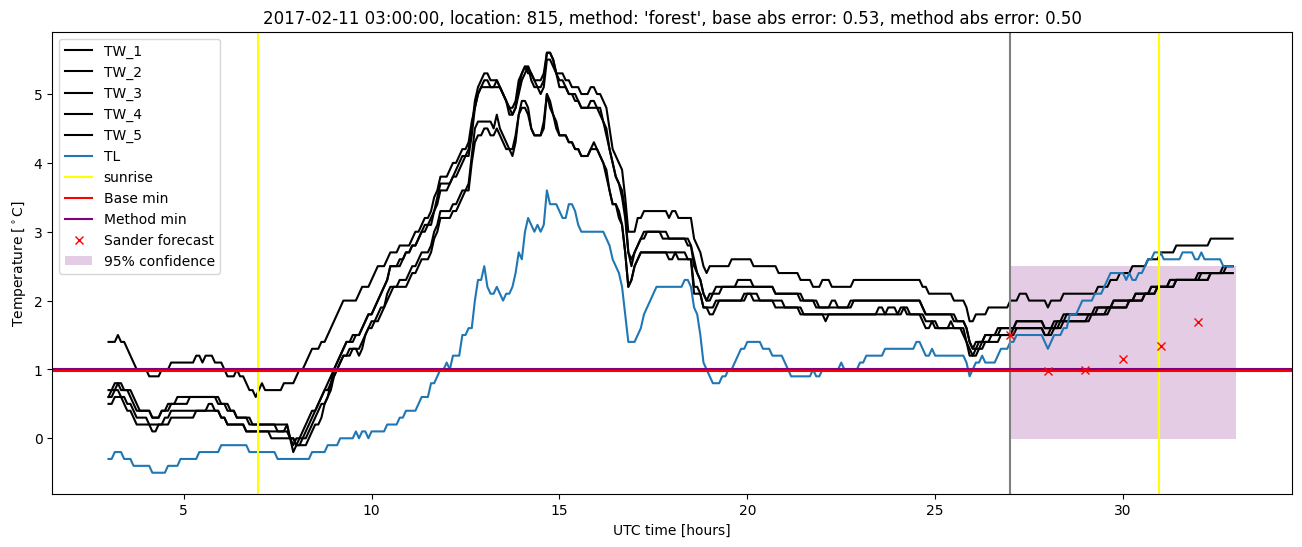
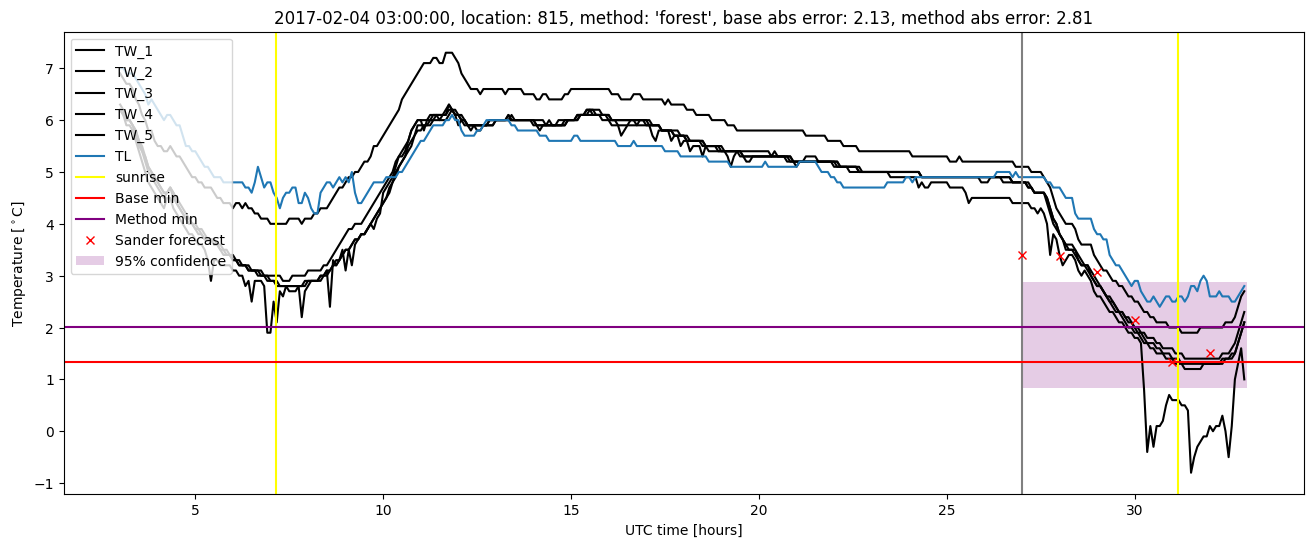
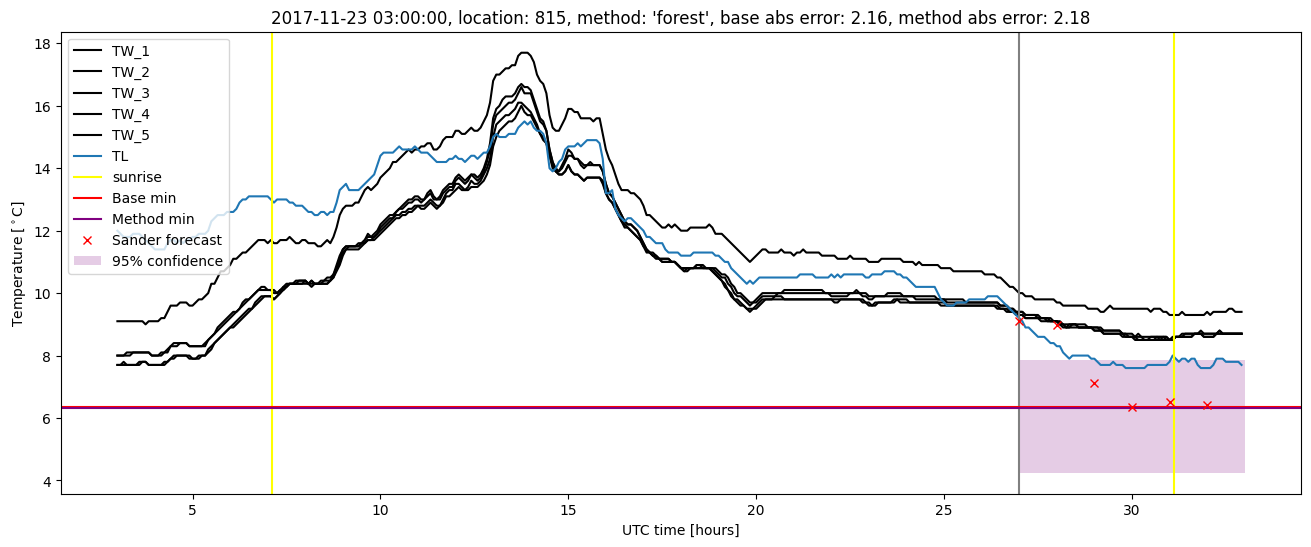
| forest |
winter 2017 |
0.974 |
0.135 |
0.316 |
0.393 |
2.811 |
0.466 |
2.595 |
| baseline |
winter 2018 |
0.987 |
0.040 |
0.387 |
0.451 |
2.156 |
NaN |
NaN |
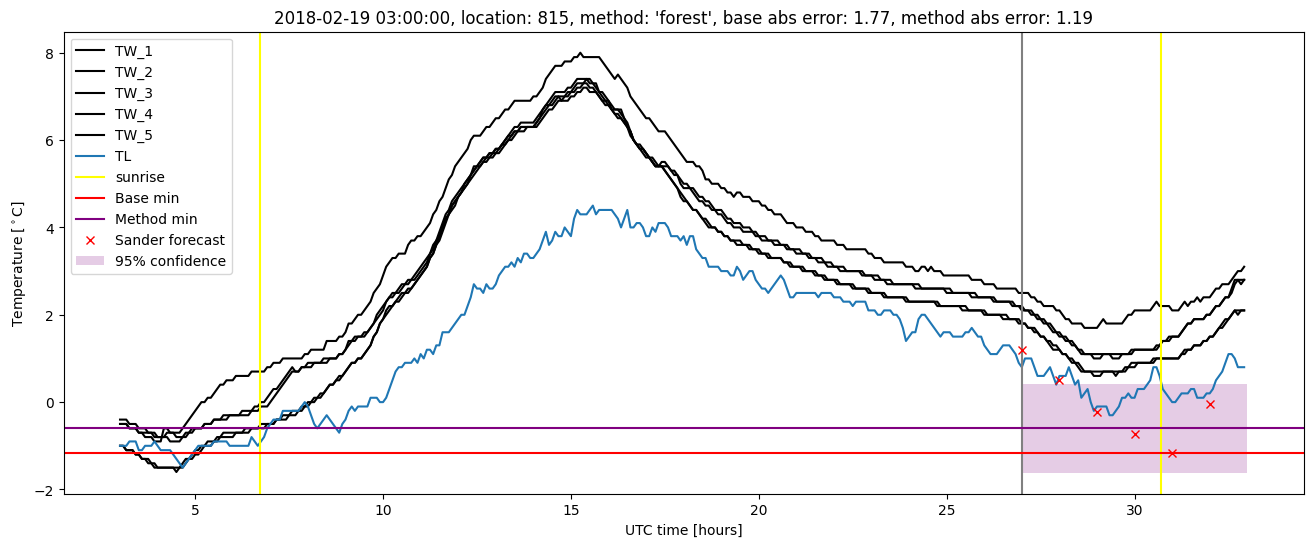
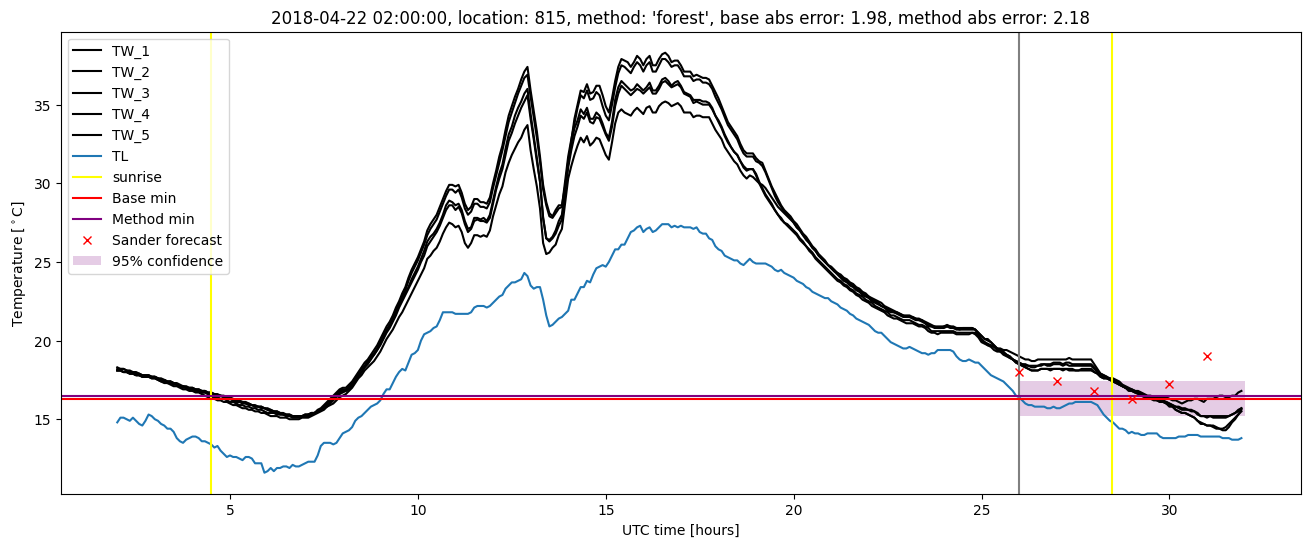
| forest |
winter 2018 |
0.987 |
0.080 |
0.332 |
0.412 |
2.179 |
0.460 |
2.189 |
| baseline |
winter 2019 |
0.986 |
0.056 |
0.314 |
0.400 |
2.096 |
NaN |
NaN |
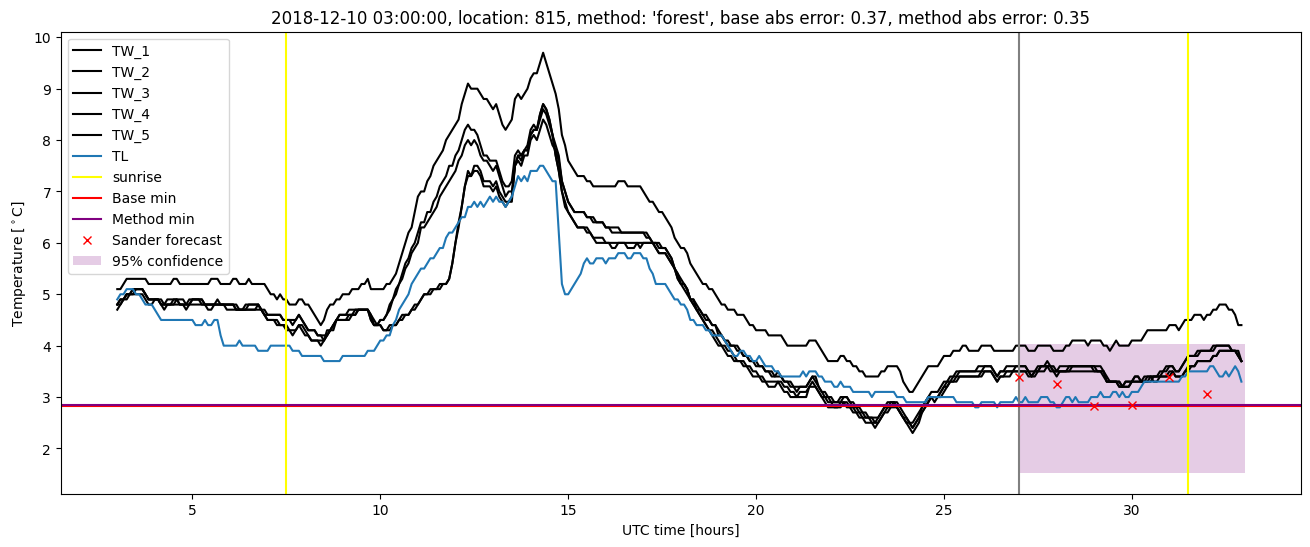
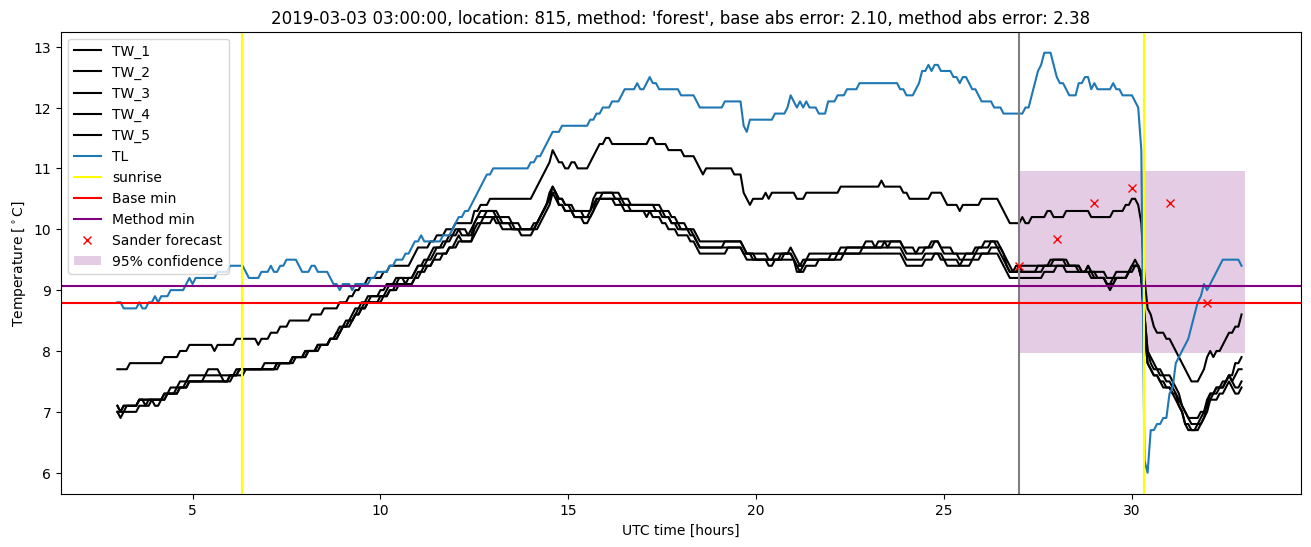
| forest |
winter 2019 |
0.986 |
0.111 |
0.255 |
0.354 |
2.376 |
0.437 |
1.824 |
| baseline |
all |
0.983 |
0.091 |
0.383 |
0.446 |
3.099 |
NaN |
NaN |
| forest |
all |
0.985 |
0.101 |
0.329 |
0.404 |
2.896 |
0.456 |
2.466 |
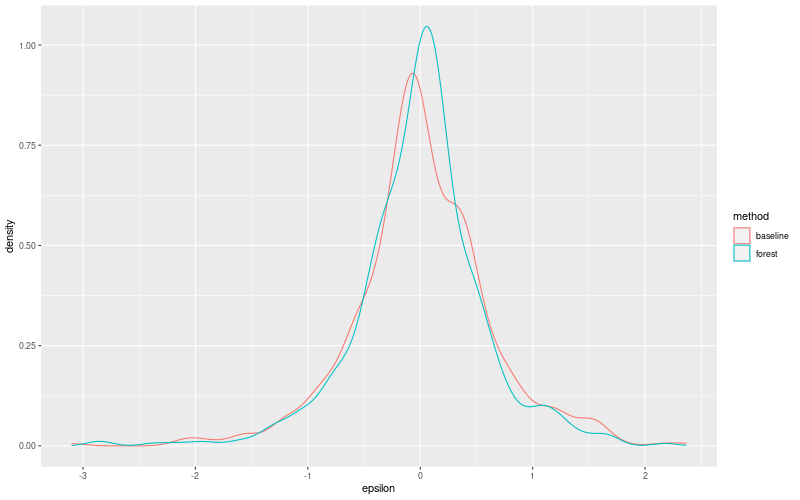
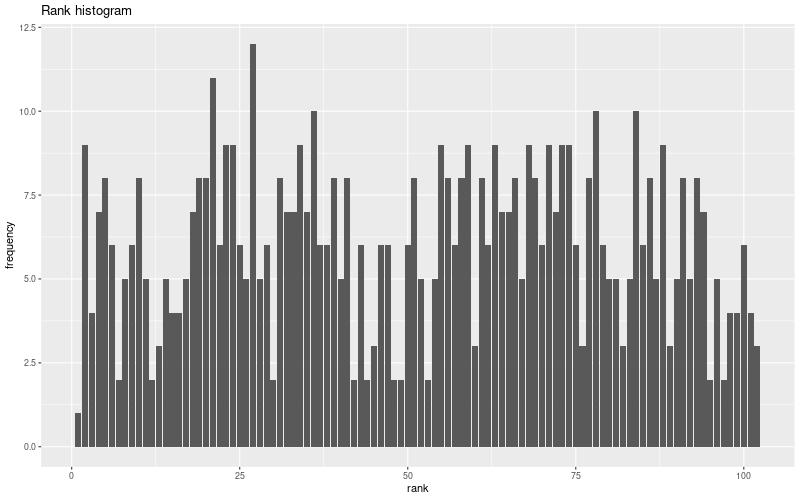
Random forest plots
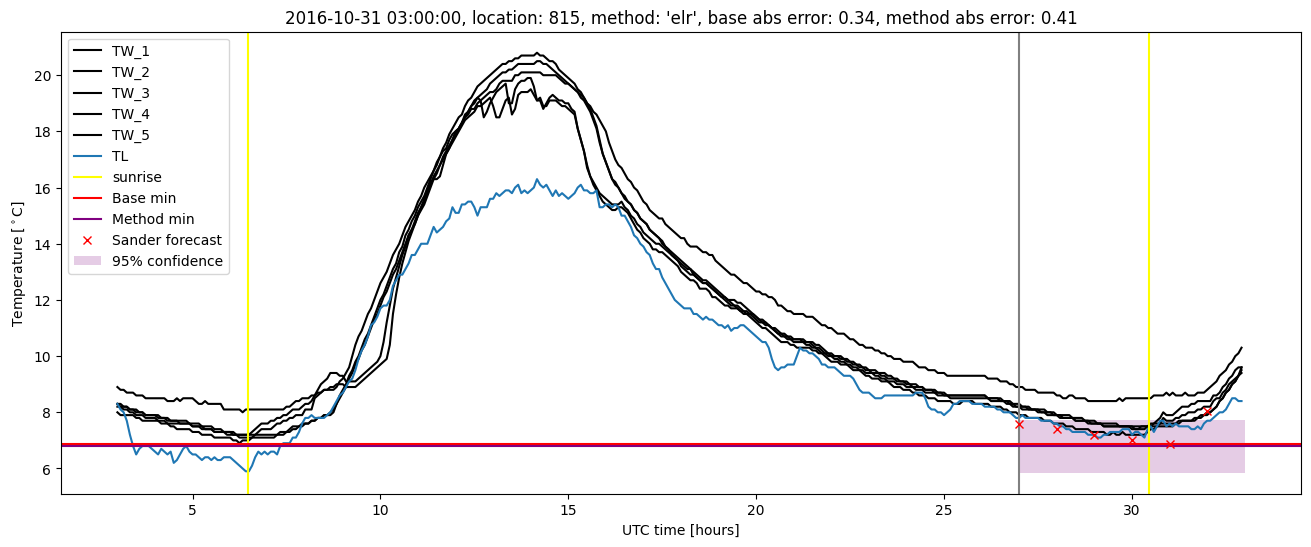
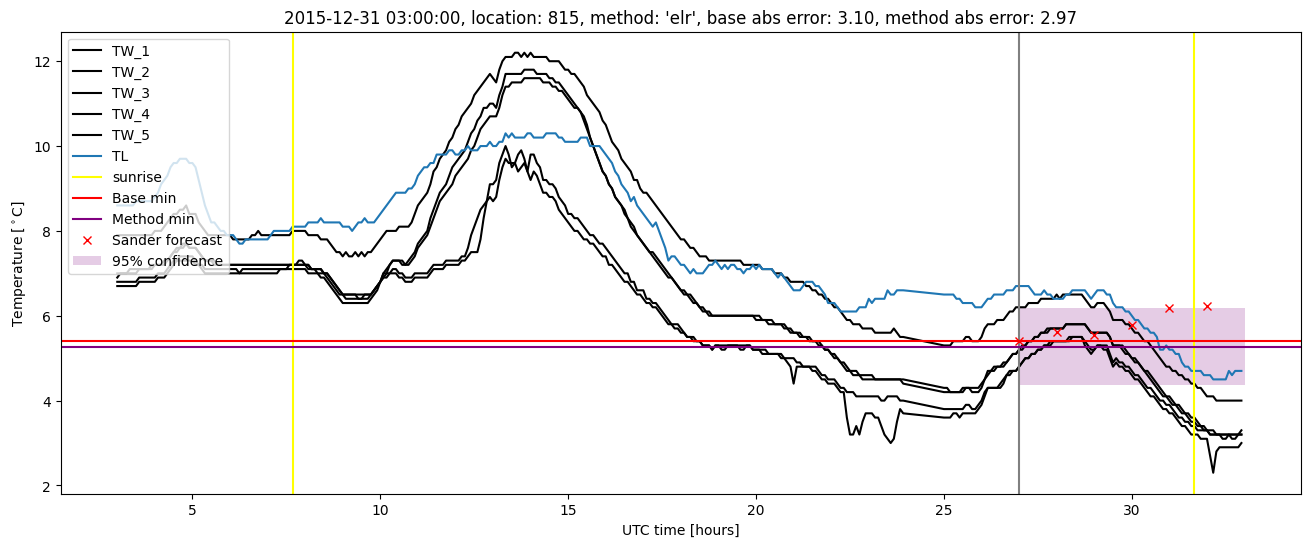
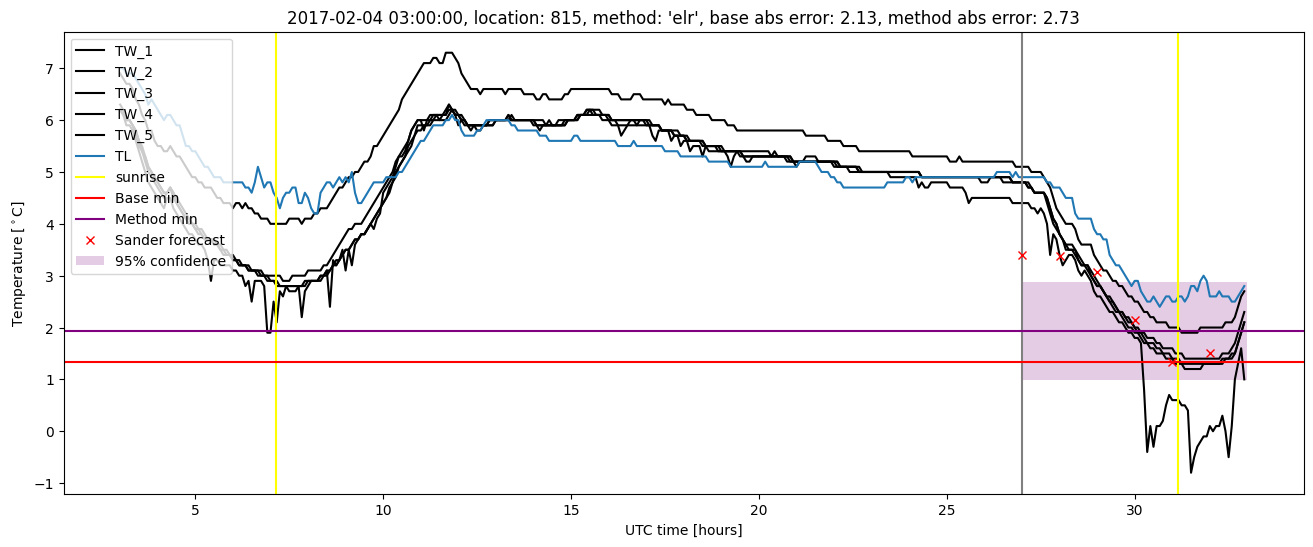
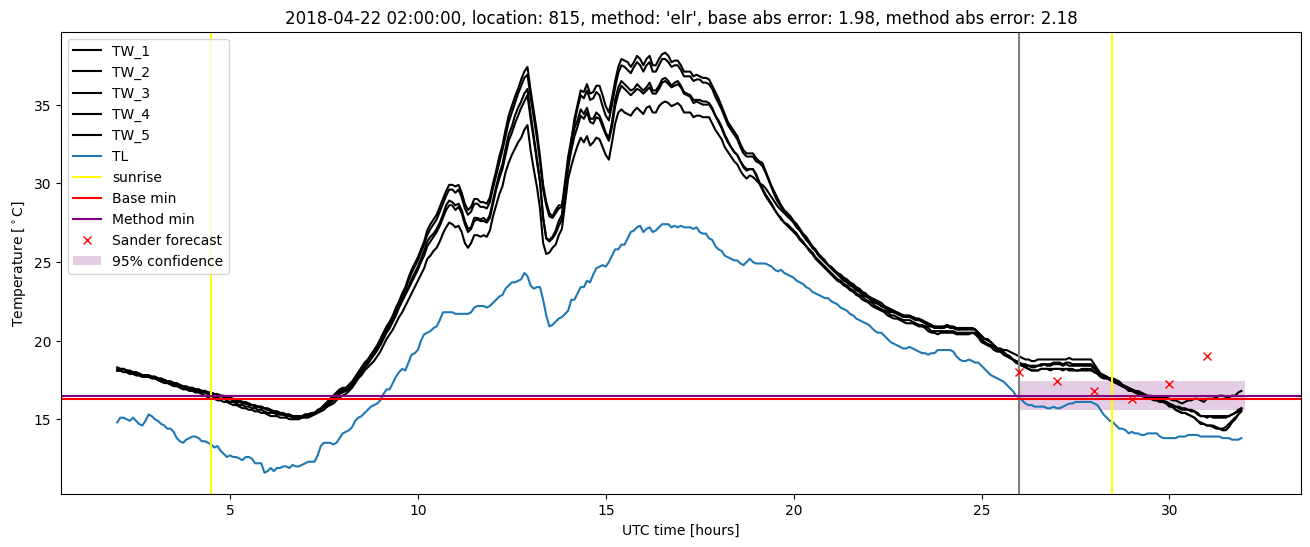
Extended logistic regression results
| names |
period |
power |
significance |
meanSquareError |
absError |
maxError |
CRPS |
IGN |
| baseline |
winter 2016 |
0.975 |
0.105 |
0.480 |
0.504 |
3.099 |
NaN |
NaN |
| elr |
winter 2016 |
0.983 |
0.053 |
0.422 |
0.467 |
2.971 |
0.522 |
3.726 |
| baseline |
winter 2017 |
0.983 |
0.135 |
0.362 |
0.435 |
2.365 |
NaN |
NaN |
| elr |
winter 2017 |
0.974 |
0.135 |
0.309 |
0.408 |
2.726 |
0.545 |
3.441 |
| baseline |
winter 2018 |
0.987 |
0.040 |
0.387 |
0.451 |
2.156 |
NaN |
NaN |
| elr |
winter 2018 |
0.987 |
0.080 |
0.332 |
0.443 |
2.181 |
0.519 |
3.436 |
| baseline |
winter 2019 |
0.986 |
0.056 |
0.314 |
0.400 |
2.096 |
NaN |
NaN |
| elr |
winter 2019 |
0.986 |
0.111 |
0.269 |
0.382 |
2.046 |
0.493 |
2.659 |
| baseline |
all |
0.983 |
0.091 |
0.383 |
0.446 |
3.099 |
NaN |
NaN |
| elr |
all |
0.983 |
0.101 |
0.330 |
0.424 |
2.971 |
0.520 |
3.305 |
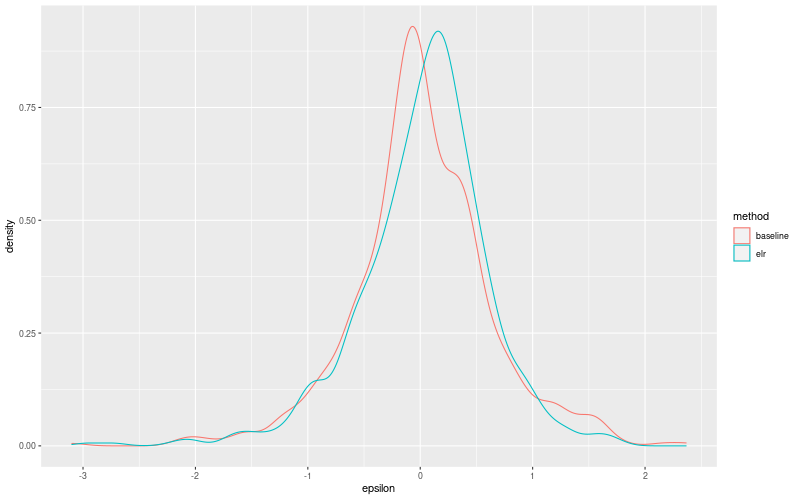
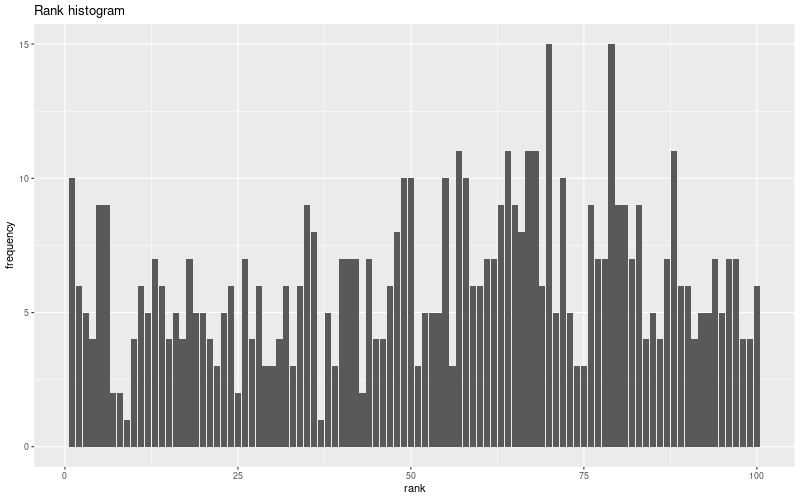
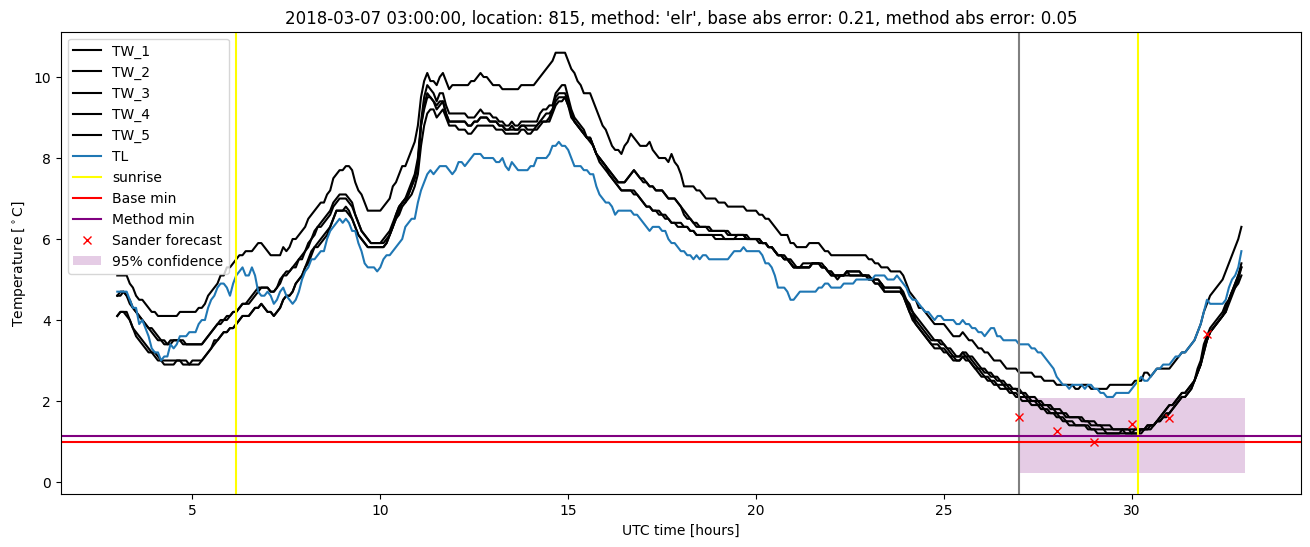
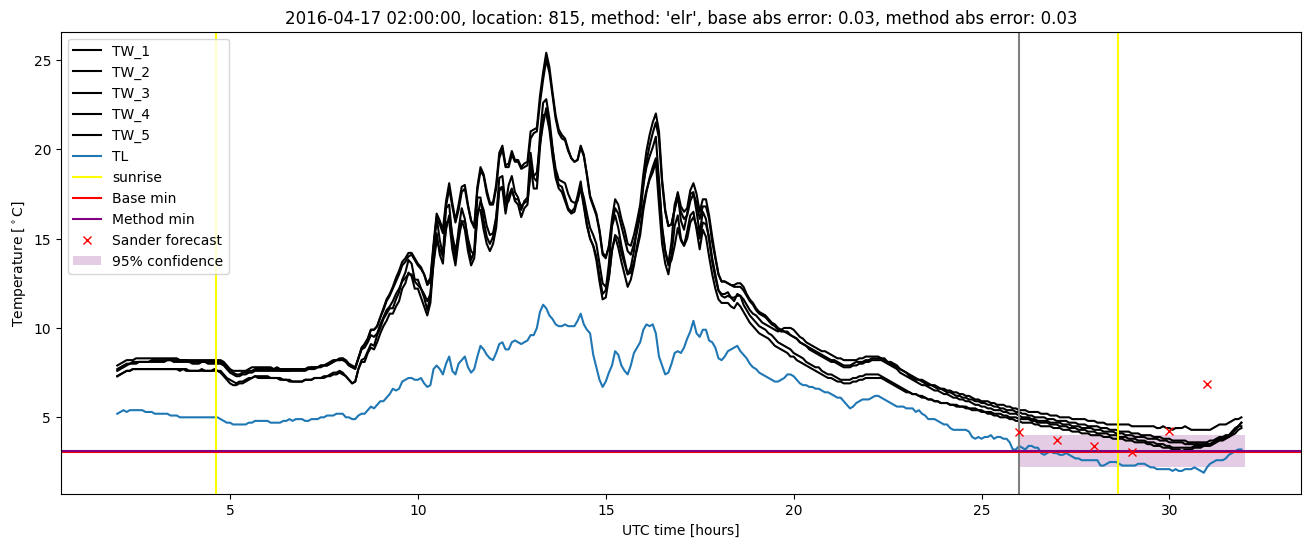
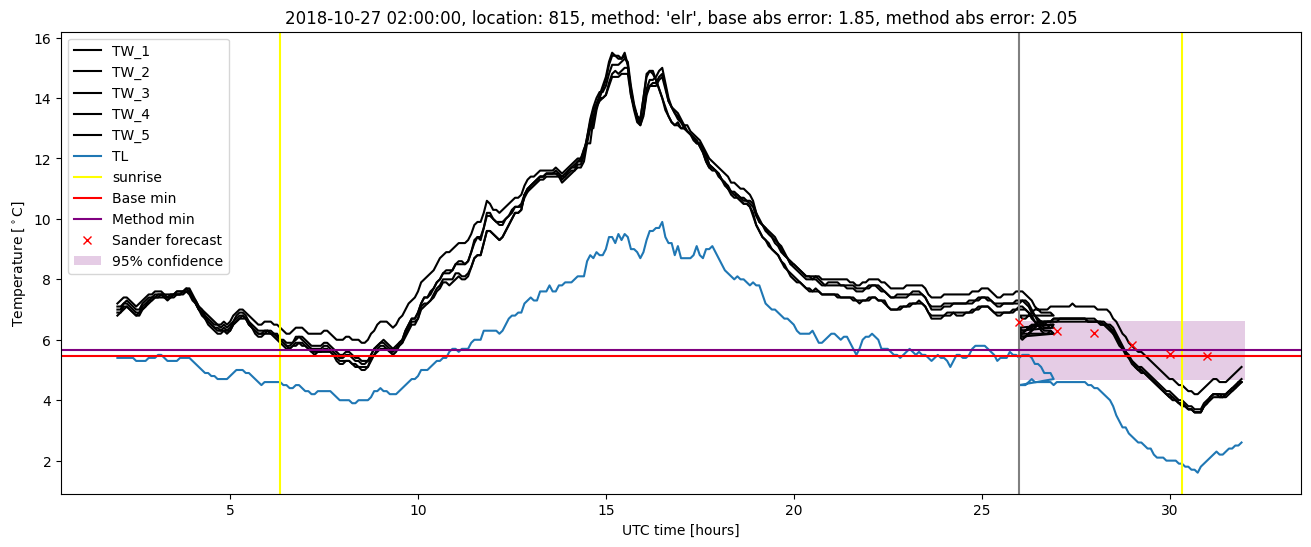
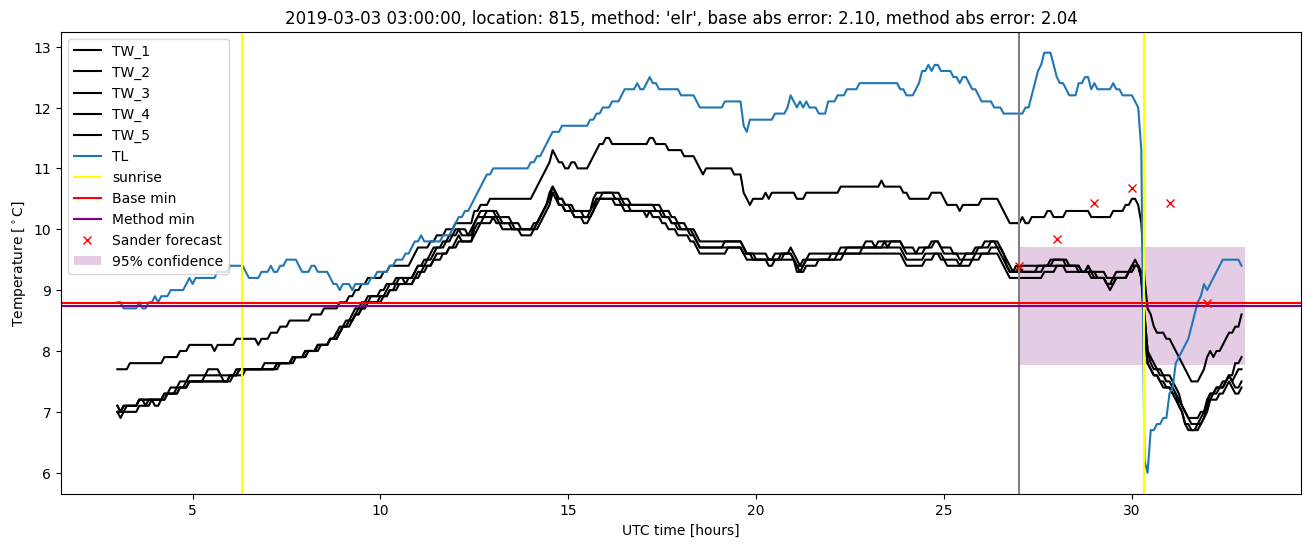
Extended logistic regression plots