GMS location: 812
Random forest results
| names |
period |
power |
significance |
meanSquareError |
absError |
maxError |
CRPS |
IGN |
| baseline |
winter 2016 |
0.976 |
0.048 |
0.404 |
0.461 |
2.722 |
NaN |
NaN |
| forest |
winter 2016 |
0.976 |
0.095 |
0.336 |
0.411 |
2.155 |
0.489 |
1.703 |
| baseline |
winter 2017 |
0.991 |
0.054 |
0.435 |
0.442 |
2.468 |
NaN |
NaN |
| forest |
winter 2017 |
0.982 |
0.054 |
0.332 |
0.413 |
2.015 |
0.481 |
1.842 |
| baseline |
winter 2018 |
0.986 |
0.103 |
1.108 |
0.644 |
5.513 |
NaN |
NaN |
| forest |
winter 2018 |
0.986 |
0.069 |
1.005 |
0.594 |
5.153 |
0.487 |
2.811 |
| baseline |
winter 2019 |
0.978 |
0.105 |
0.271 |
0.382 |
2.236 |
NaN |
NaN |
| forest |
winter 2019 |
0.985 |
0.053 |
0.344 |
0.416 |
2.327 |
0.521 |
1.746 |
| baseline |
all |
0.982 |
0.075 |
0.561 |
0.485 |
5.513 |
NaN |
NaN |
| forest |
all |
0.982 |
0.066 |
0.509 |
0.460 |
5.153 |
0.494 |
2.030 |
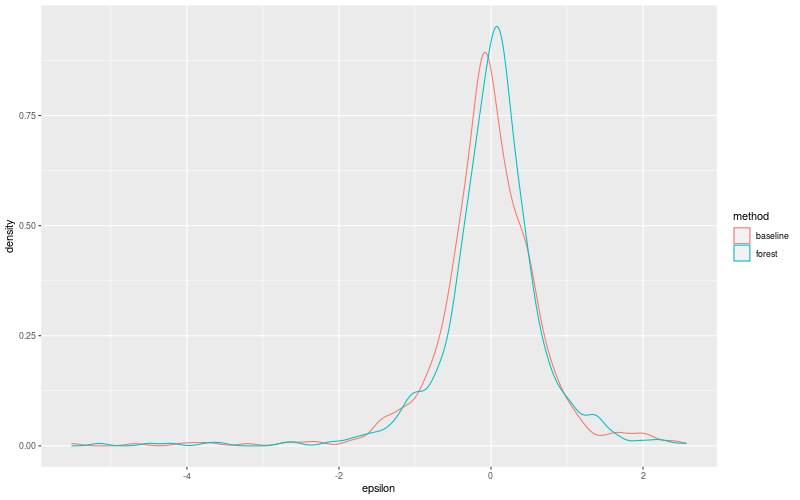
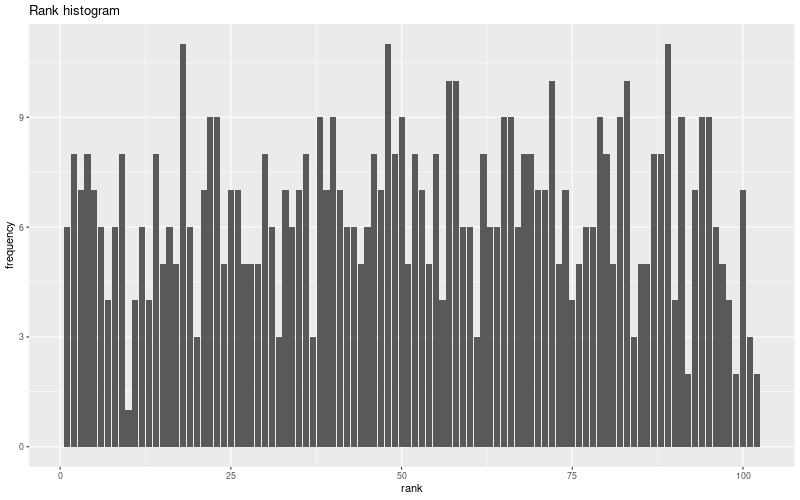
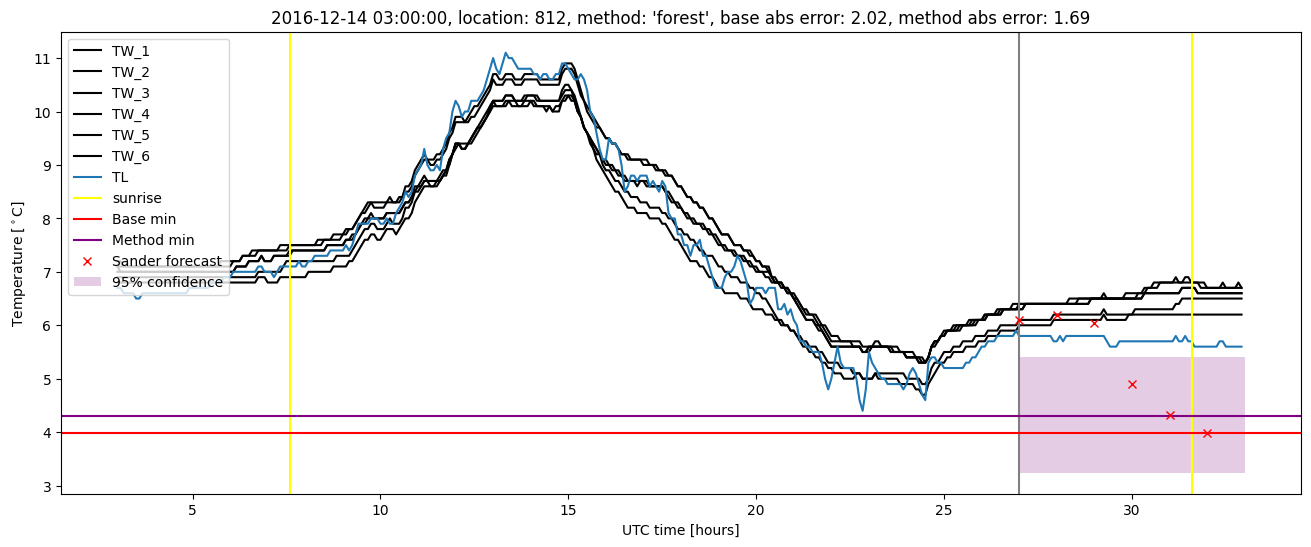
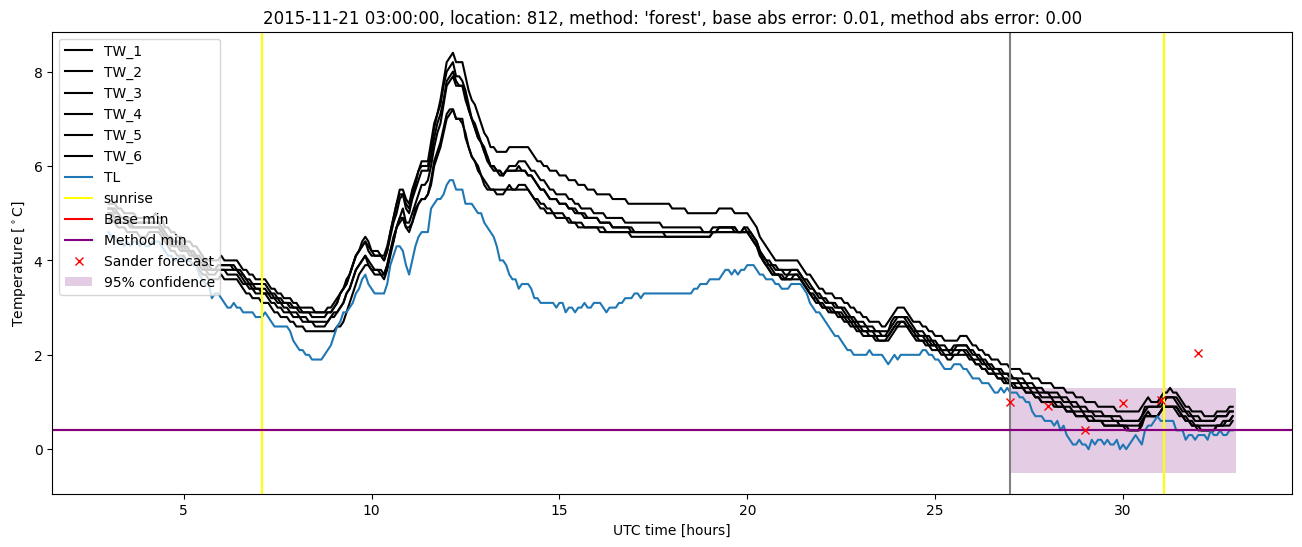
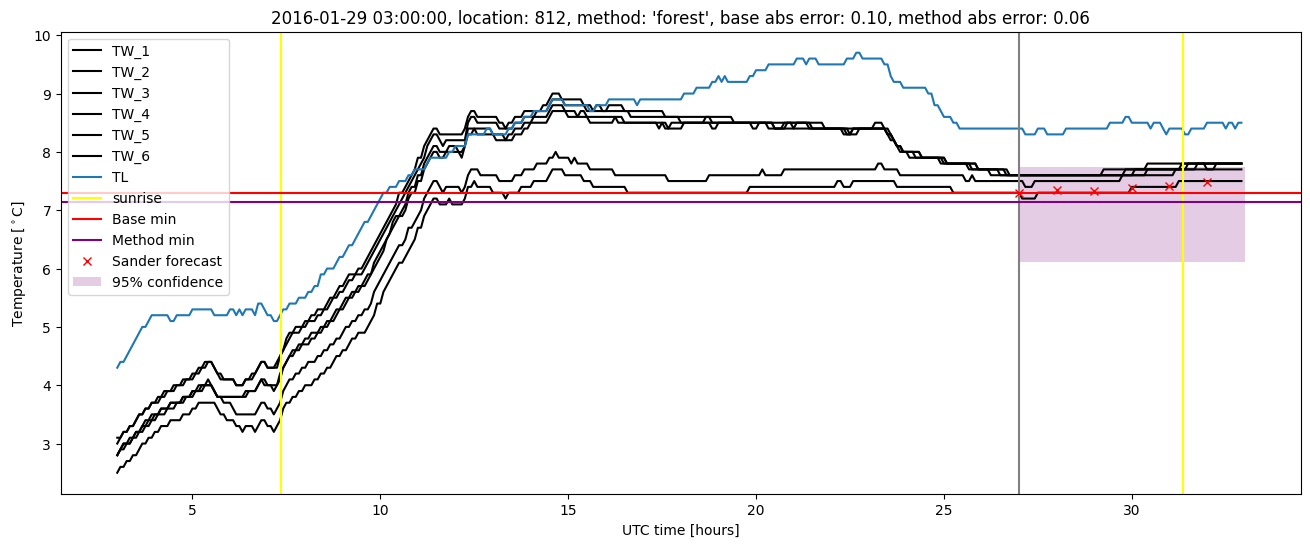
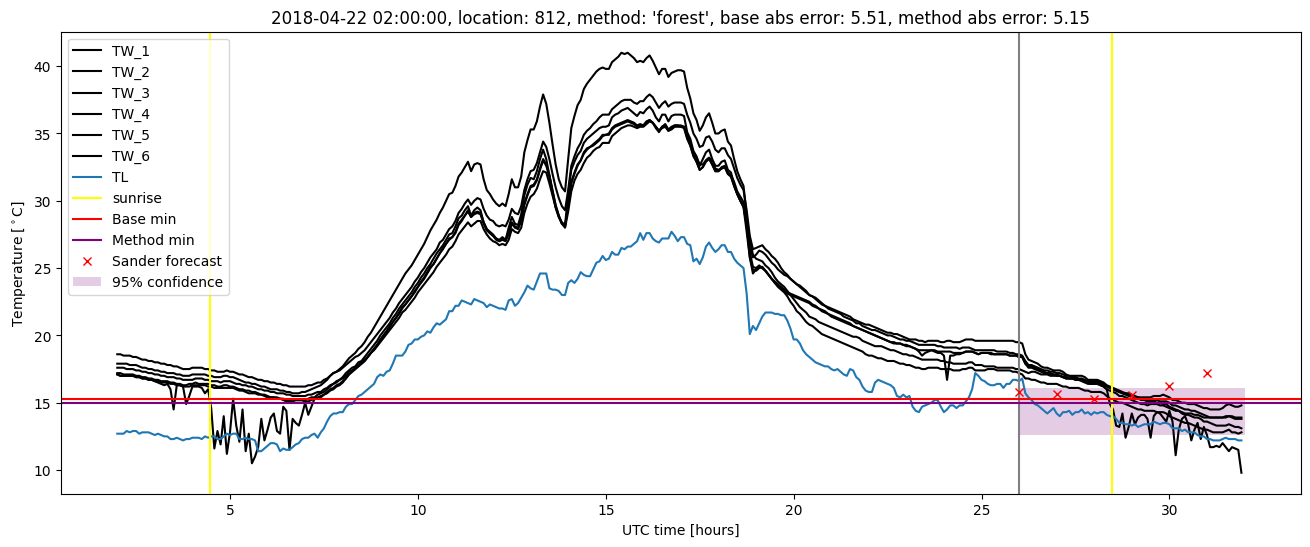
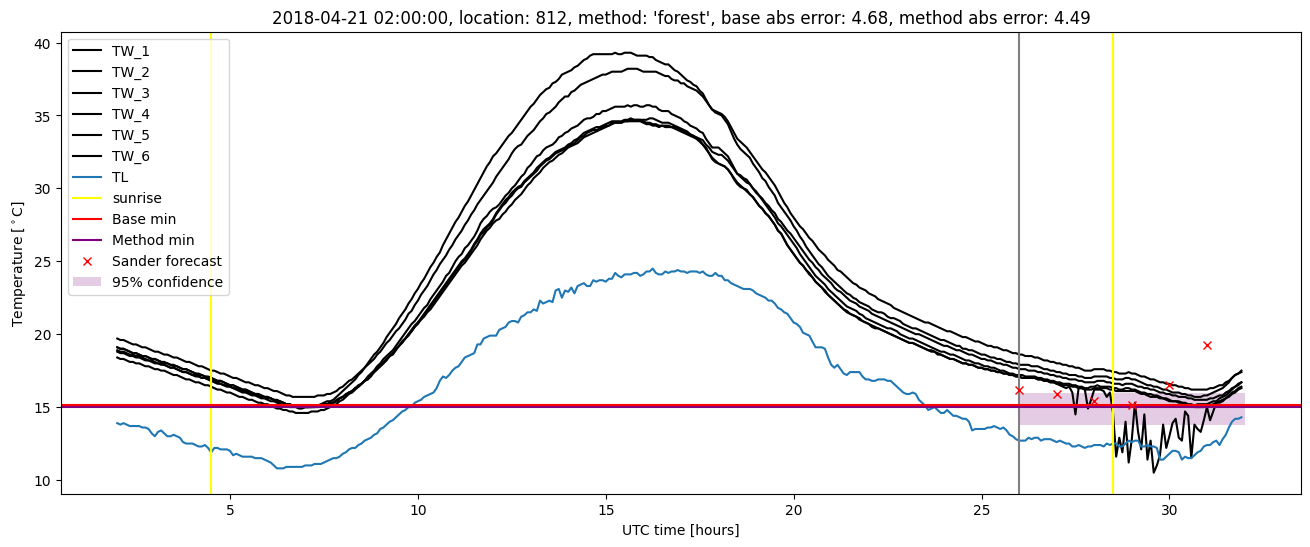
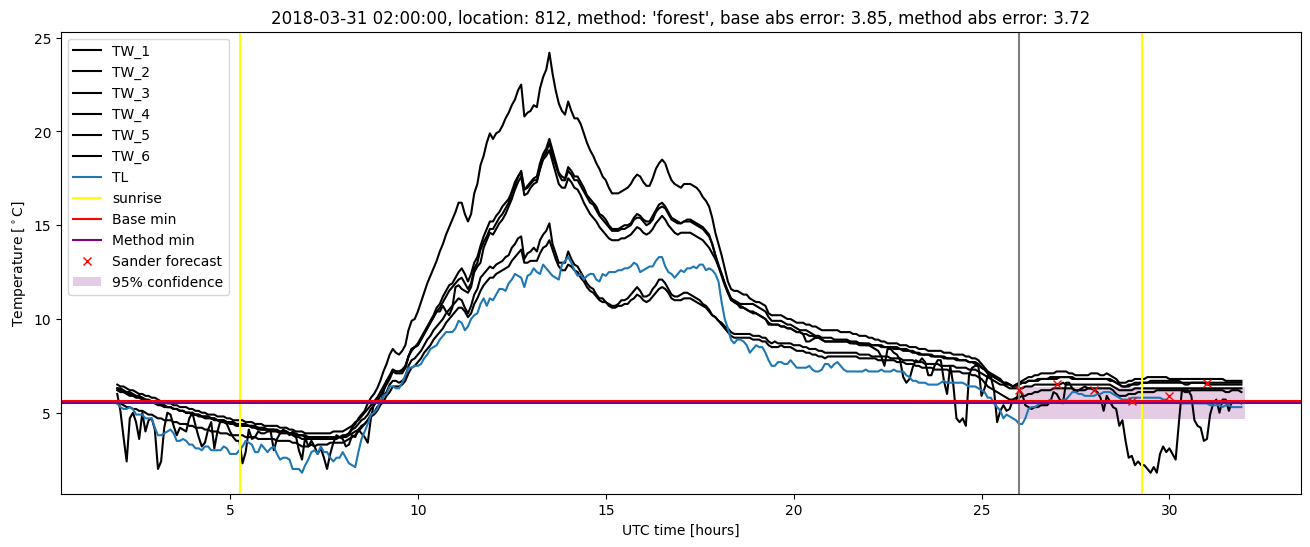
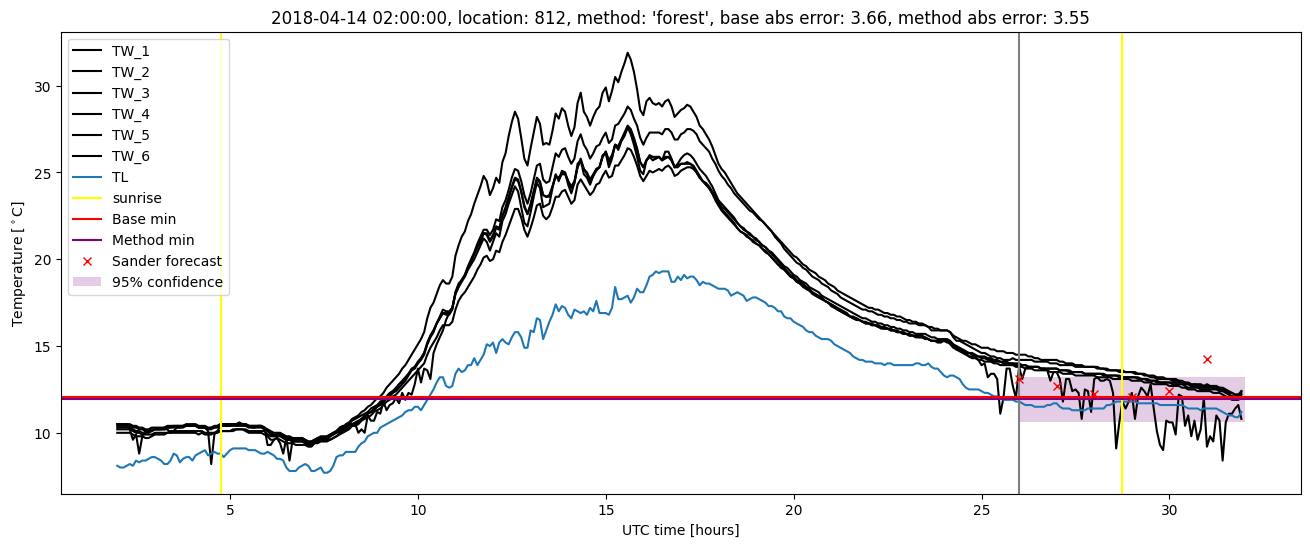
Random forest plots

Extended logistic regression results
| names |
period |
power |
significance |
meanSquareError |
absError |
maxError |
CRPS |
IGN |
| baseline |
winter 2016 |
0.976 |
0.048 |
0.404 |
0.461 |
2.722 |
NaN |
NaN |
| elr |
winter 2016 |
0.958 |
0.095 |
0.355 |
0.454 |
2.173 |
0.560 |
1.996 |
| baseline |
winter 2017 |
0.991 |
0.054 |
0.435 |
0.442 |
2.468 |
NaN |
NaN |
| elr |
winter 2017 |
0.982 |
0.135 |
0.345 |
0.435 |
1.988 |
0.529 |
1.880 |
| baseline |
winter 2018 |
0.986 |
0.103 |
1.108 |
0.644 |
5.513 |
NaN |
NaN |
| elr |
winter 2018 |
0.986 |
0.069 |
1.091 |
0.613 |
5.378 |
0.533 |
3.826 |
| baseline |
winter 2019 |
0.978 |
0.105 |
0.271 |
0.382 |
2.236 |
NaN |
NaN |
| elr |
winter 2019 |
0.978 |
0.053 |
0.234 |
0.384 |
1.128 |
0.508 |
1.651 |
| baseline |
all |
0.982 |
0.075 |
0.561 |
0.485 |
5.513 |
NaN |
NaN |
| elr |
all |
0.975 |
0.094 |
0.514 |
0.474 |
5.378 |
0.534 |
2.361 |
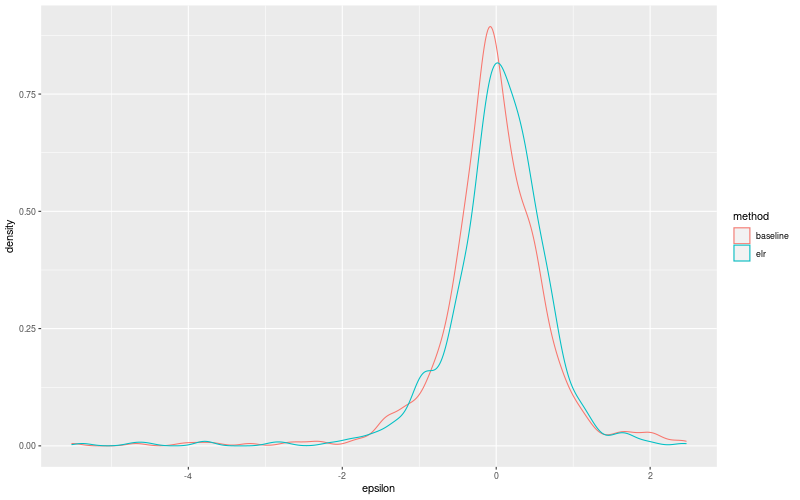
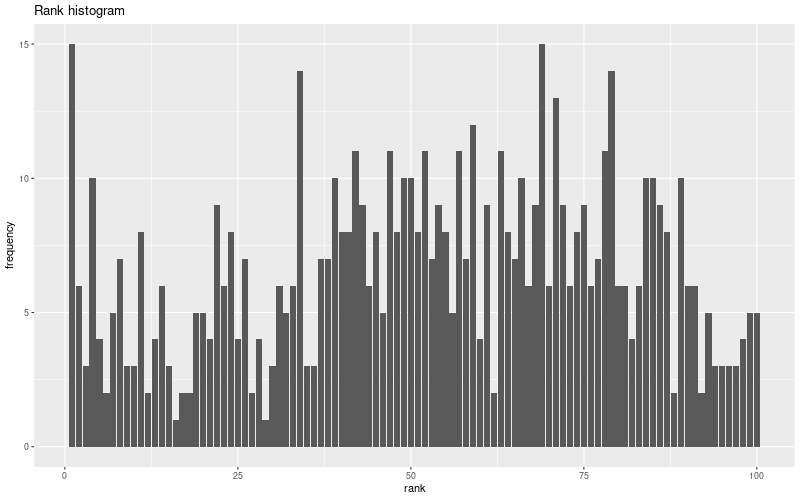
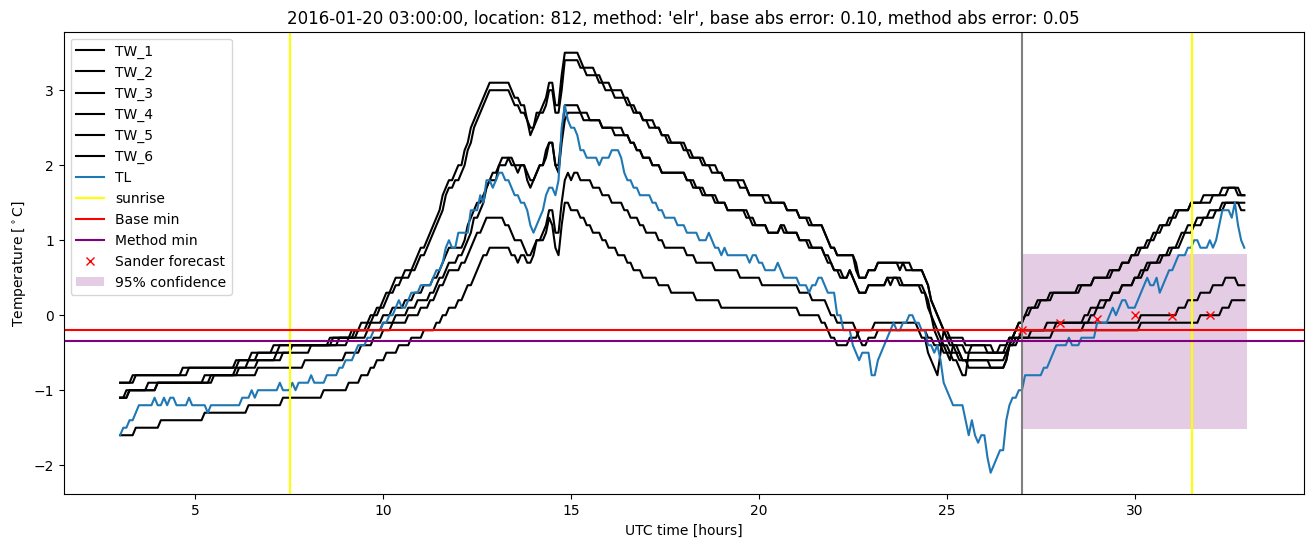
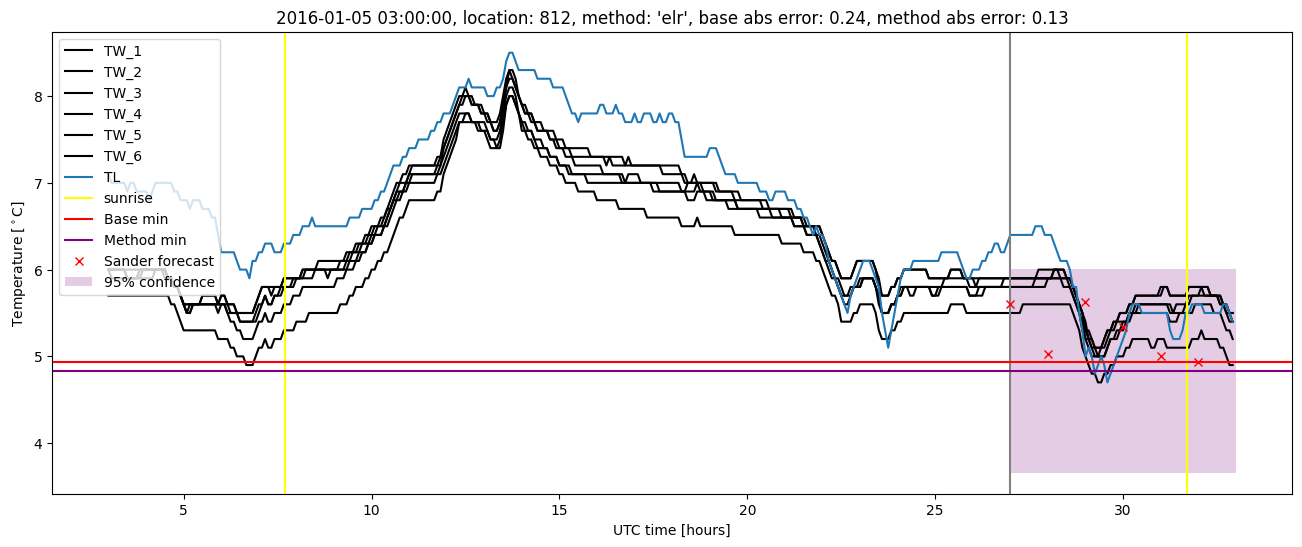
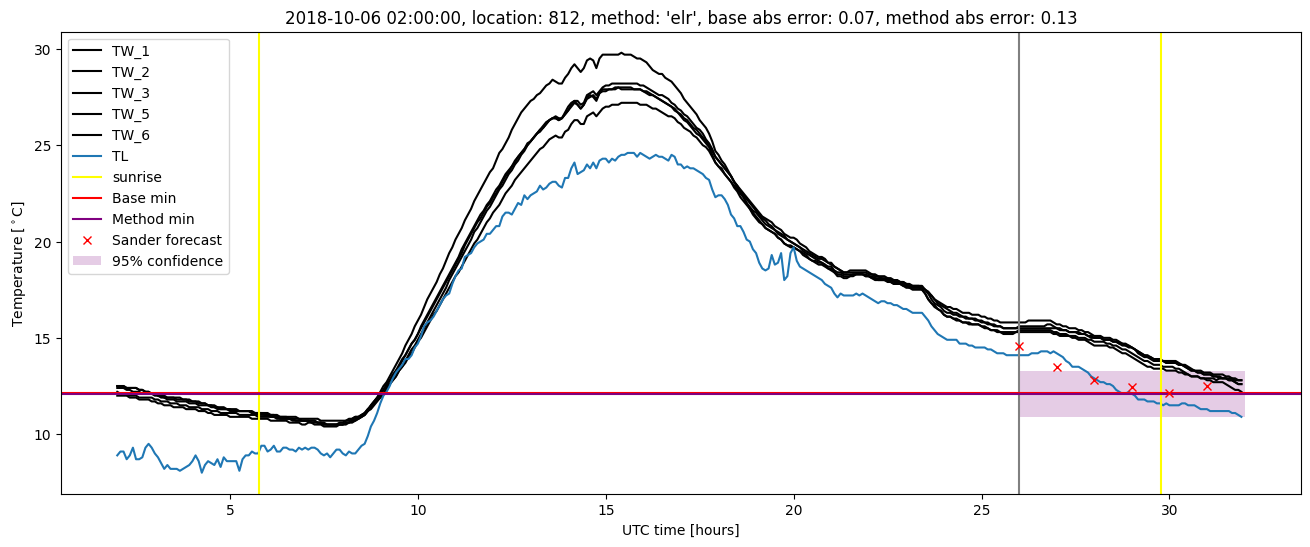
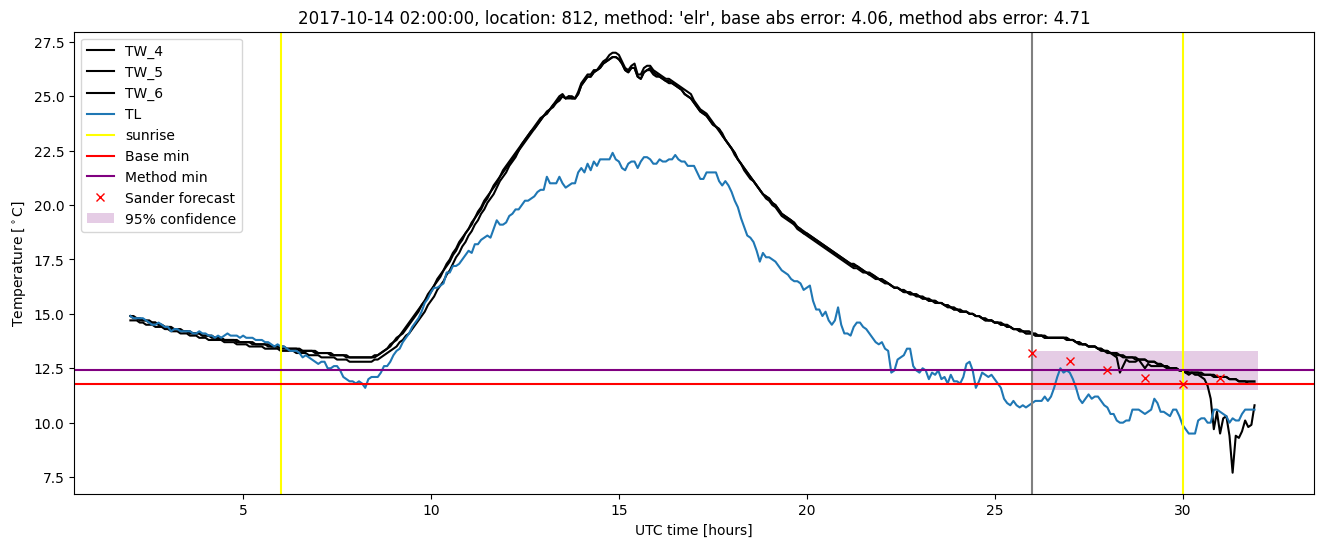
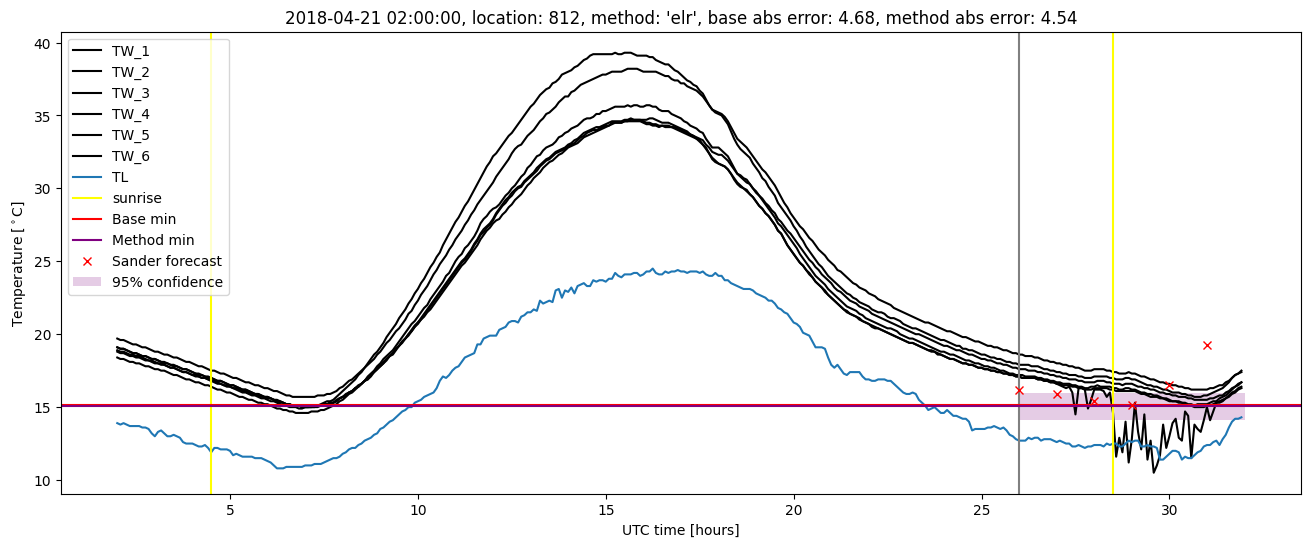
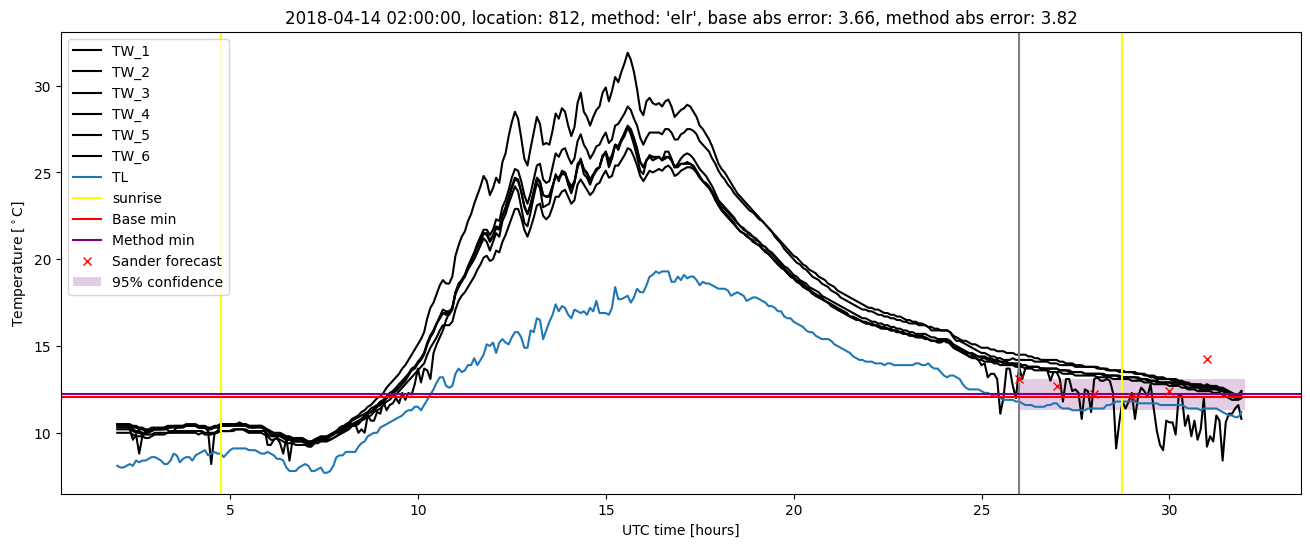
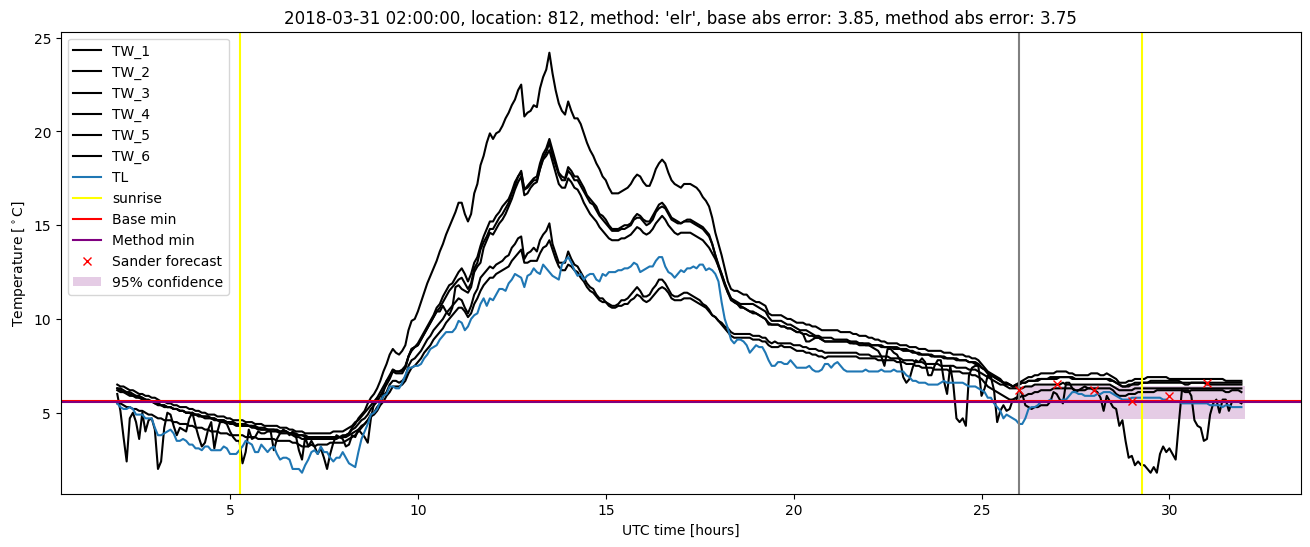
Extended logistic regression plots