GMS location: 810
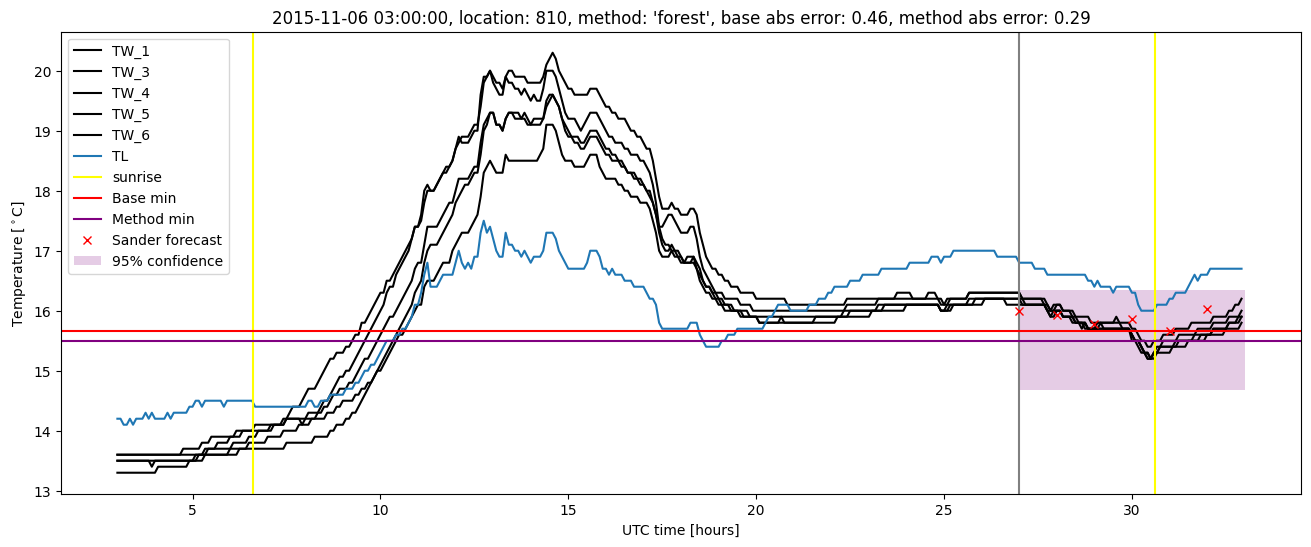
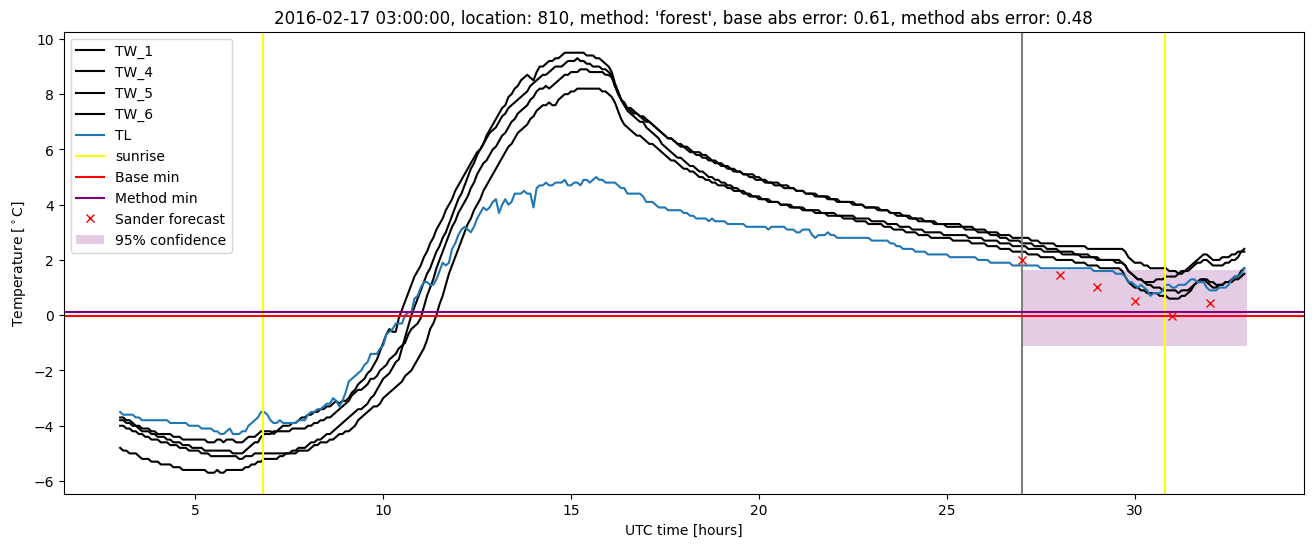
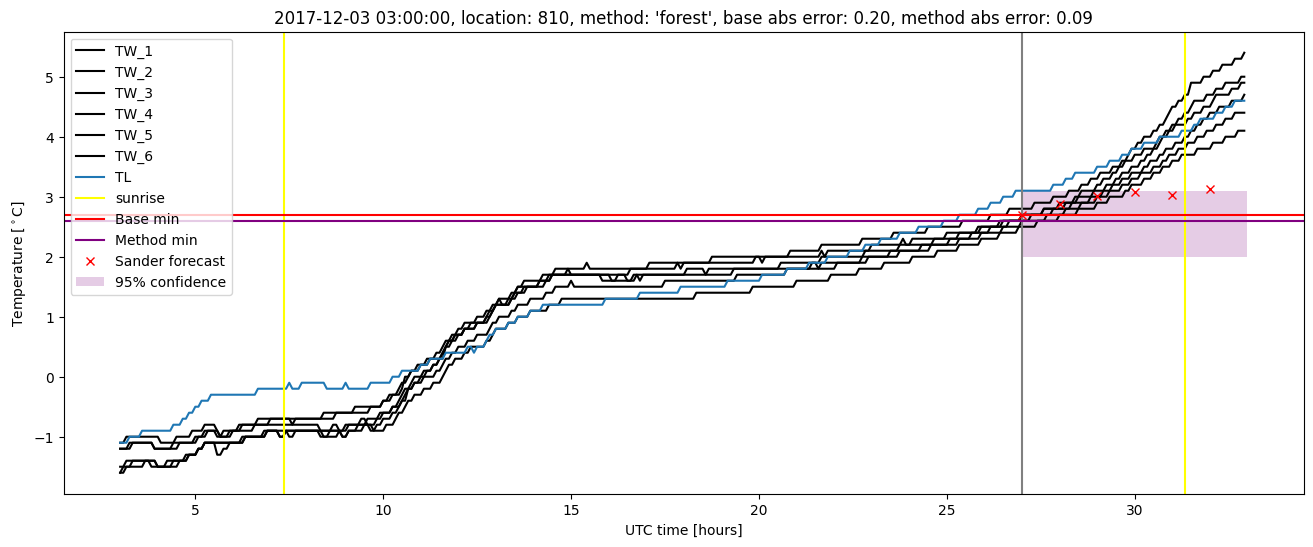
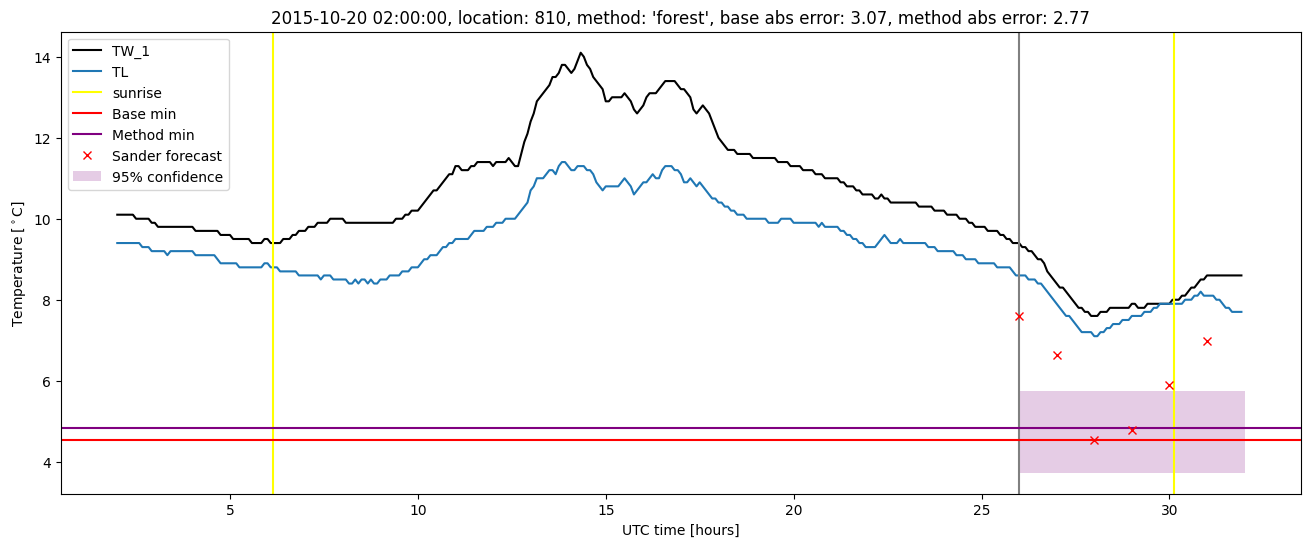
Random forest results
| names |
period |
power |
significance |
meanSquareError |
absError |
maxError |
CRPS |
IGN |
| baseline |
winter 2016 |
0.983 |
0.036 |
0.448 |
0.474 |
3.072 |
NaN |
NaN |
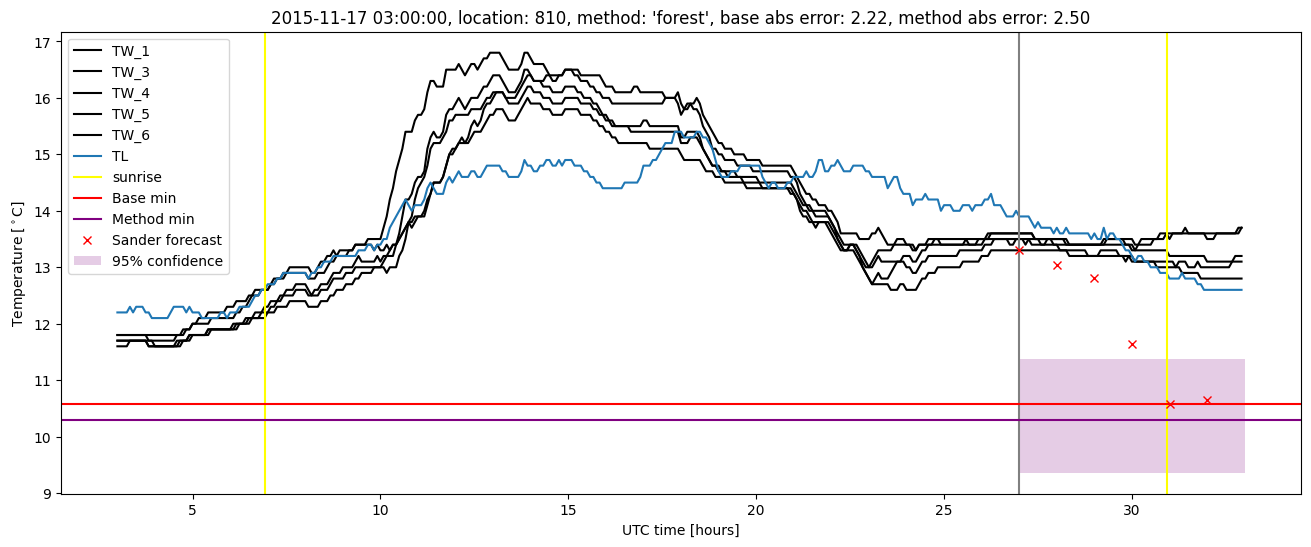
| forest |
winter 2016 |
0.977 |
0.036 |
0.428 |
0.468 |
2.768 |
0.539 |
3.626 |
| baseline |
winter 2017 |
0.991 |
0.100 |
0.296 |
0.409 |
1.754 |
NaN |
NaN |
| forest |
winter 2017 |
0.991 |
0.075 |
0.283 |
0.403 |
1.866 |
0.508 |
3.053 |
| baseline |
winter 2018 |
0.987 |
0.129 |
0.440 |
0.476 |
1.977 |
NaN |
NaN |
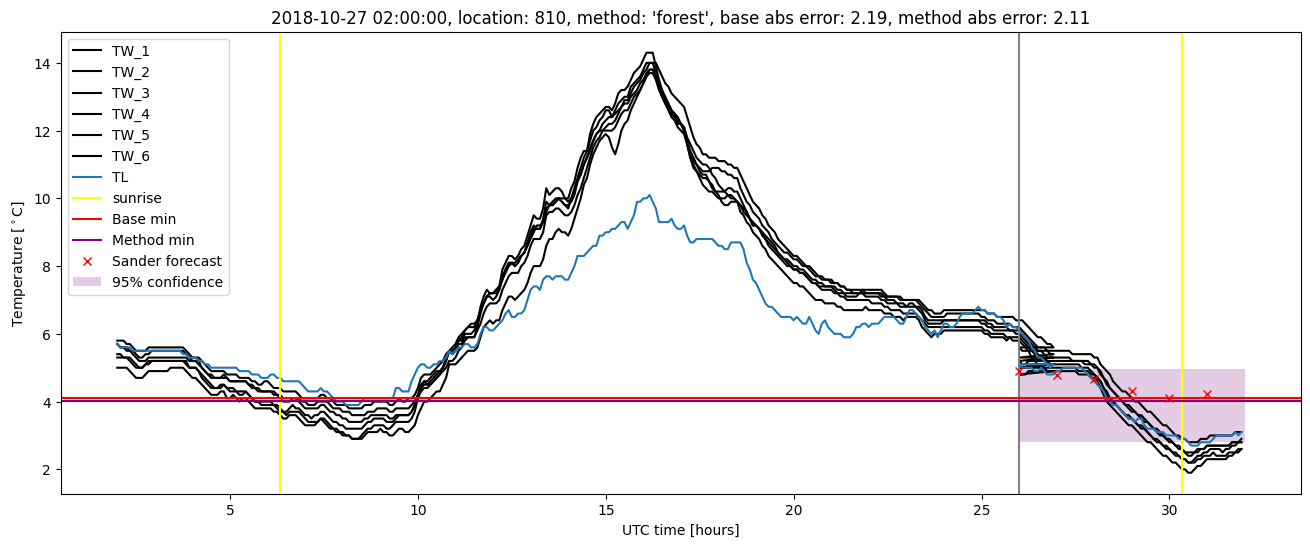
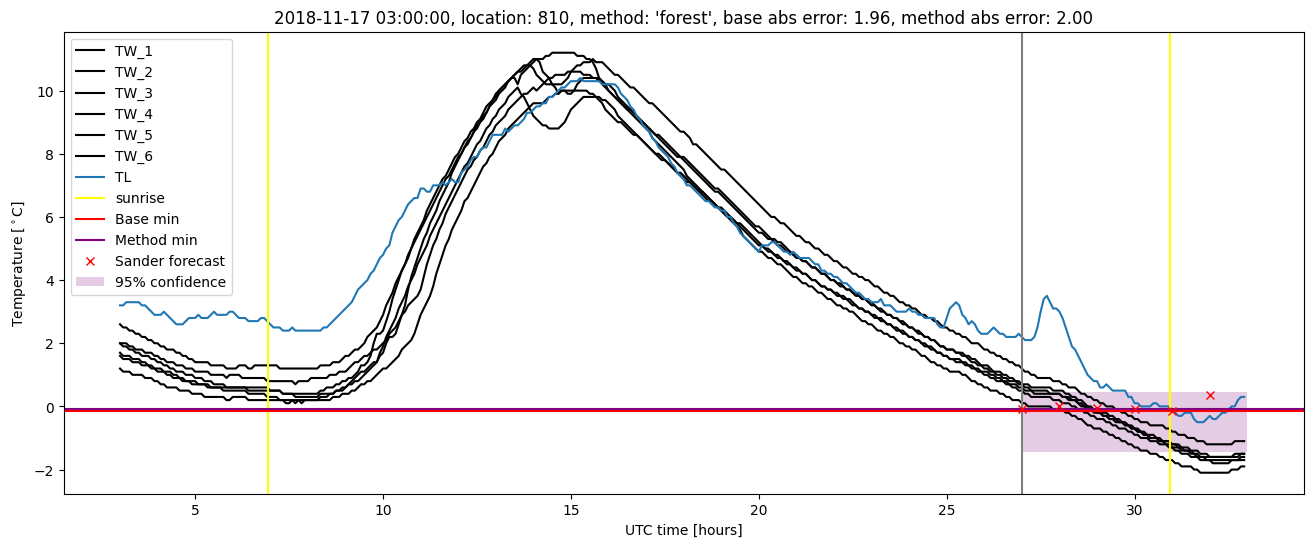
| forest |
winter 2018 |
0.980 |
0.129 |
0.332 |
0.399 |
1.964 |
0.532 |
2.925 |
| baseline |
winter 2019 |
0.985 |
0.120 |
0.443 |
0.470 |
2.592 |
NaN |
NaN |
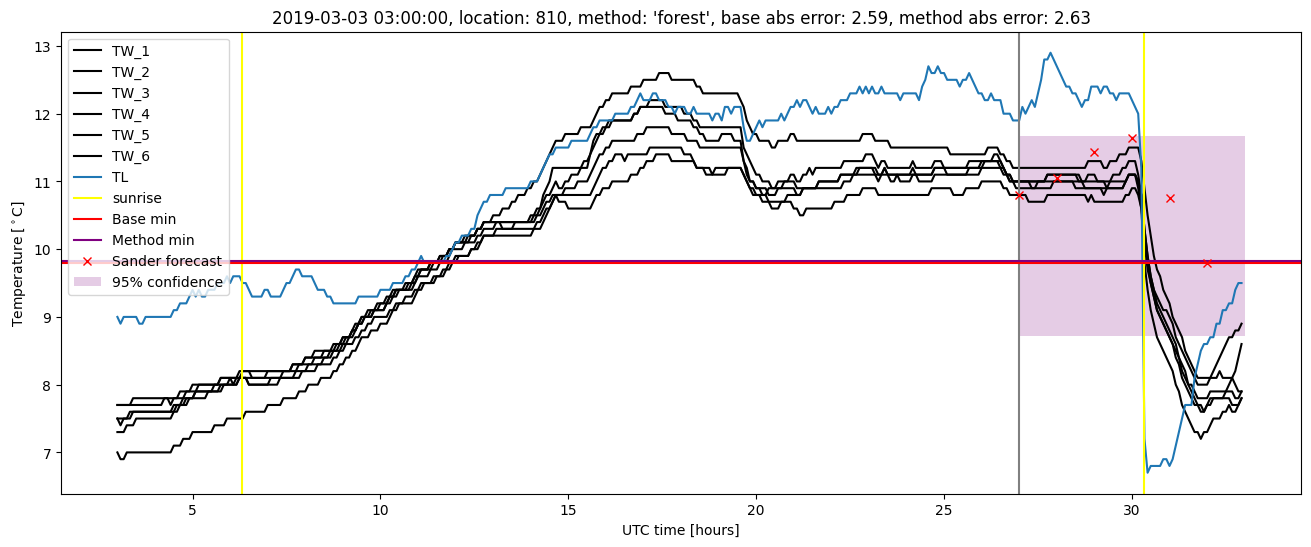
| forest |
winter 2019 |
0.985 |
0.160 |
0.358 |
0.408 |
2.630 |
0.519 |
2.648 |
| baseline |
all |
0.986 |
0.097 |
0.411 |
0.460 |
3.072 |
NaN |
NaN |
| forest |
all |
0.983 |
0.097 |
0.355 |
0.422 |
2.768 |
0.526 |
3.093 |
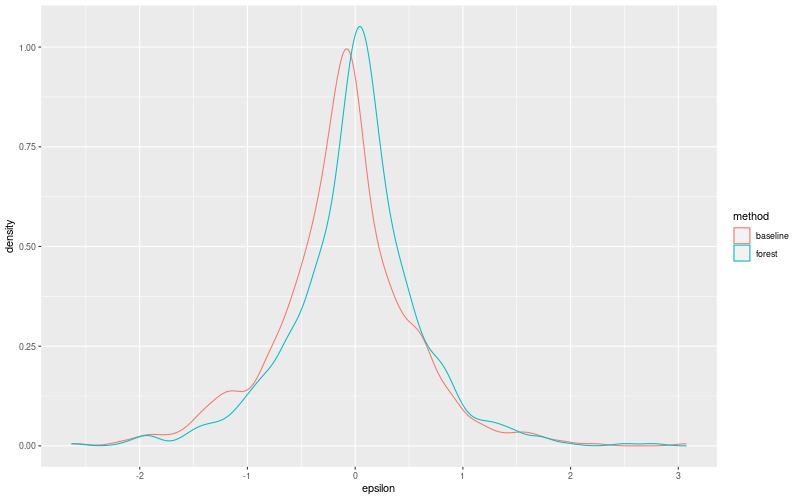
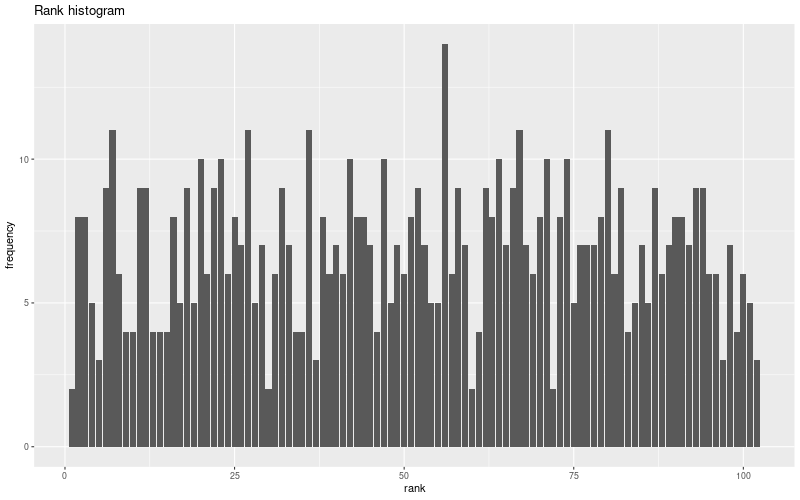
Random forest plots
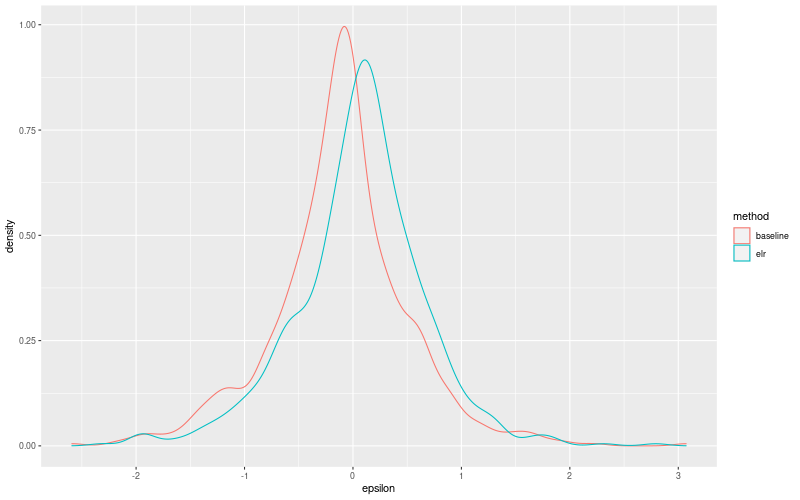
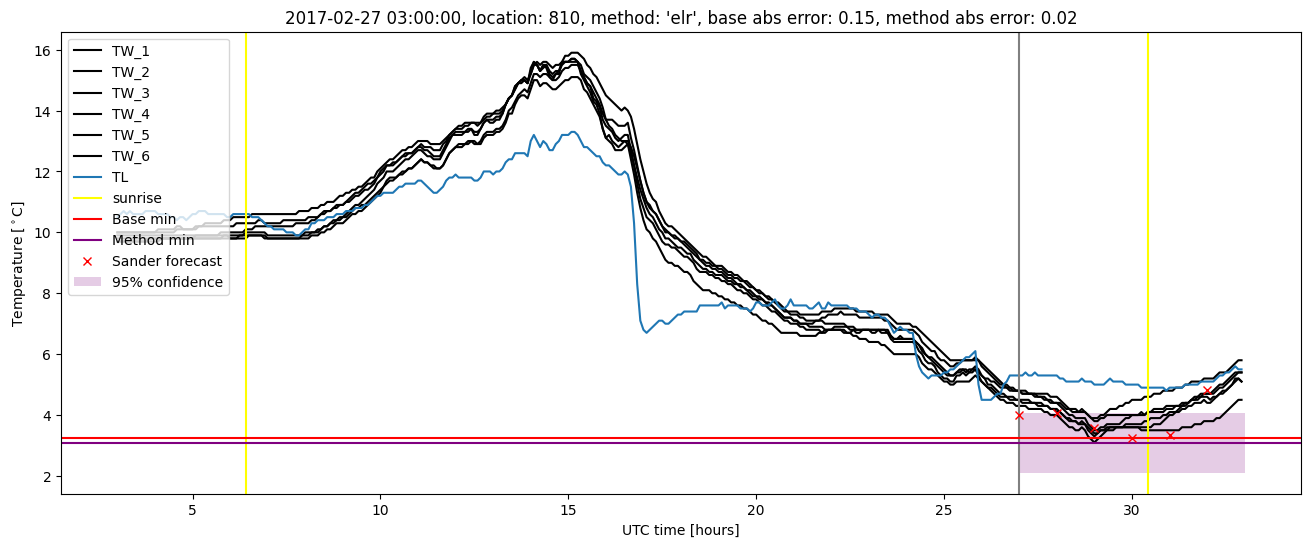
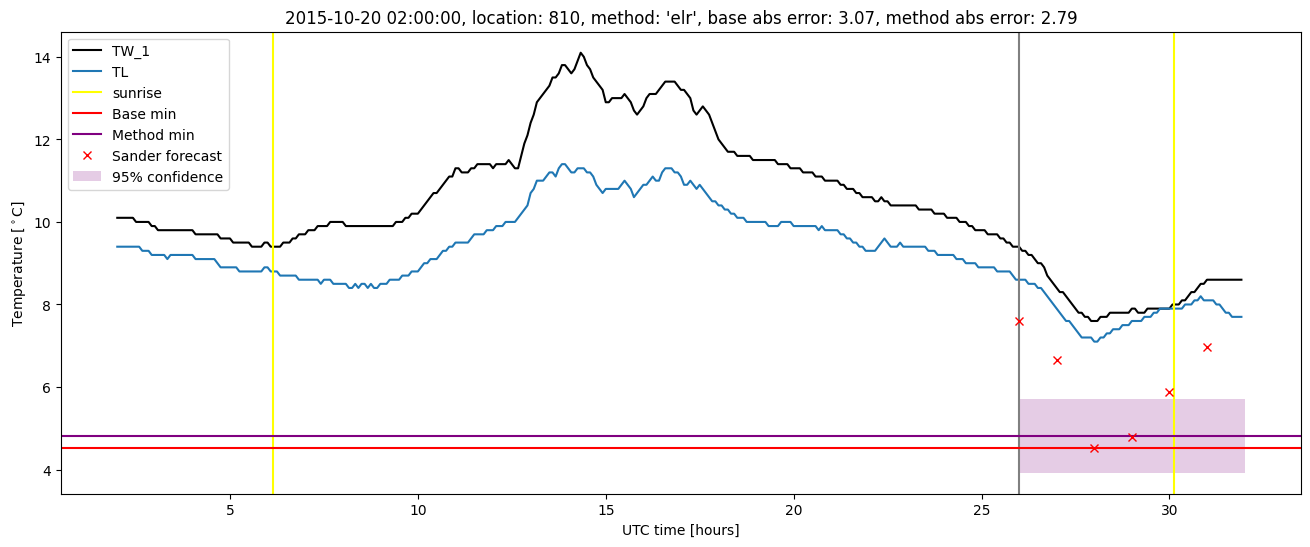
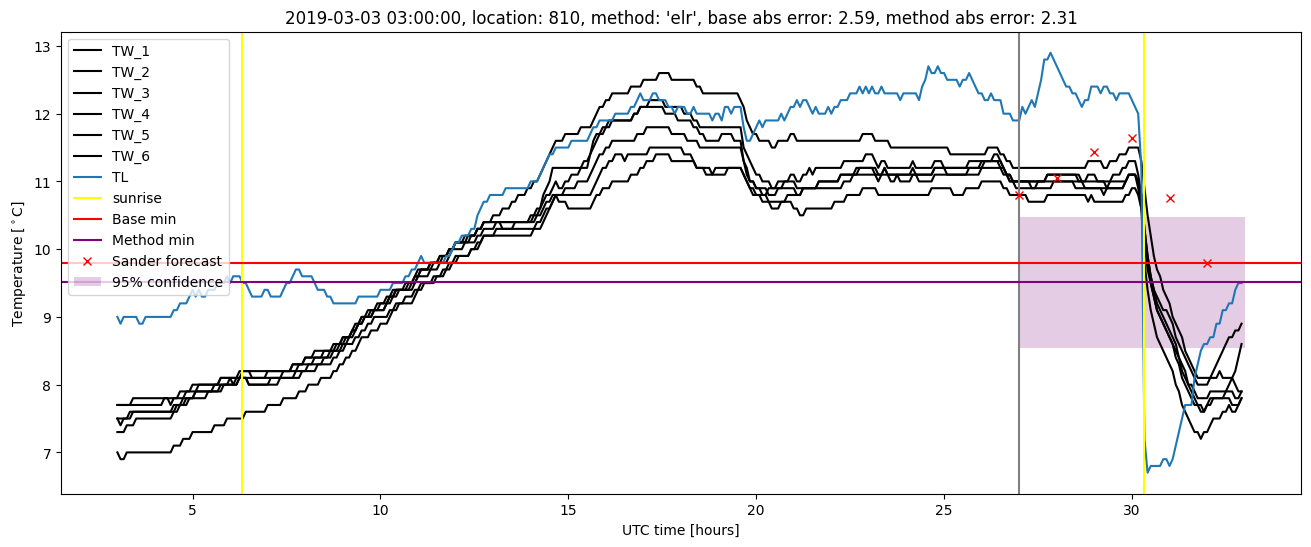
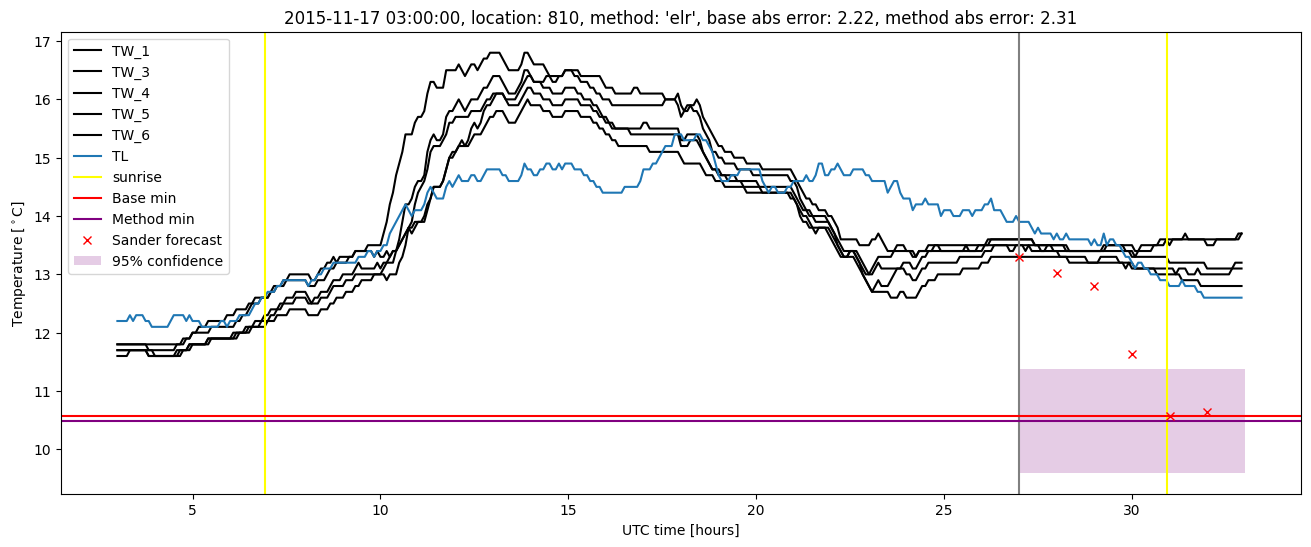
Extended logistic regression results
| names |
period |
power |
significance |
meanSquareError |
absError |
maxError |
CRPS |
IGN |
| baseline |
winter 2016 |
0.983 |
0.036 |
0.448 |
0.474 |
3.072 |
NaN |
NaN |
| elr |
winter 2016 |
0.977 |
0.036 |
0.481 |
0.516 |
2.792 |
0.657 |
5.860 |
| baseline |
winter 2017 |
0.991 |
0.100 |
0.296 |
0.409 |
1.754 |
NaN |
NaN |
| elr |
winter 2017 |
0.991 |
0.100 |
0.283 |
0.405 |
1.611 |
0.570 |
3.328 |
| baseline |
winter 2018 |
0.987 |
0.129 |
0.440 |
0.476 |
1.977 |
NaN |
NaN |
| elr |
winter 2018 |
0.973 |
0.129 |
0.351 |
0.448 |
1.942 |
0.618 |
4.091 |
| baseline |
winter 2019 |
0.985 |
0.120 |
0.443 |
0.470 |
2.592 |
NaN |
NaN |
| elr |
winter 2019 |
0.993 |
0.120 |
0.336 |
0.409 |
2.315 |
0.575 |
3.475 |
| baseline |
all |
0.986 |
0.097 |
0.411 |
0.460 |
3.072 |
NaN |
NaN |
| elr |
all |
0.983 |
0.097 |
0.370 |
0.449 |
2.792 |
0.609 |
4.295 |
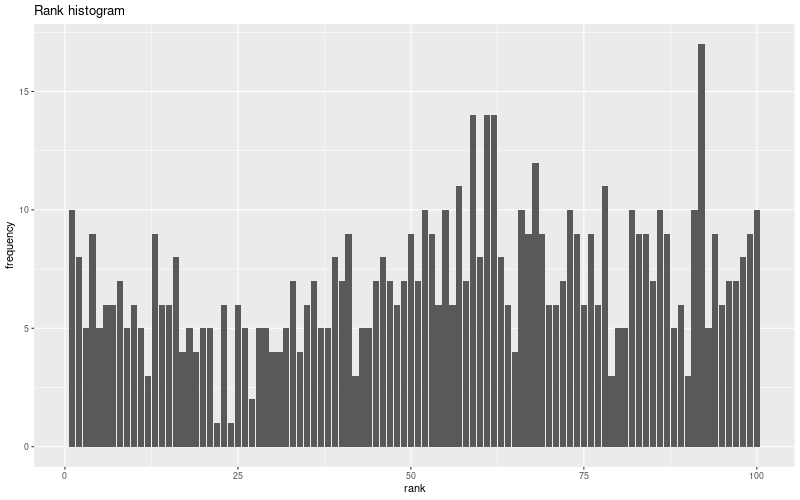
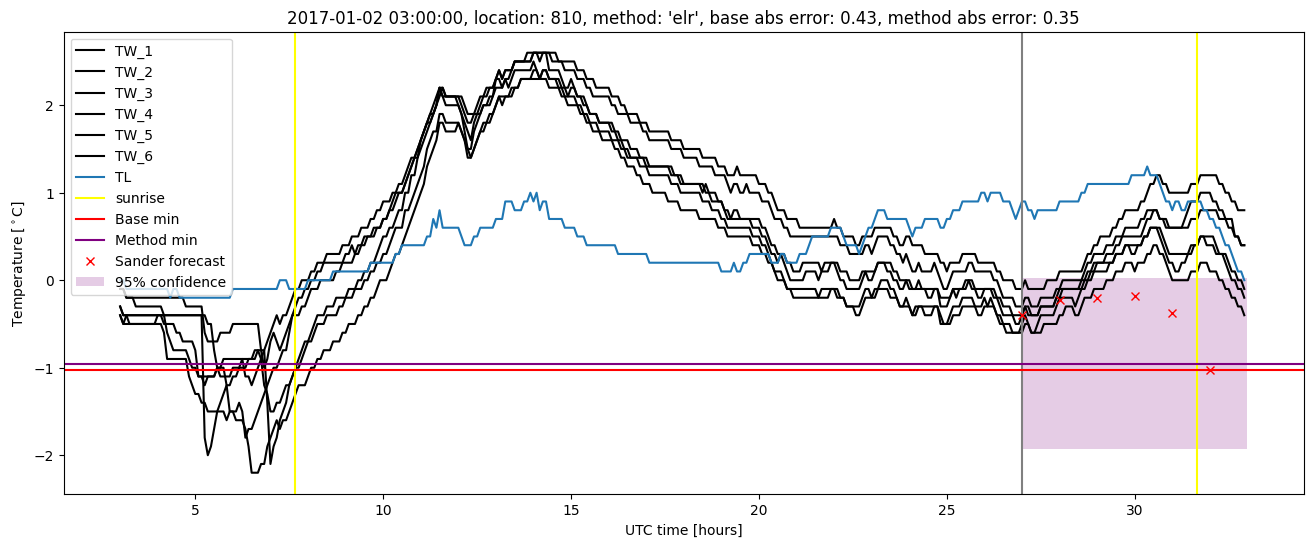
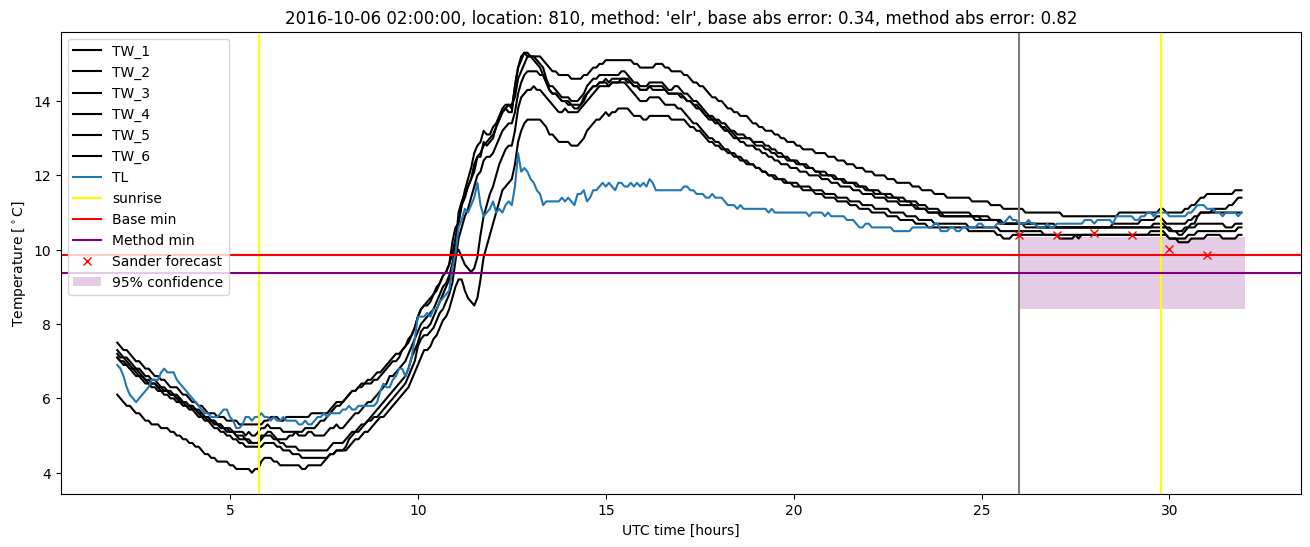
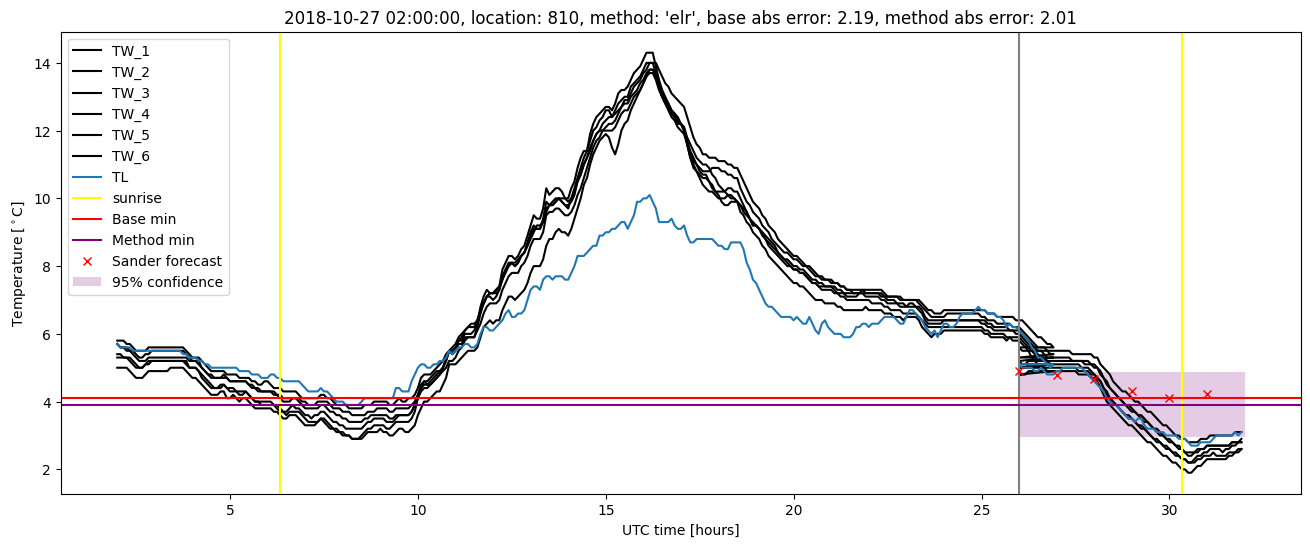
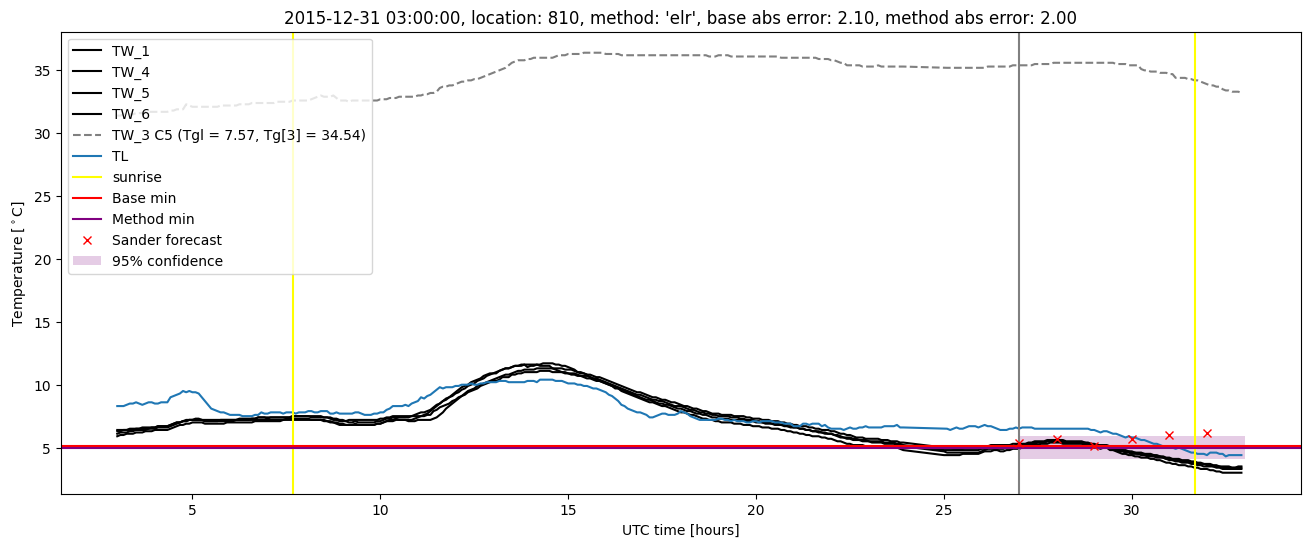
Extended logistic regression plots