GMS location: 722
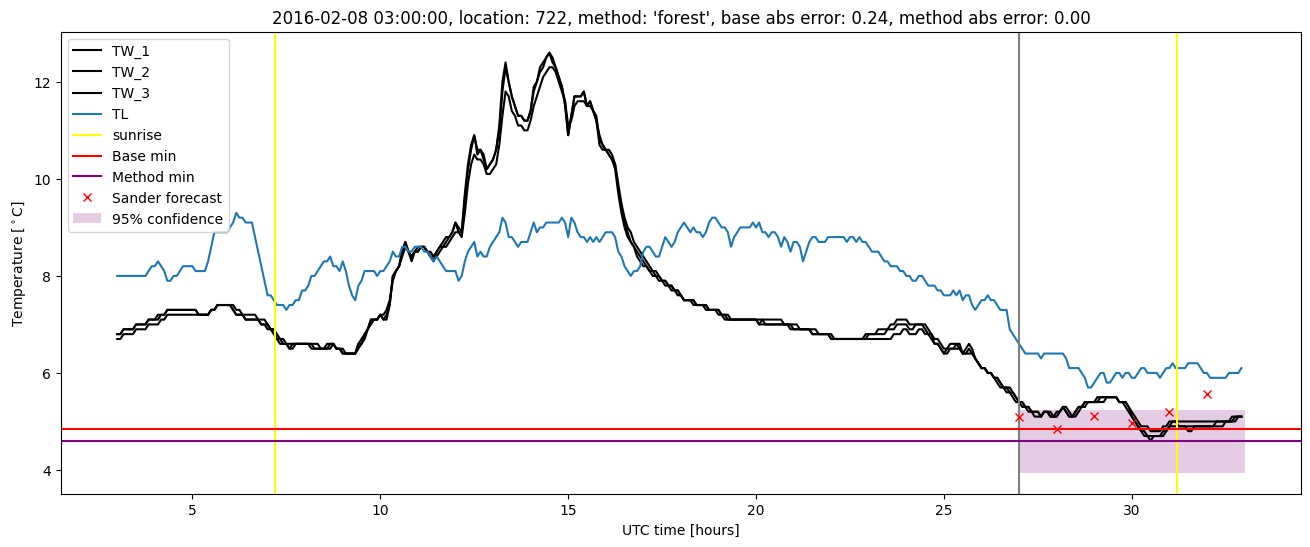
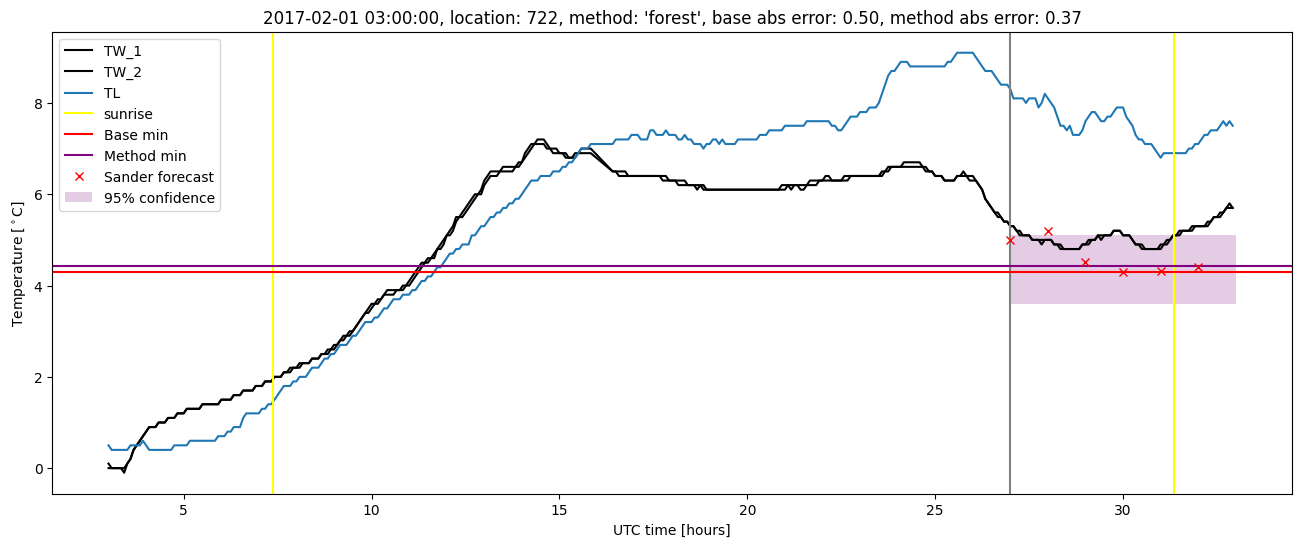
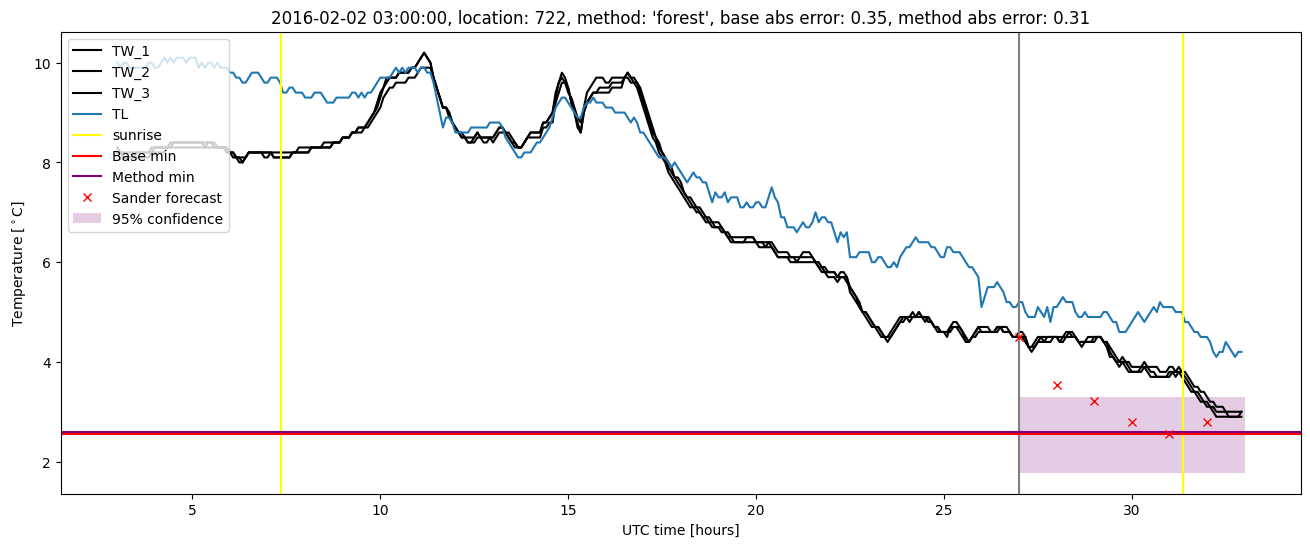
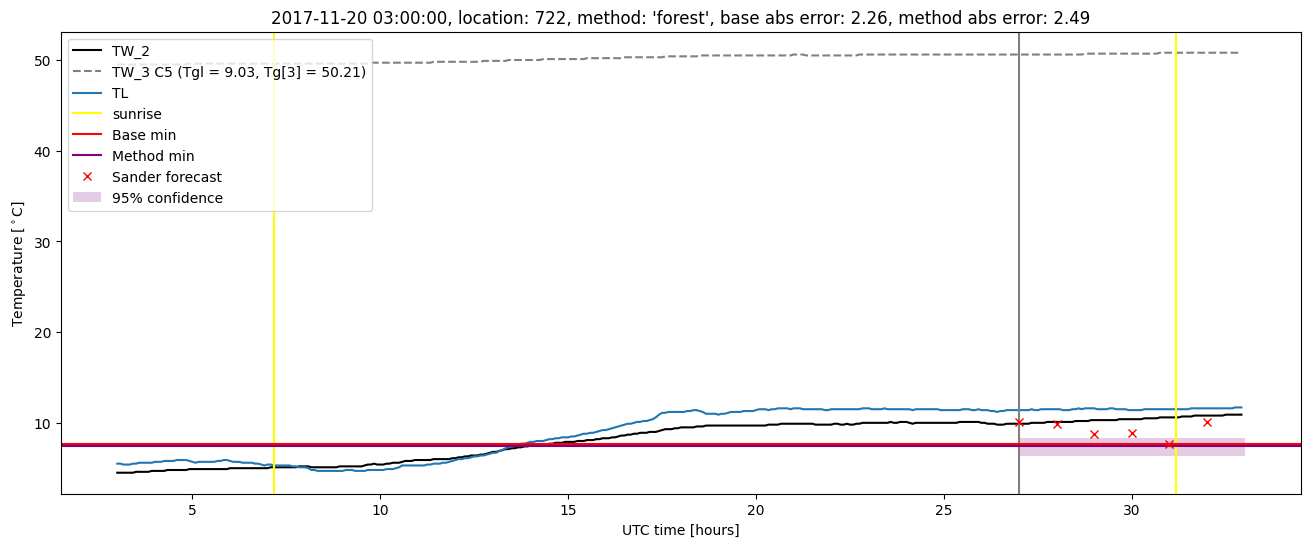
Random forest results
| names |
period |
power |
significance |
meanSquareError |
absError |
maxError |
CRPS |
IGN |
| baseline |
winter 2016 |
1.000 |
0.067 |
0.315 |
0.410 |
2.127 |
NaN |
NaN |
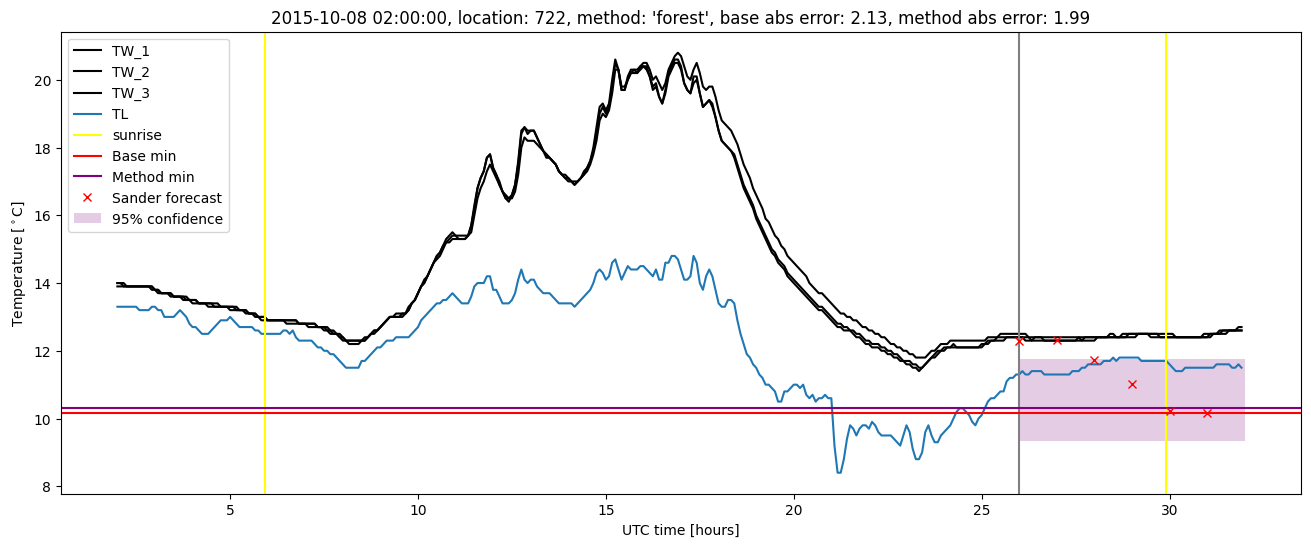
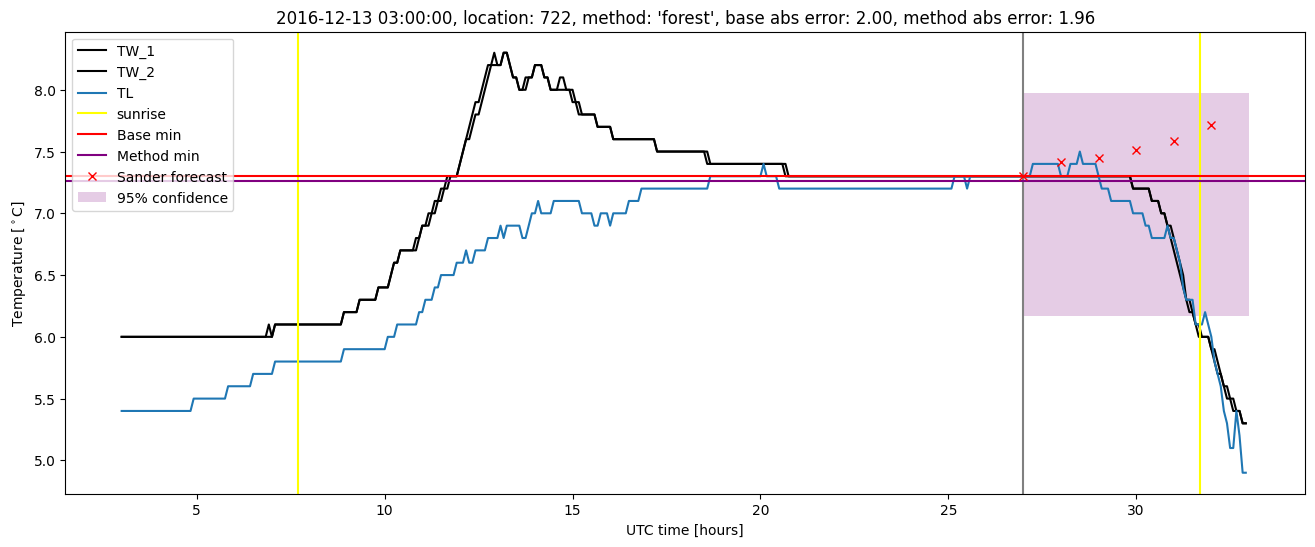
| forest |
winter 2016 |
1.000 |
0.133 |
0.289 |
0.394 |
1.992 |
0.502 |
2.961 |
| baseline |
winter 2017 |
0.984 |
0.067 |
0.421 |
0.458 |
2.562 |
NaN |
NaN |
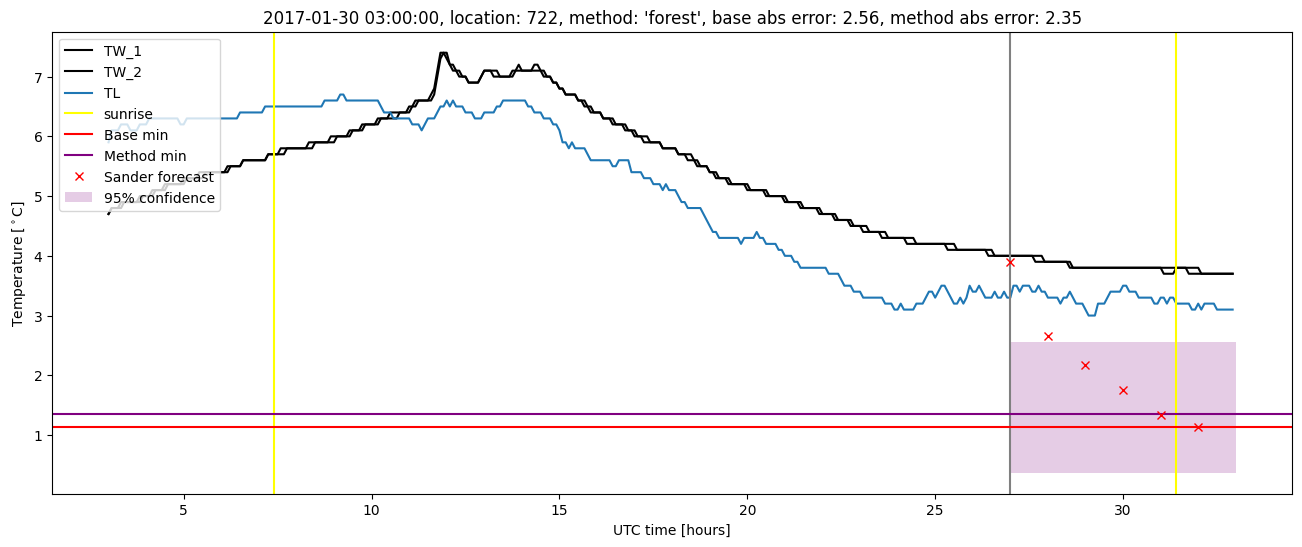
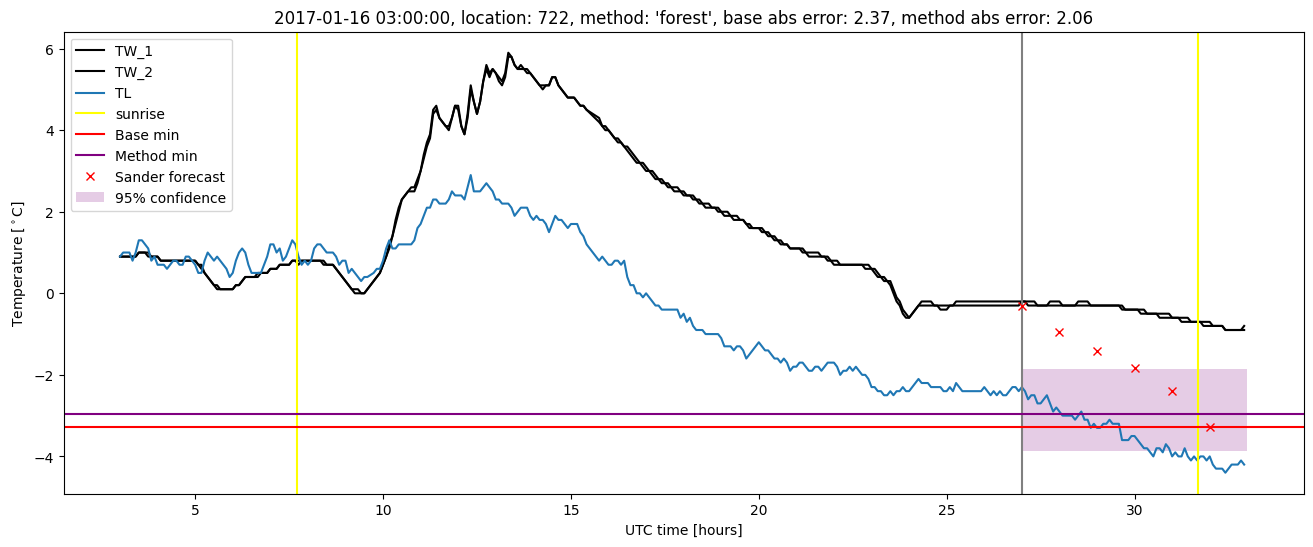
| forest |
winter 2017 |
0.975 |
0.067 |
0.354 |
0.430 |
2.348 |
0.501 |
3.213 |
| baseline |
winter 2018 |
0.994 |
0.000e+00 |
0.345 |
0.426 |
2.264 |
NaN |
NaN |
| forest |
winter 2018 |
0.994 |
0.000e+00 |
0.333 |
0.410 |
2.495 |
0.505 |
2.883 |
| baseline |
winter 2019 |
0.987 |
0.000e+00 |
0.284 |
0.375 |
2.214 |
NaN |
NaN |
| forest |
winter 2019 |
0.987 |
0.000e+00 |
0.260 |
0.380 |
1.627 |
0.493 |
2.564 |
| baseline |
all |
0.992 |
0.038 |
0.339 |
0.417 |
2.562 |
NaN |
NaN |
| forest |
all |
0.990 |
0.051 |
0.308 |
0.403 |
2.495 |
0.500 |
2.906 |
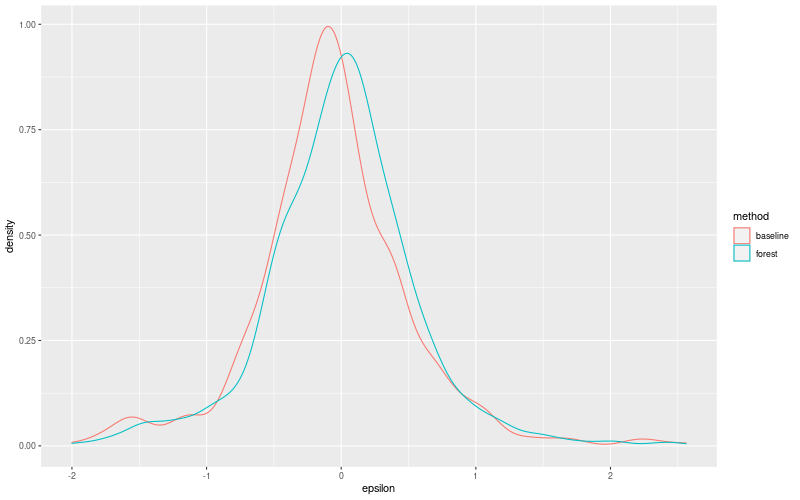
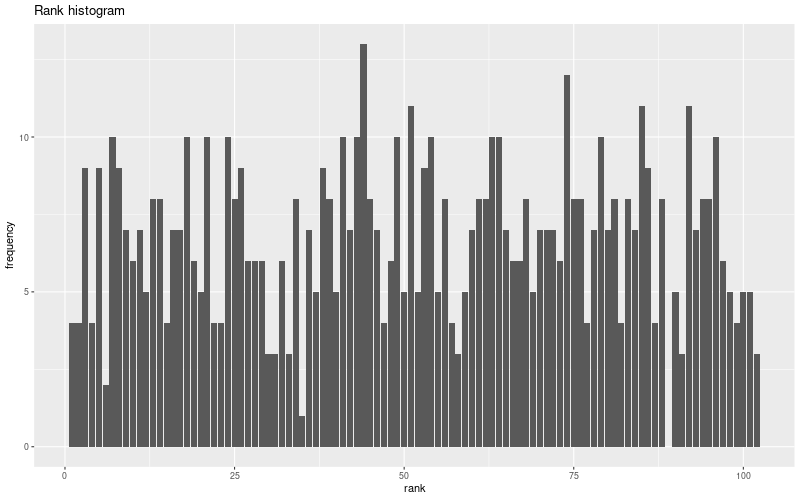
Random forest plots
Extended logistic regression results
| names |
period |
power |
significance |
meanSquareError |
absError |
maxError |
CRPS |
IGN |
| baseline |
winter 2016 |
1.000 |
0.067 |
0.315 |
0.410 |
2.127 |
NaN |
NaN |
| elr |
winter 2016 |
0.995 |
0.067 |
0.309 |
0.411 |
2.031 |
0.557 |
3.863 |
| baseline |
winter 2017 |
0.984 |
0.067 |
0.421 |
0.458 |
2.562 |
NaN |
NaN |
| elr |
winter 2017 |
0.975 |
0.067 |
0.406 |
0.464 |
2.481 |
0.584 |
4.791 |
| baseline |
winter 2018 |
0.994 |
0.000e+00 |
0.345 |
0.426 |
2.264 |
NaN |
NaN |
| elr |
winter 2018 |
0.987 |
0.000e+00 |
0.367 |
0.449 |
2.445 |
0.557 |
4.163 |
| baseline |
winter 2019 |
0.987 |
0.000e+00 |
0.284 |
0.375 |
2.214 |
NaN |
NaN |
| elr |
winter 2019 |
0.987 |
0.000e+00 |
0.260 |
0.391 |
1.642 |
0.519 |
3.256 |
| baseline |
all |
0.992 |
0.038 |
0.339 |
0.417 |
2.562 |
NaN |
NaN |
| elr |
all |
0.987 |
0.038 |
0.334 |
0.428 |
2.481 |
0.554 |
4.008 |
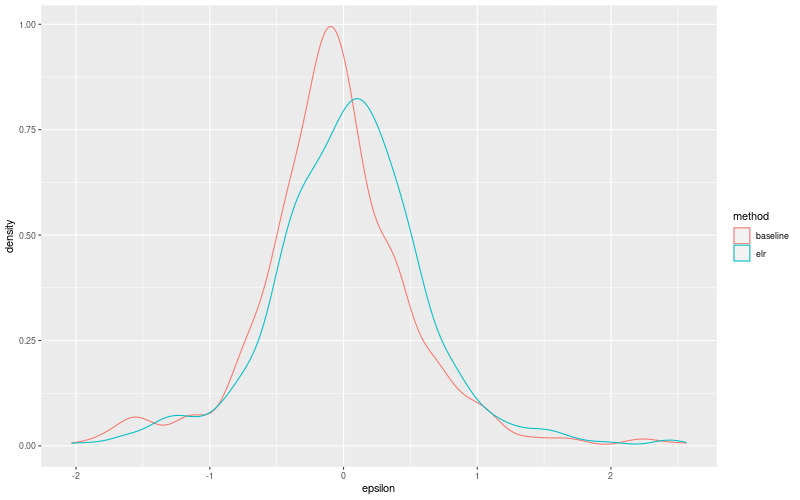
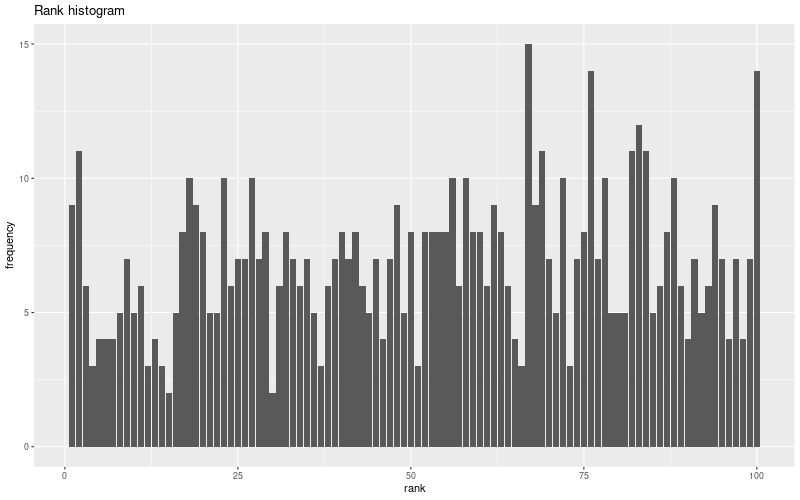
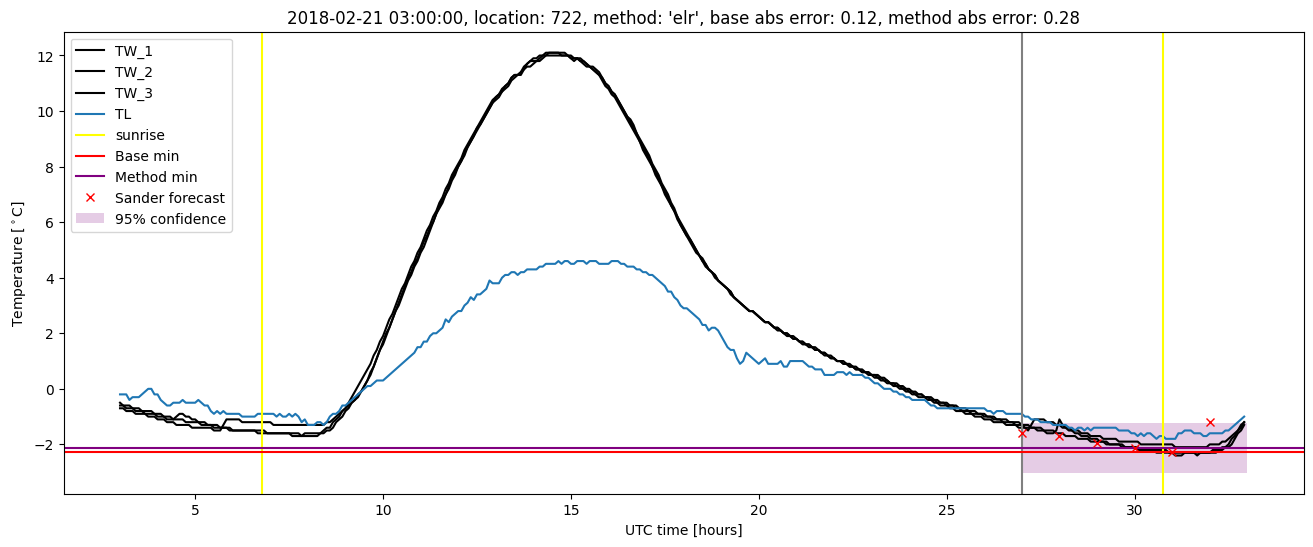
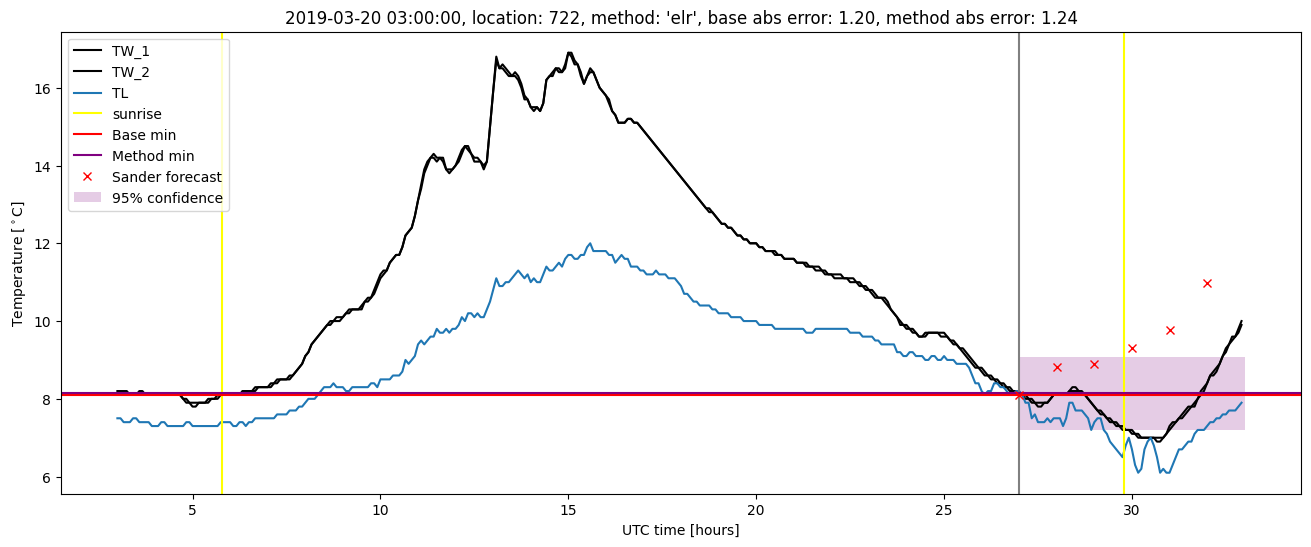
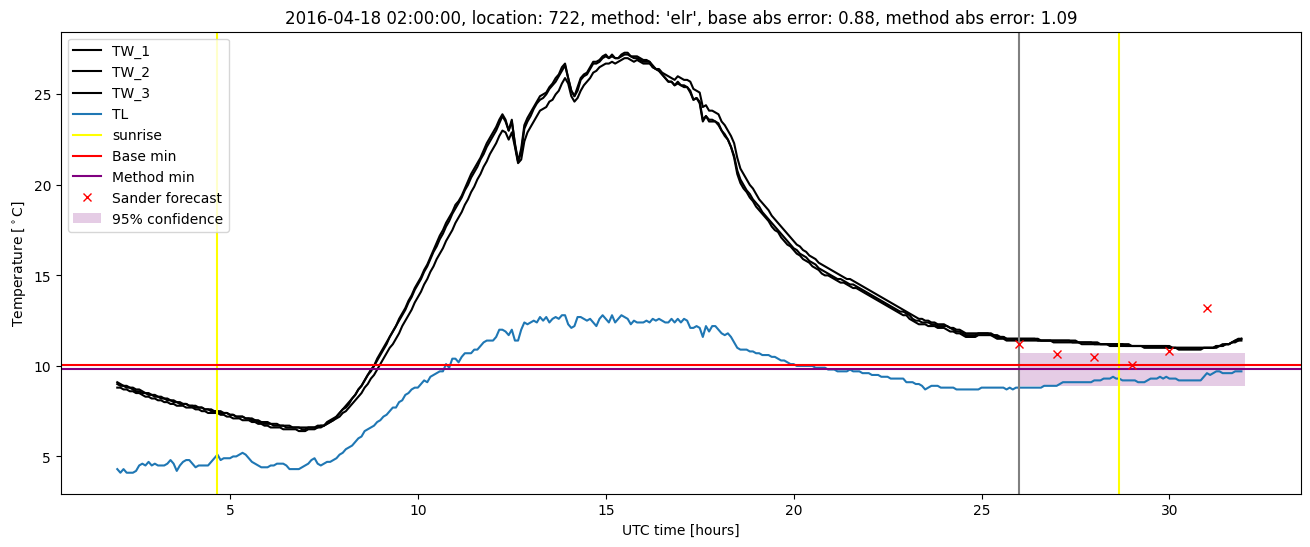
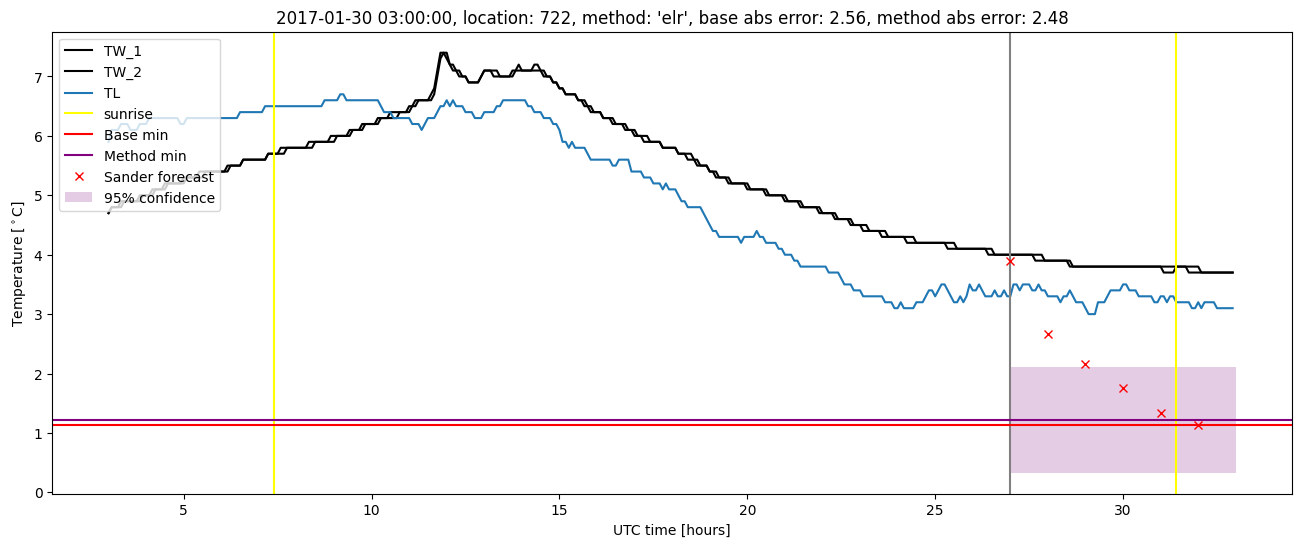
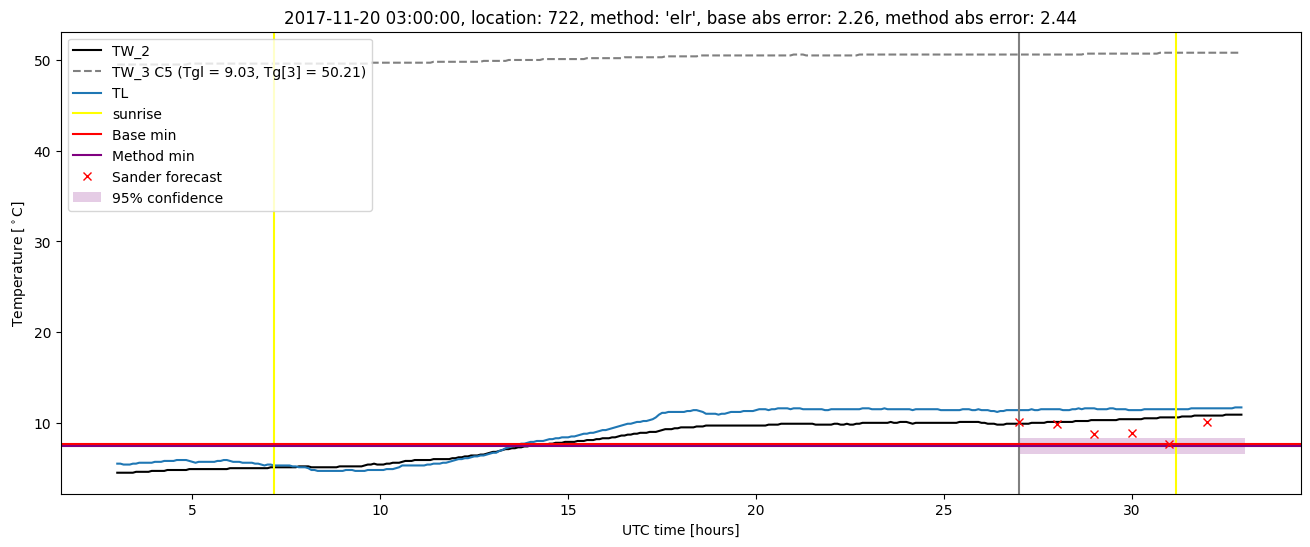
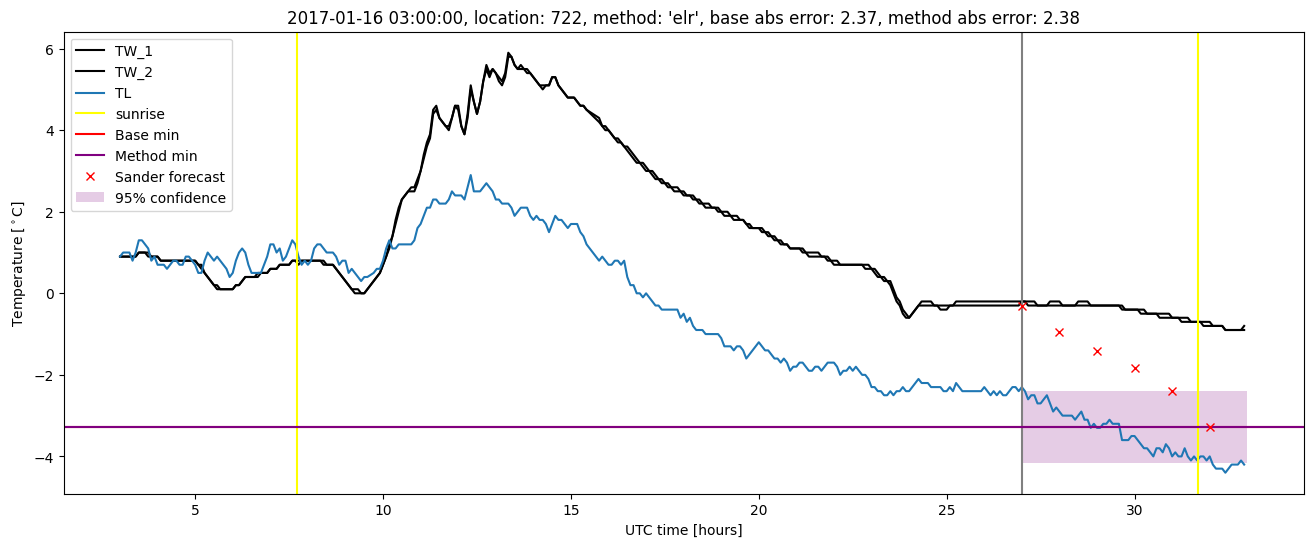
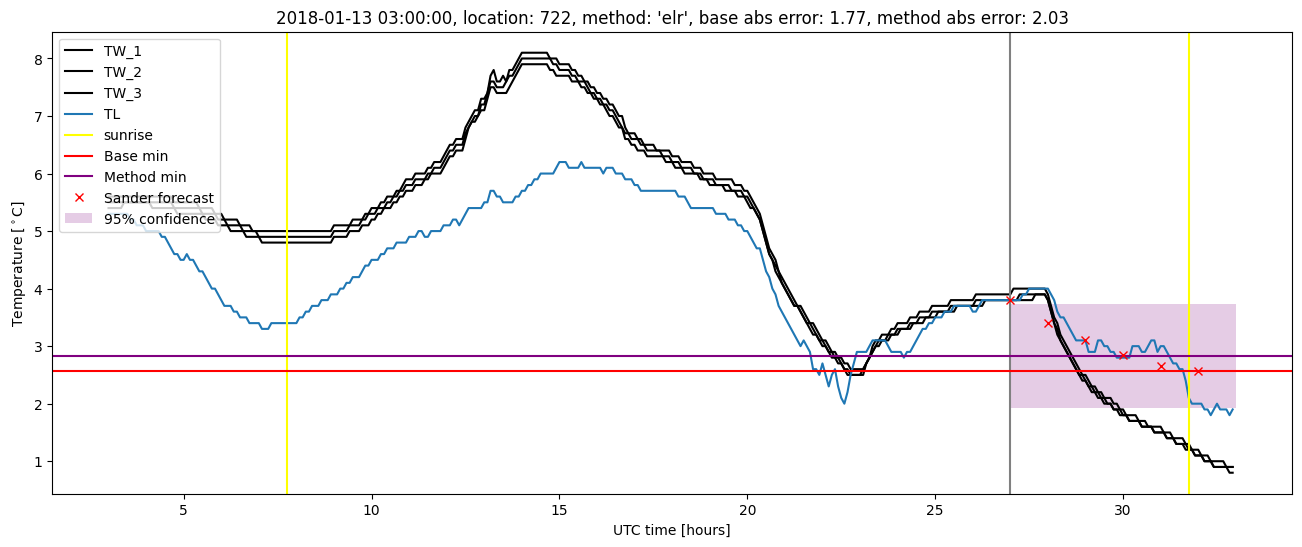
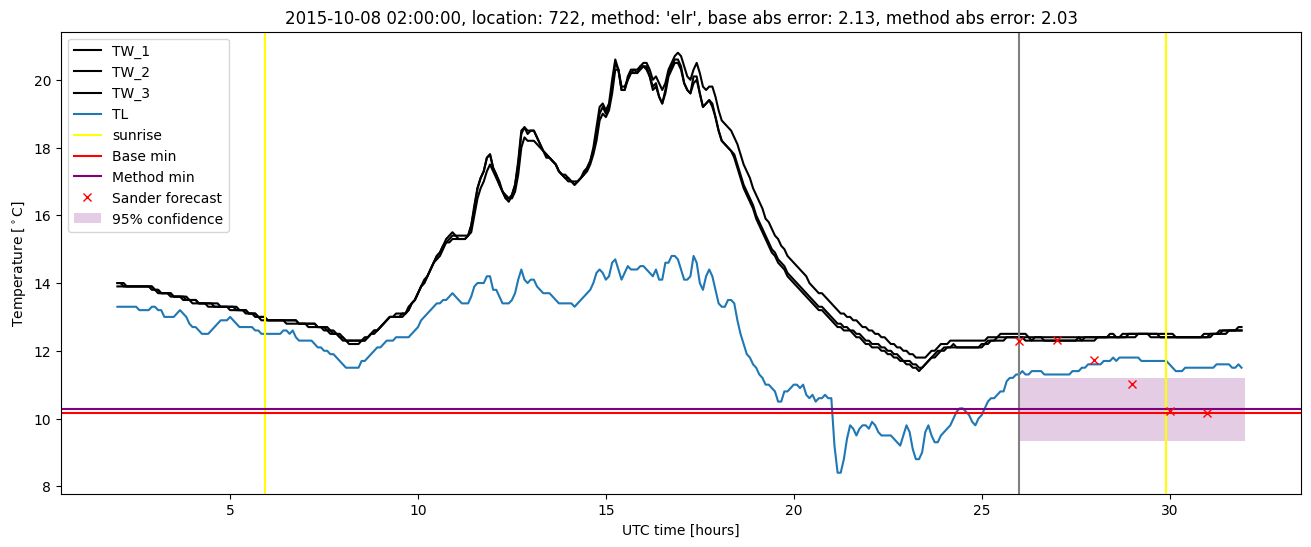
Extended logistic regression plots