GMS location: 721
Random forest results
| names |
period |
power |
significance |
meanSquareError |
absError |
maxError |
CRPS |
IGN |
| baseline |
winter 2016 |
0.994 |
0.036 |
0.332 |
0.417 |
2.400 |
NaN |
NaN |
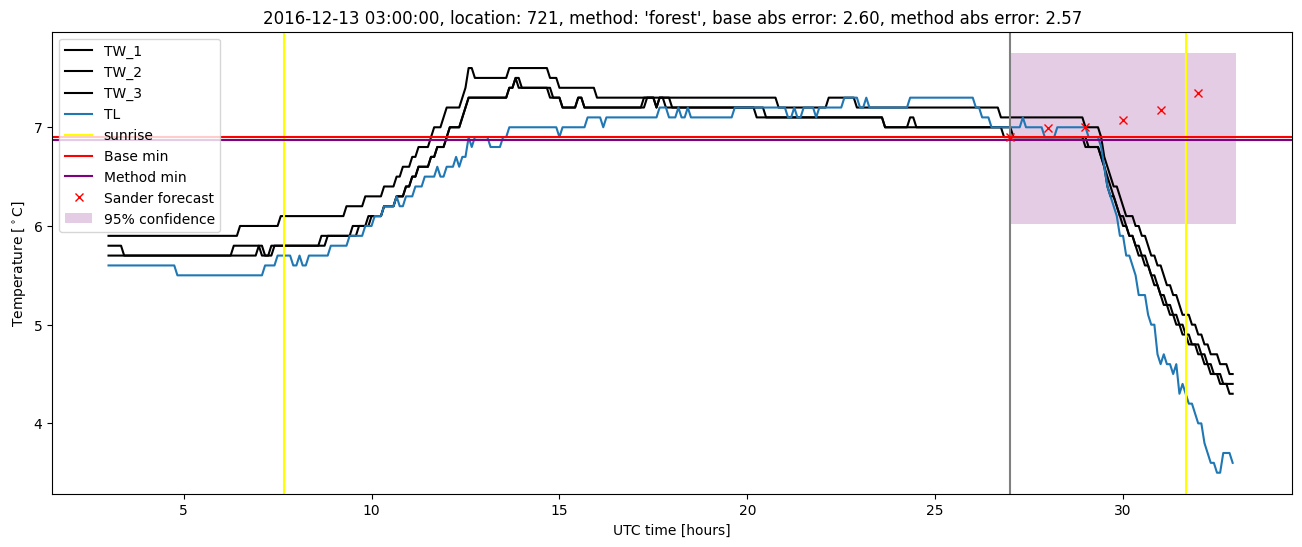
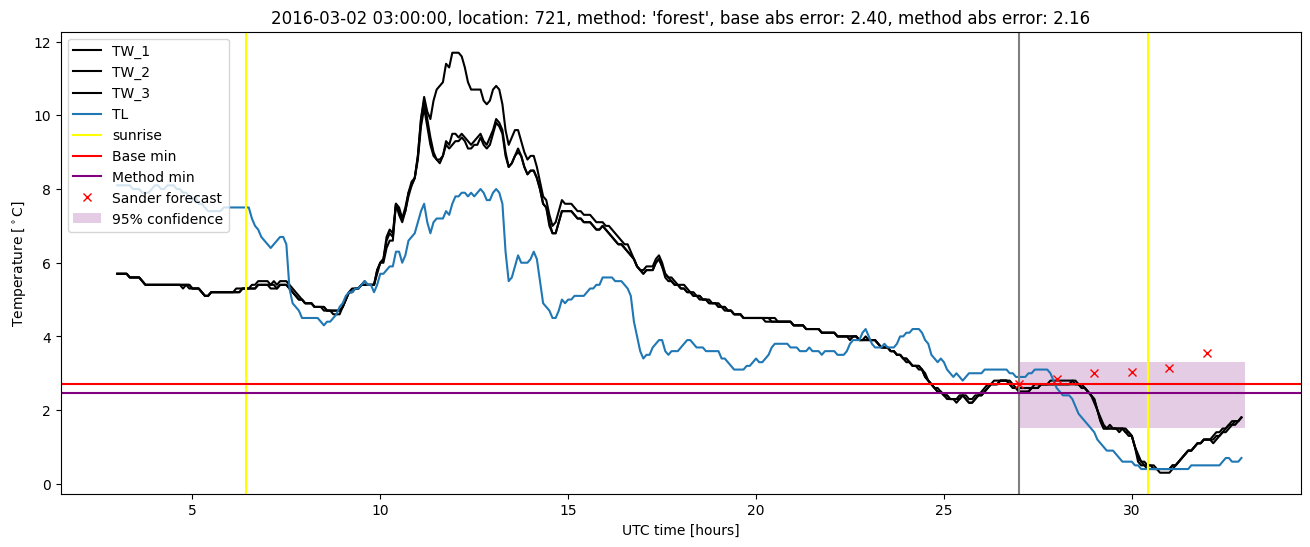
| forest |
winter 2016 |
0.994 |
0.036 |
0.330 |
0.416 |
2.160 |
0.501 |
3.202 |
| baseline |
winter 2017 |
0.983 |
0.091 |
0.397 |
0.445 |
2.601 |
NaN |
NaN |
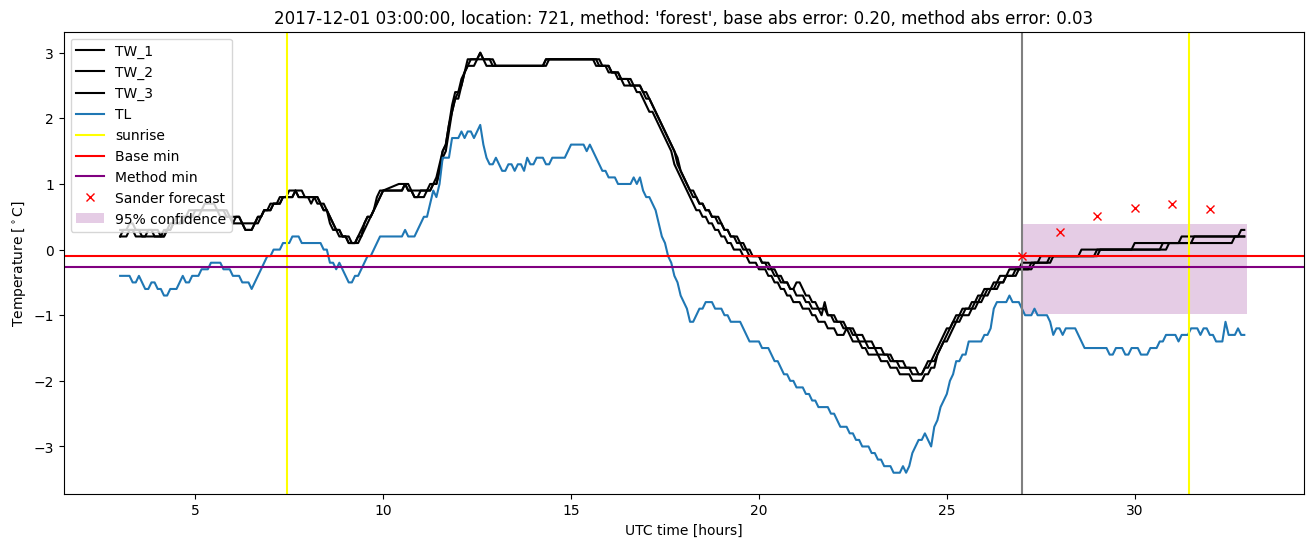
| forest |
winter 2017 |
0.974 |
0.091 |
0.343 |
0.416 |
2.573 |
0.482 |
3.577 |
| baseline |
winter 2018 |
0.978 |
0.077 |
0.395 |
0.469 |
1.795 |
NaN |
NaN |
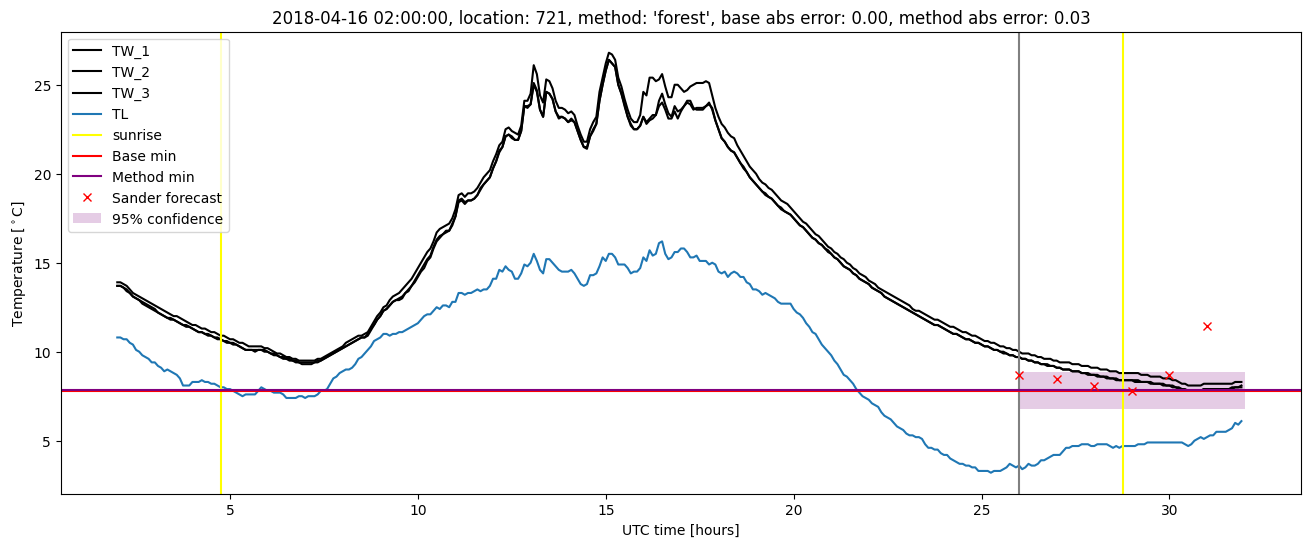
| forest |
winter 2018 |
0.971 |
0.115 |
0.348 |
0.436 |
1.780 |
0.491 |
2.695 |
| baseline |
winter 2019 |
0.984 |
0.105 |
0.282 |
0.391 |
2.054 |
NaN |
NaN |
| forest |
winter 2019 |
0.984 |
0.053 |
0.257 |
0.377 |
1.780 |
0.485 |
2.429 |
| baseline |
all |
0.986 |
0.075 |
0.351 |
0.431 |
2.601 |
NaN |
NaN |
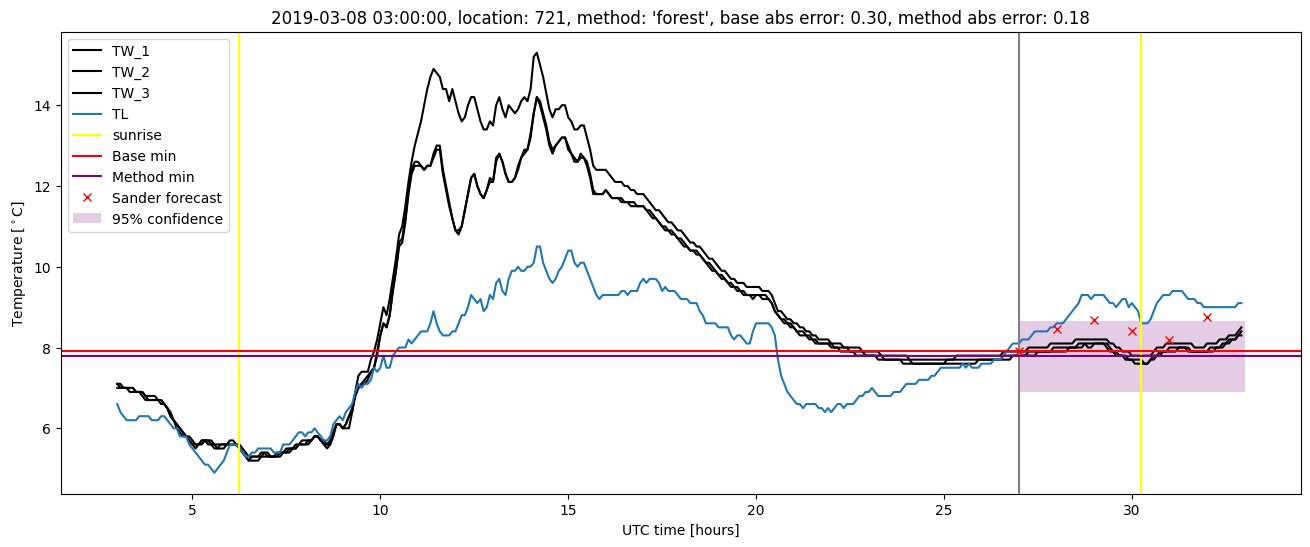
| forest |
all |
0.982 |
0.075 |
0.322 |
0.413 |
2.573 |
0.491 |
2.993 |
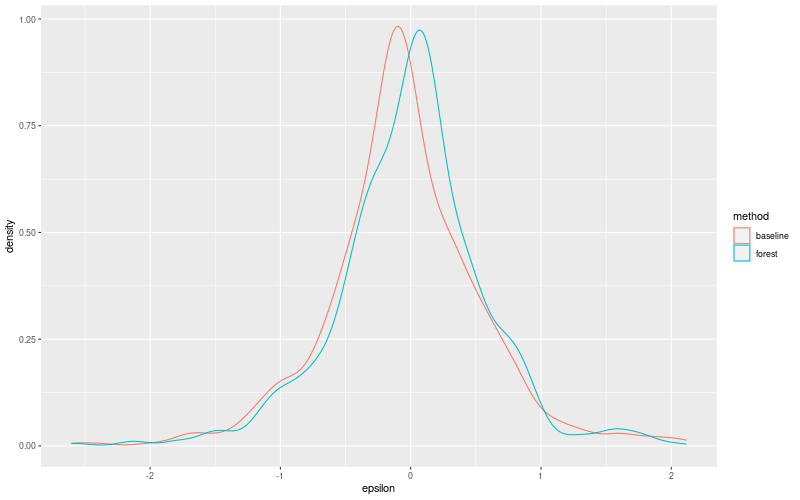
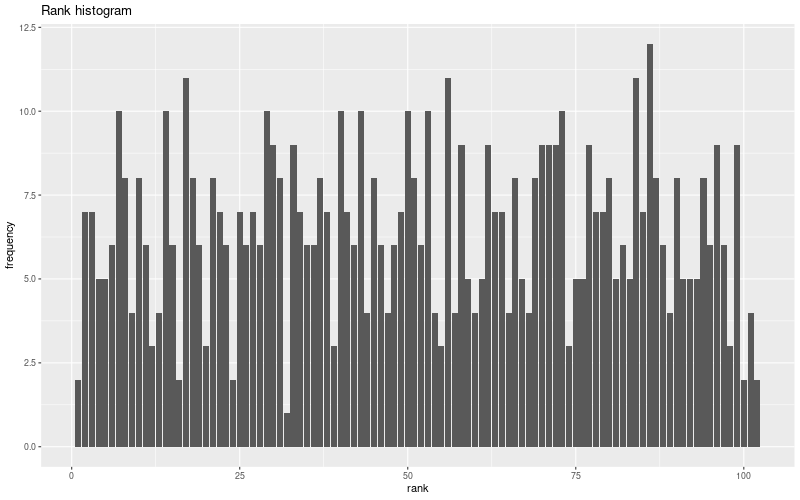
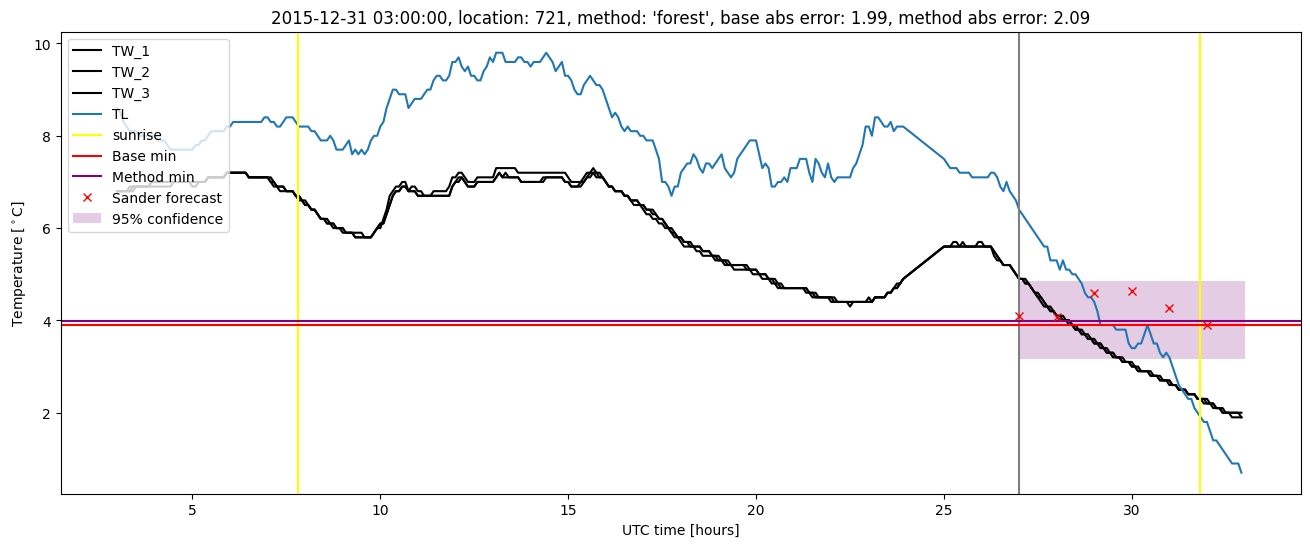
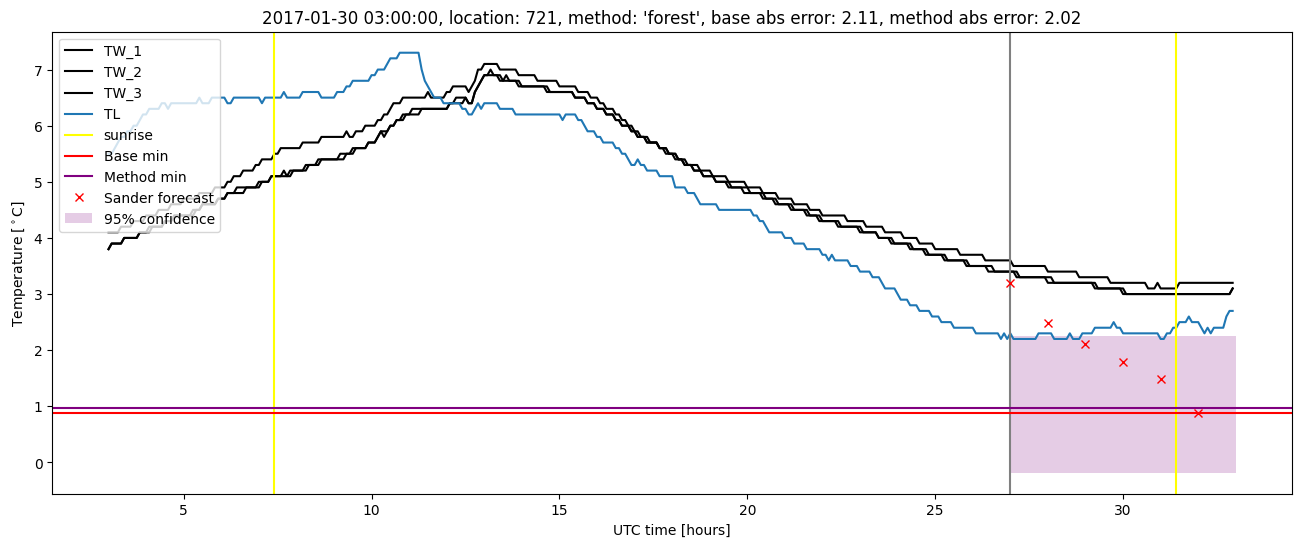
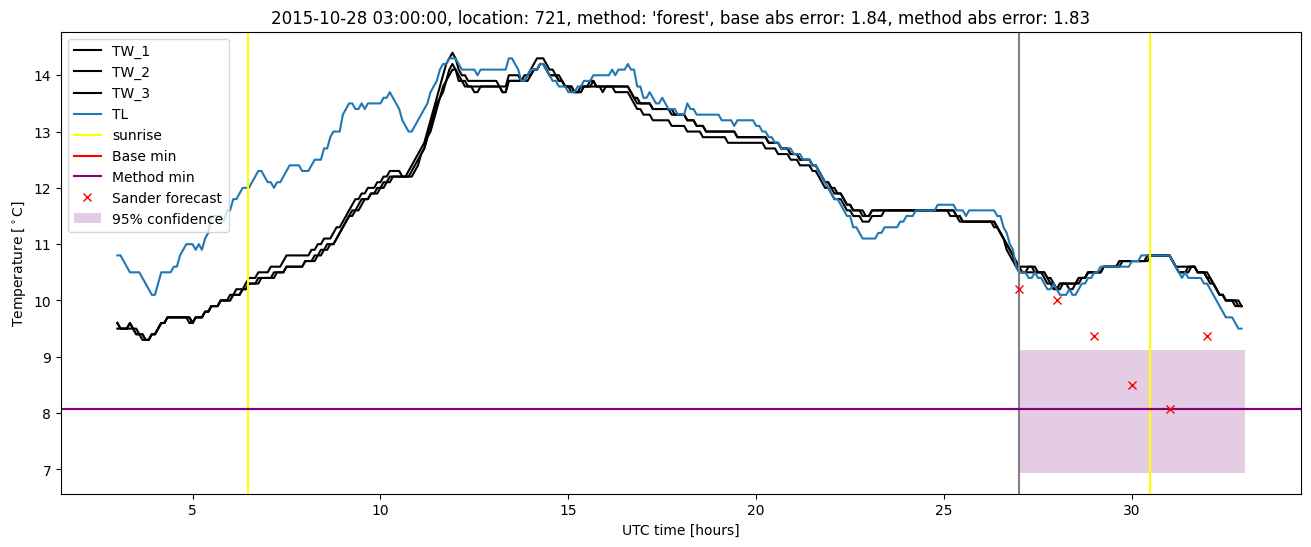
Random forest plots
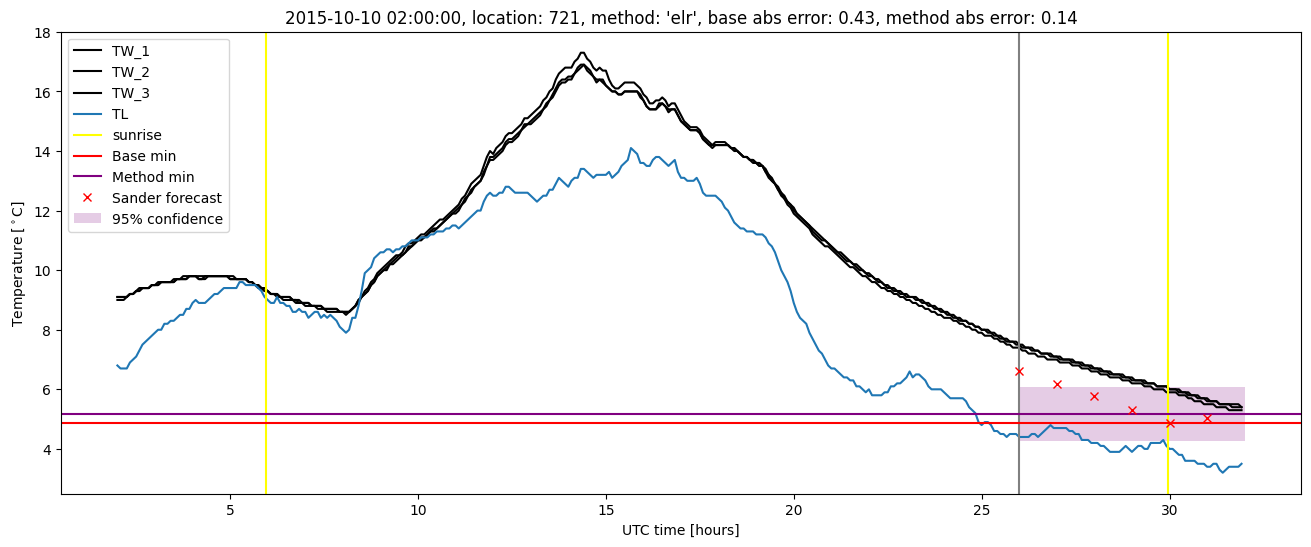
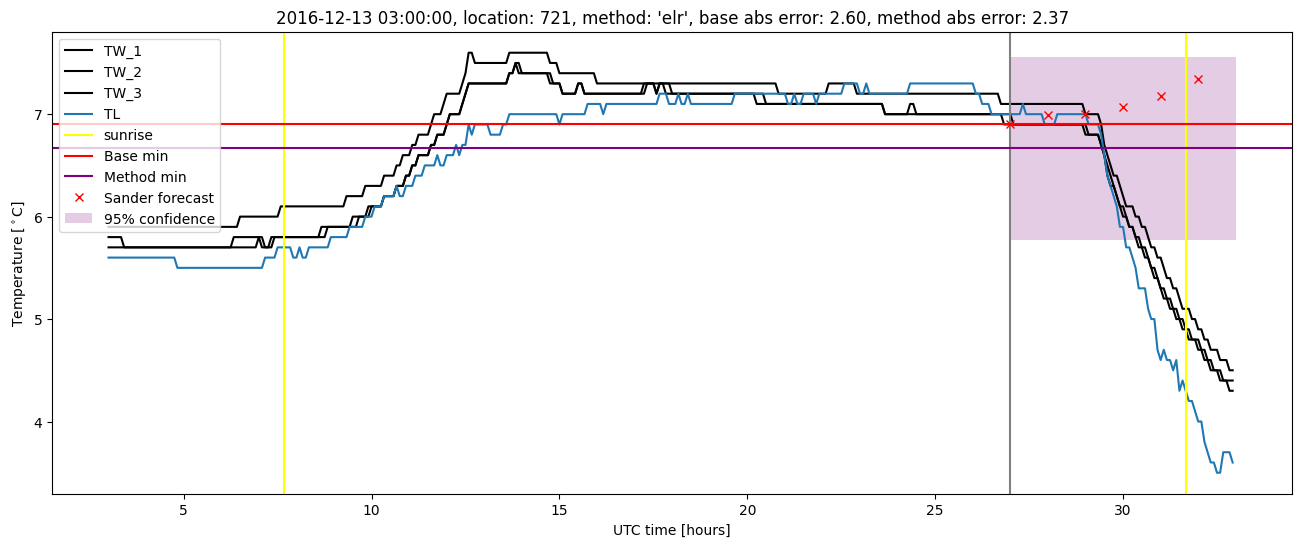
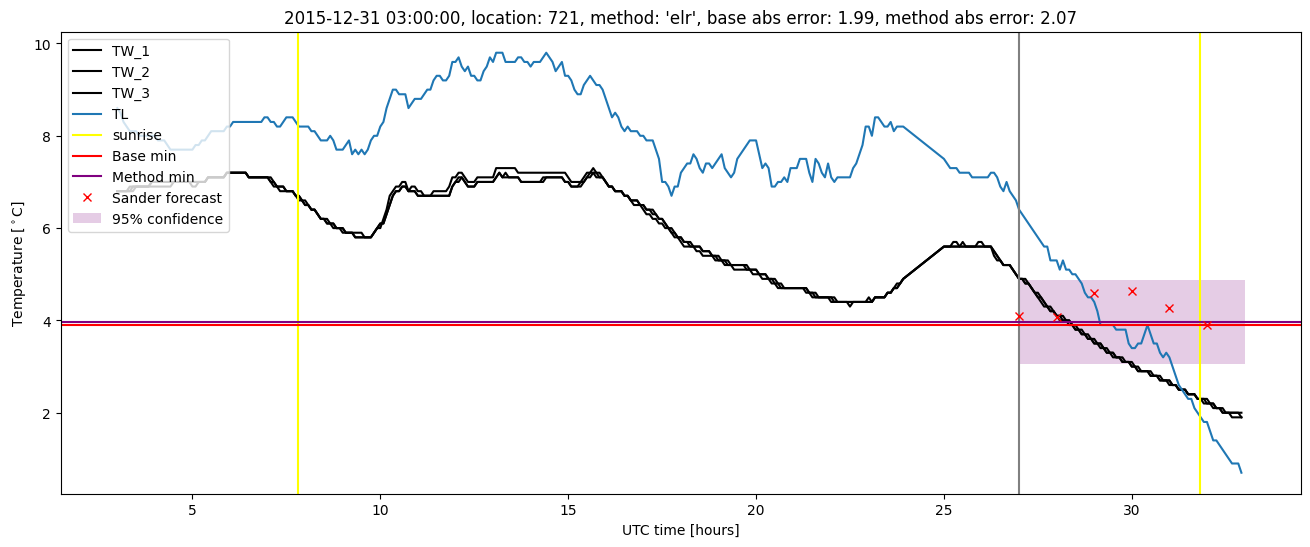
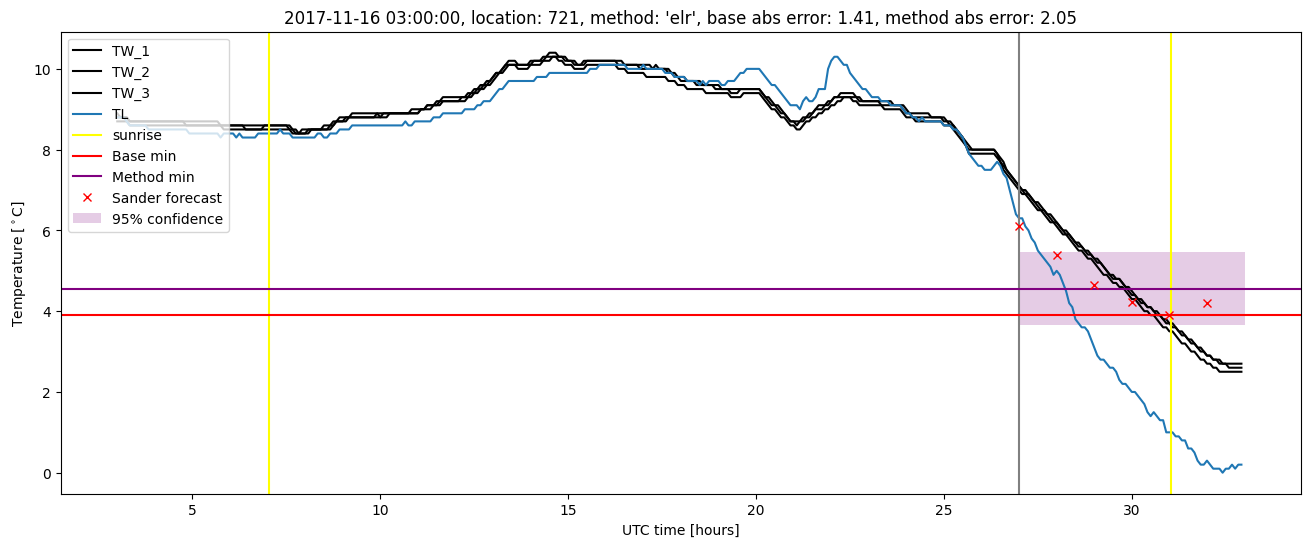
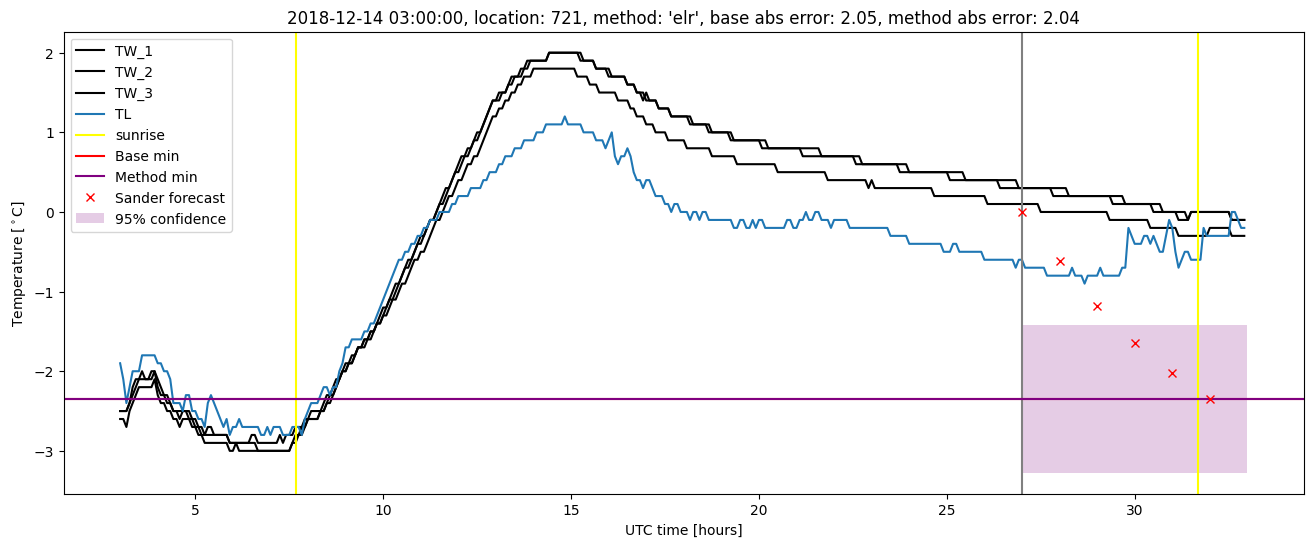
Extended logistic regression results
| names |
period |
power |
significance |
meanSquareError |
absError |
maxError |
CRPS |
IGN |
| baseline |
winter 2016 |
0.994 |
0.036 |
0.332 |
0.417 |
2.400 |
NaN |
NaN |
| elr |
winter 2016 |
0.994 |
0.036 |
0.333 |
0.429 |
2.192 |
0.527 |
3.673 |
| baseline |
winter 2017 |
0.983 |
0.091 |
0.397 |
0.445 |
2.601 |
NaN |
NaN |
| elr |
winter 2017 |
0.983 |
0.091 |
0.347 |
0.429 |
2.370 |
0.537 |
4.059 |
| baseline |
winter 2018 |
0.978 |
0.077 |
0.395 |
0.469 |
1.795 |
NaN |
NaN |
| elr |
winter 2018 |
0.971 |
0.115 |
0.366 |
0.460 |
2.053 |
0.546 |
4.026 |
| baseline |
winter 2019 |
0.984 |
0.105 |
0.282 |
0.391 |
2.054 |
NaN |
NaN |
| elr |
winter 2019 |
0.984 |
0.000e+00 |
0.298 |
0.430 |
2.044 |
0.593 |
4.205 |
| baseline |
all |
0.986 |
0.075 |
0.351 |
0.431 |
2.601 |
NaN |
NaN |
| elr |
all |
0.984 |
0.066 |
0.337 |
0.437 |
2.370 |
0.548 |
3.962 |
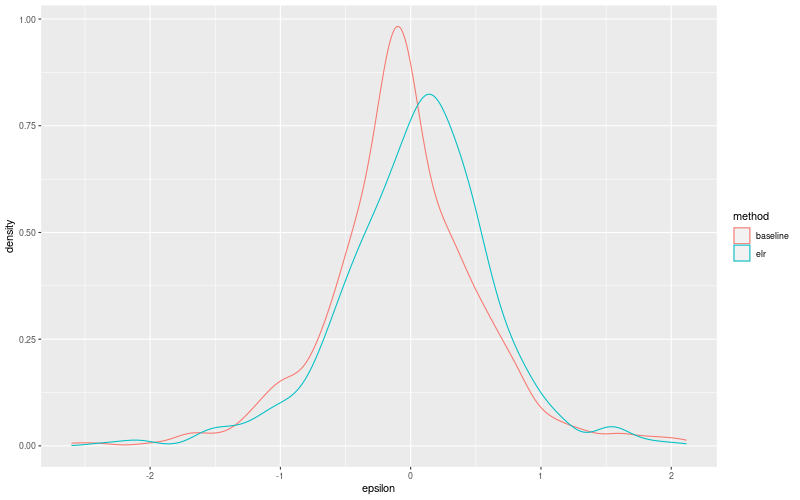
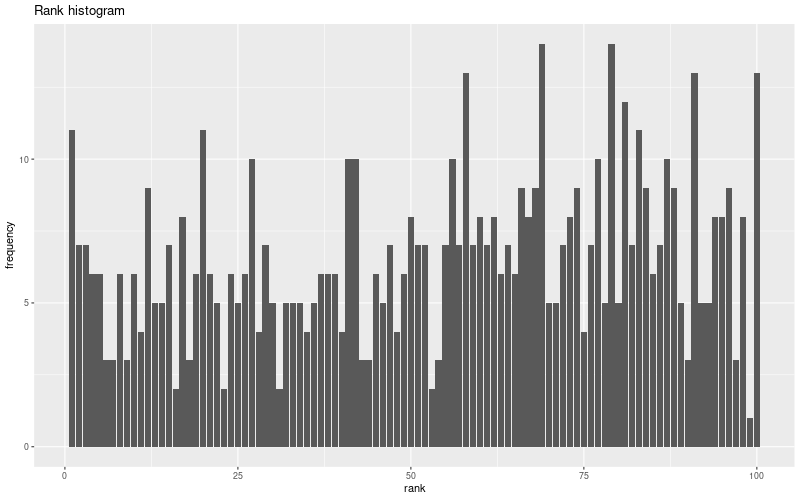
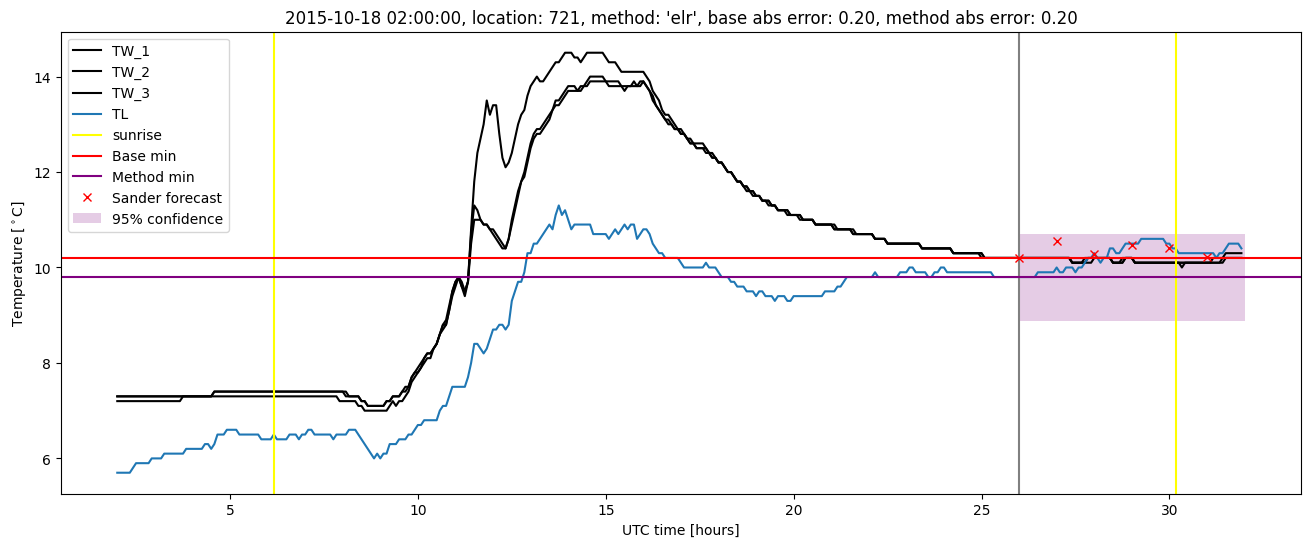
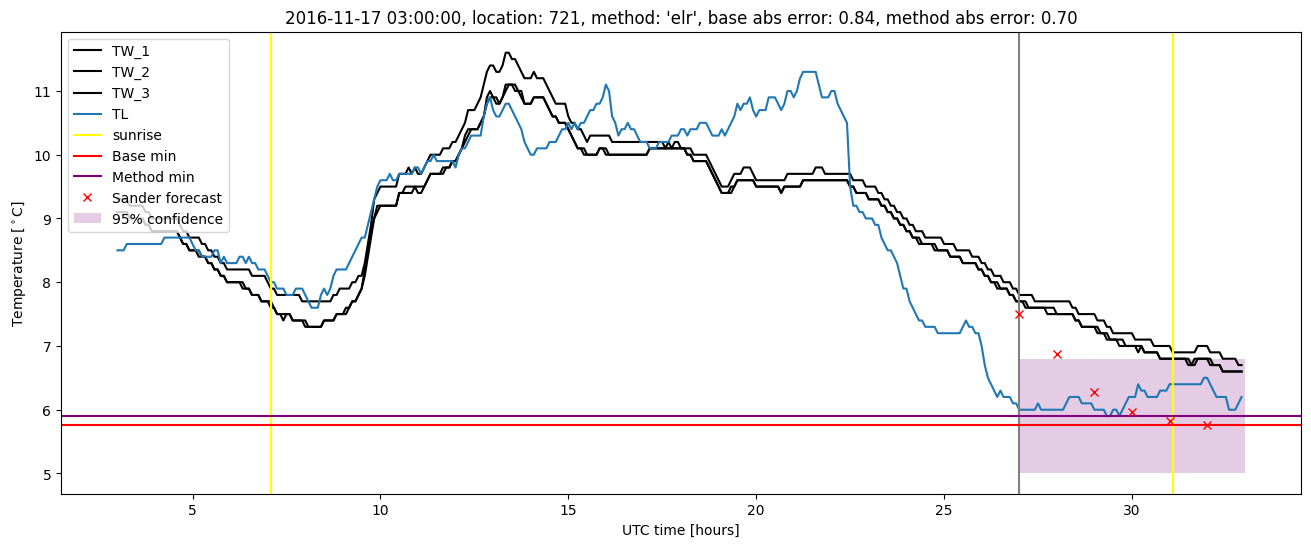
Extended logistic regression plots