GMS location: 720
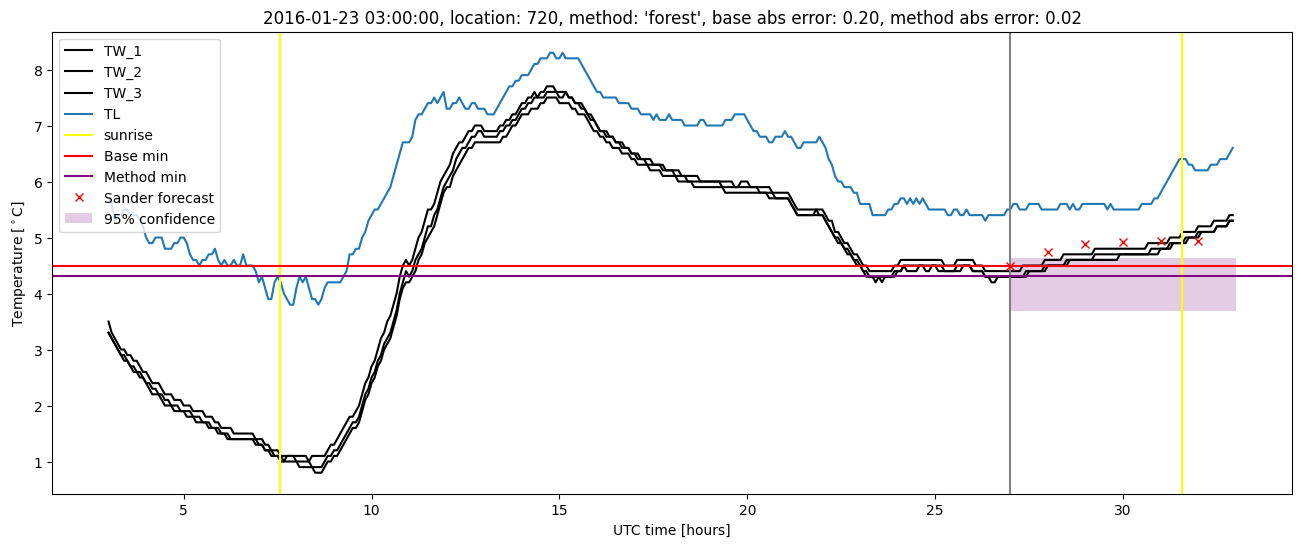
Random forest results
| names |
period |
power |
significance |
meanSquareError |
absError |
maxError |
CRPS |
IGN |
| baseline |
winter 2016 |
0.995 |
0.000e+00 |
0.318 |
0.416 |
1.968 |
NaN |
NaN |
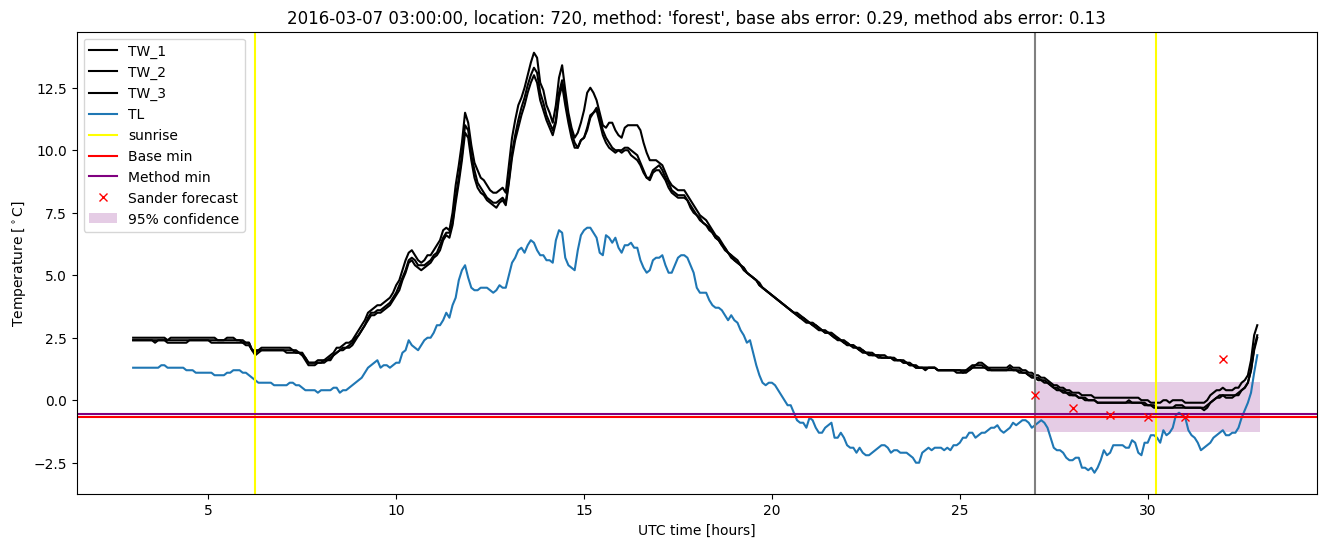
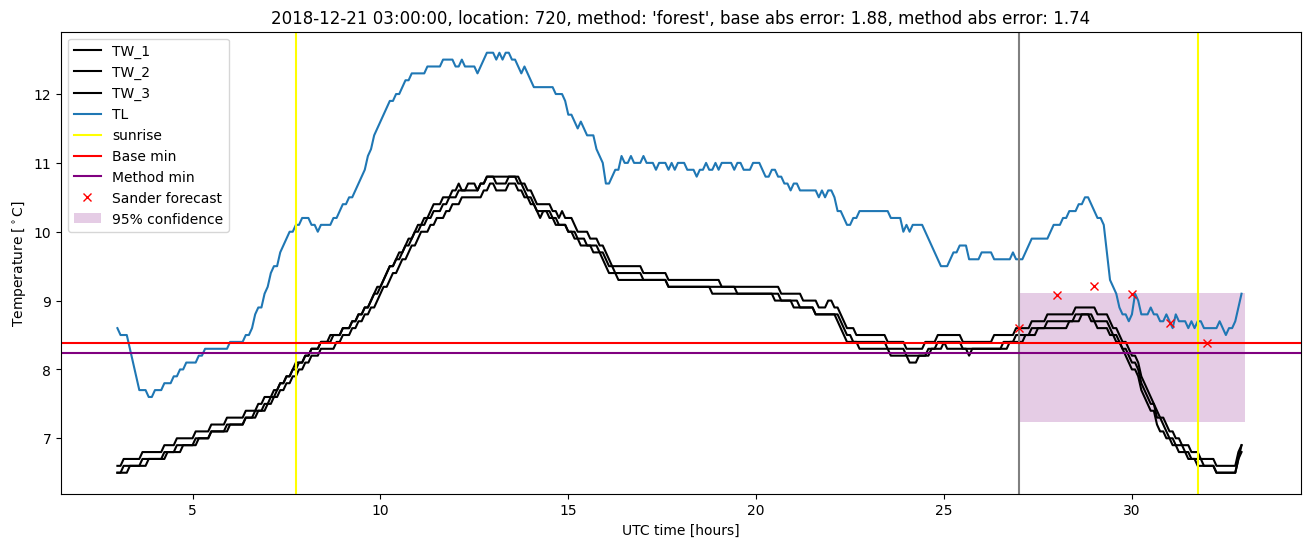
| forest |
winter 2016 |
0.989 |
0.053 |
0.297 |
0.423 |
1.724 |
0.536 |
3.758 |
| baseline |
winter 2017 |
0.983 |
0.147 |
0.401 |
0.454 |
2.375 |
NaN |
NaN |
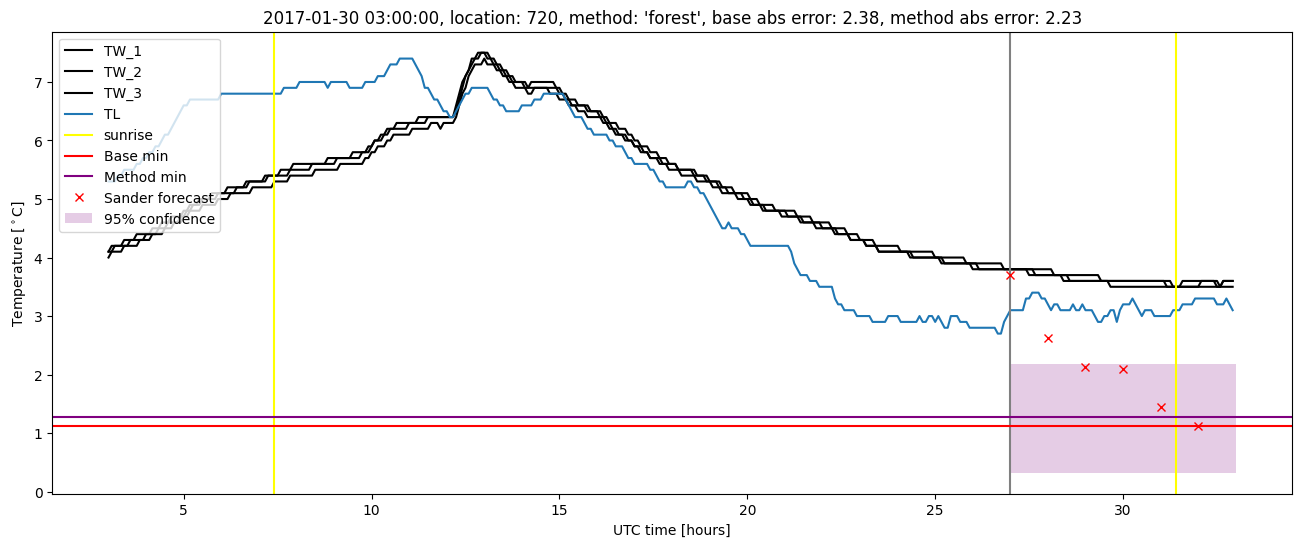
| forest |
winter 2017 |
0.966 |
0.118 |
0.322 |
0.411 |
2.233 |
0.521 |
3.716 |
| baseline |
winter 2018 |
0.985 |
0.107 |
0.400 |
0.463 |
2.062 |
NaN |
NaN |
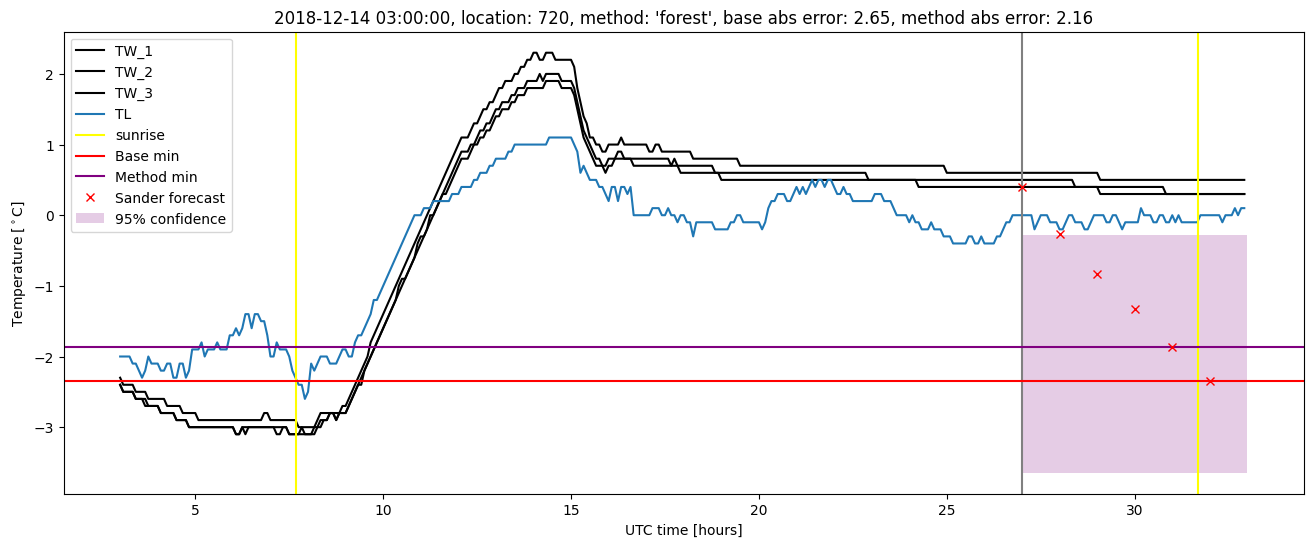
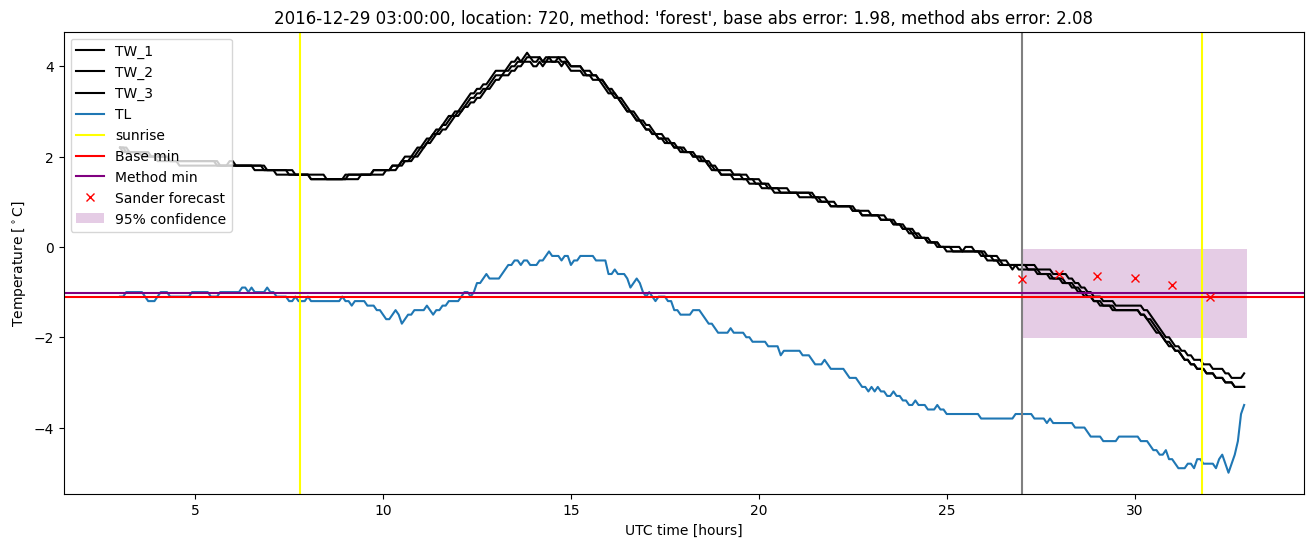
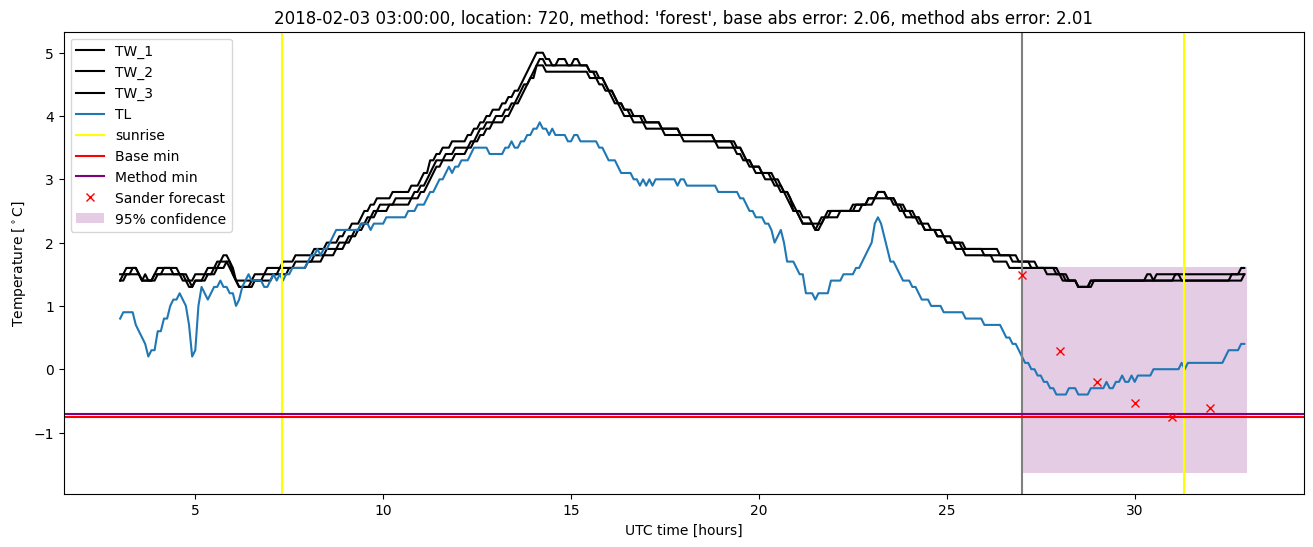
| forest |
winter 2018 |
0.970 |
0.036 |
0.341 |
0.421 |
2.008 |
0.529 |
3.132 |
| baseline |
winter 2019 |
0.986 |
0.000e+00 |
0.266 |
0.340 |
2.647 |
NaN |
NaN |
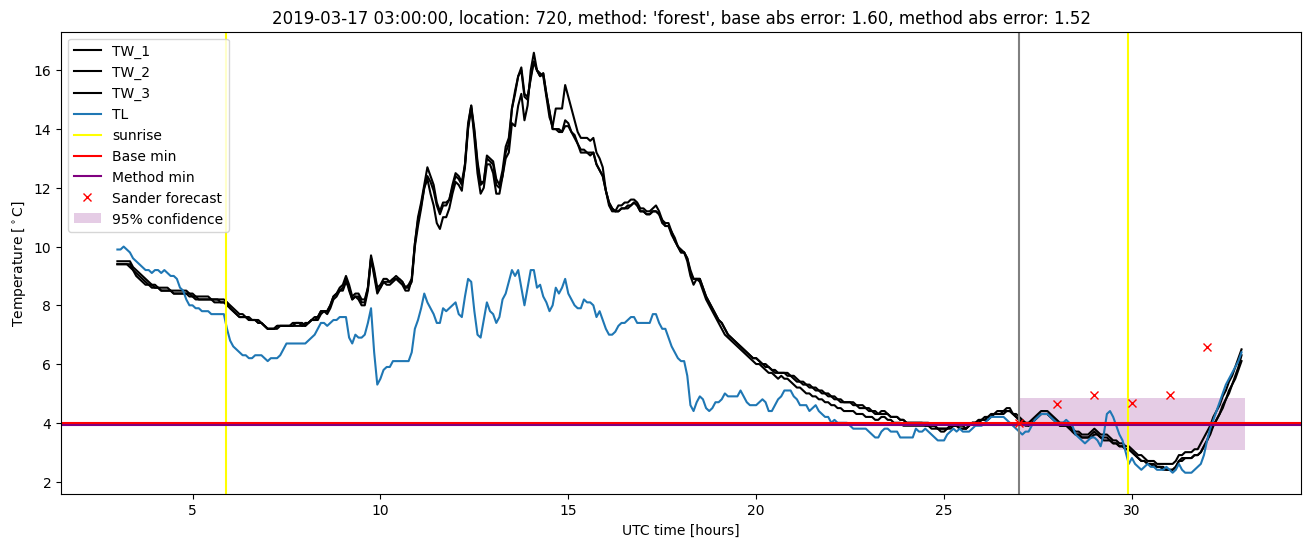
| forest |
winter 2019 |
0.986 |
0.000e+00 |
0.236 |
0.343 |
2.159 |
0.534 |
3.363 |
| baseline |
all |
0.988 |
0.081 |
0.344 |
0.418 |
2.647 |
NaN |
NaN |
| forest |
all |
0.979 |
0.061 |
0.299 |
0.401 |
2.233 |
0.530 |
3.507 |
Random forest plots
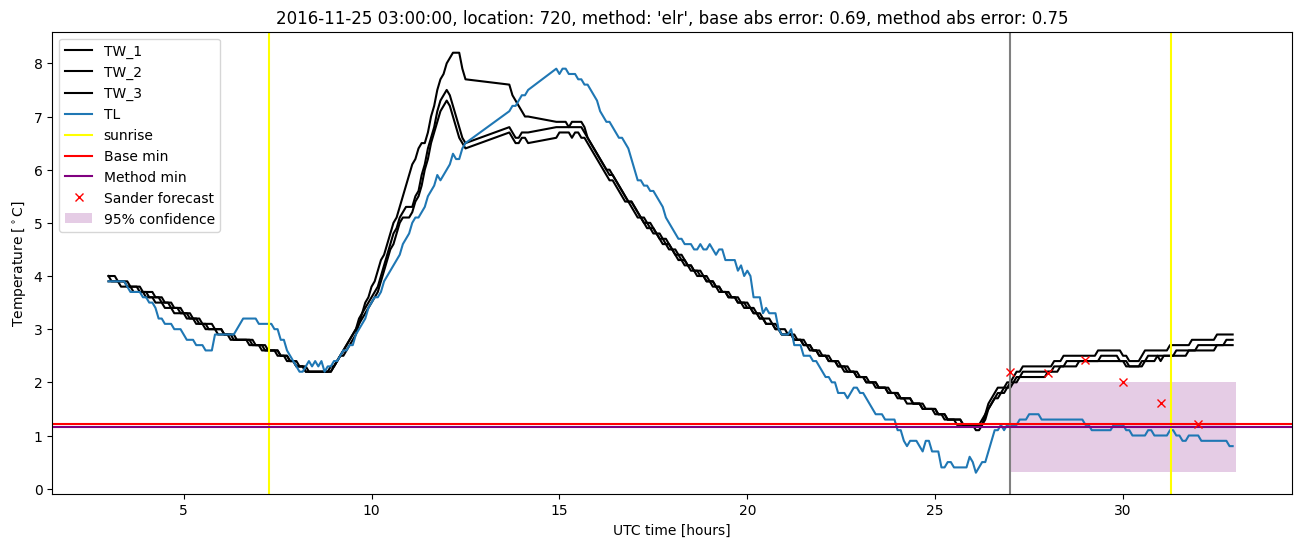
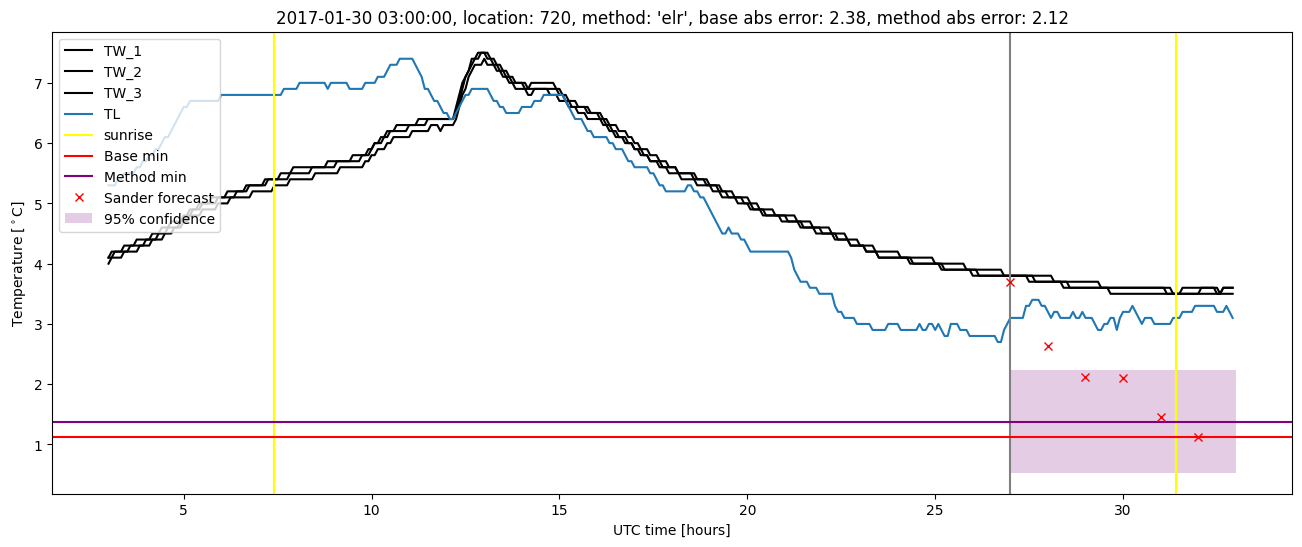
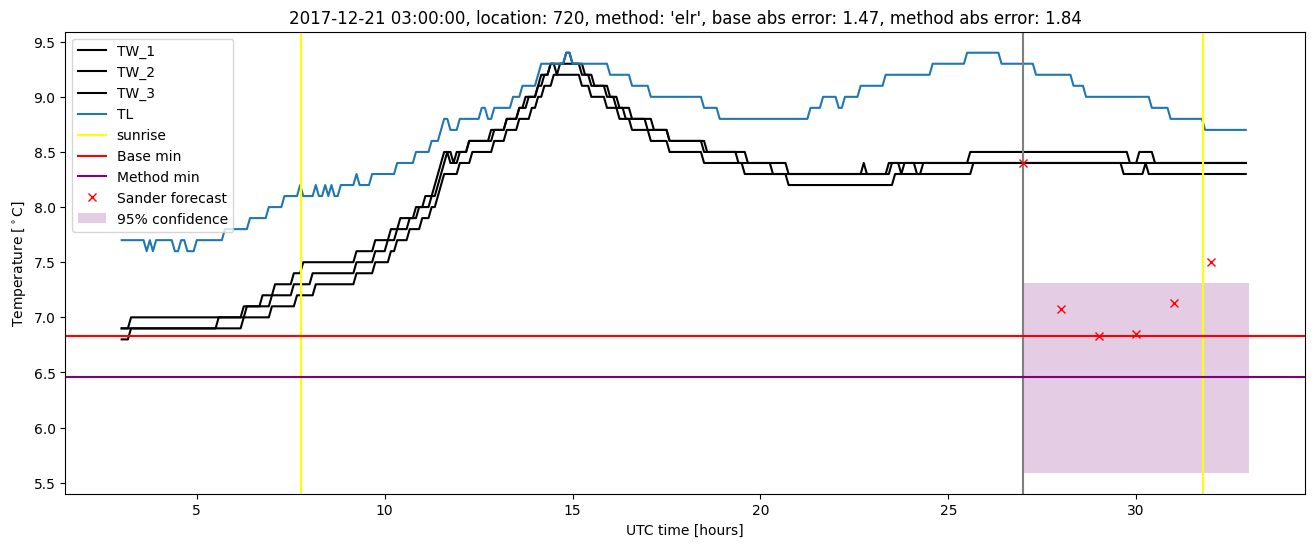
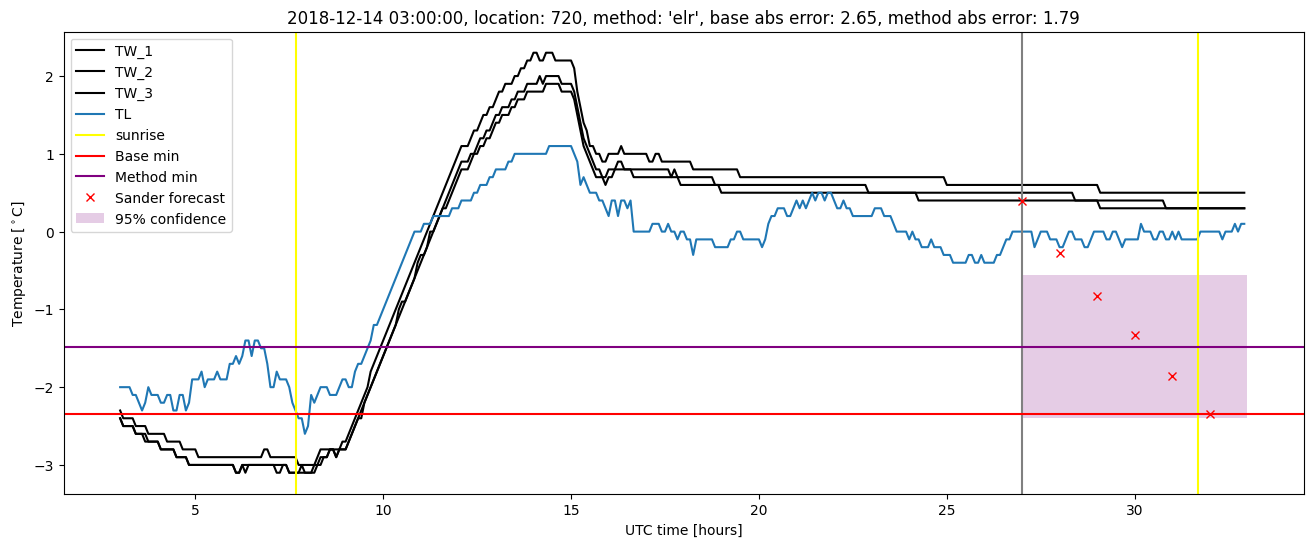
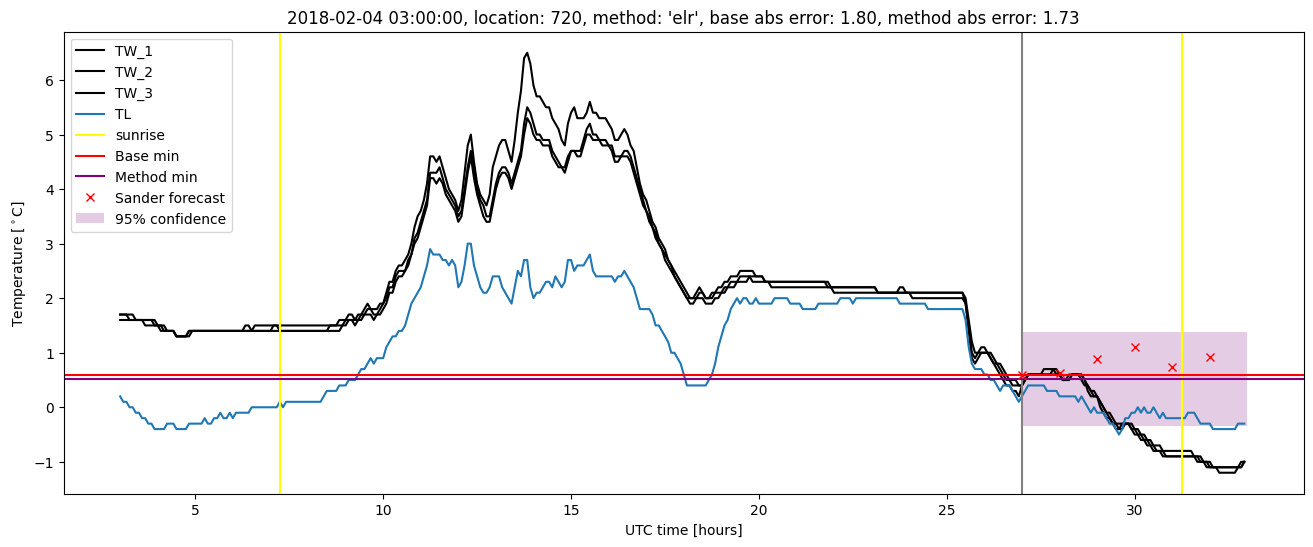
Extended logistic regression results
| names |
period |
power |
significance |
meanSquareError |
absError |
maxError |
CRPS |
IGN |
| baseline |
winter 2016 |
0.995 |
0.000e+00 |
0.318 |
0.416 |
1.968 |
NaN |
NaN |
| elr |
winter 2016 |
0.995 |
0.053 |
0.312 |
0.447 |
1.633 |
0.587 |
4.777 |
| baseline |
winter 2017 |
0.983 |
0.147 |
0.401 |
0.454 |
2.375 |
NaN |
NaN |
| elr |
winter 2017 |
0.966 |
0.118 |
0.325 |
0.423 |
2.123 |
0.567 |
5.354 |
| baseline |
winter 2018 |
0.985 |
0.107 |
0.400 |
0.463 |
2.062 |
NaN |
NaN |
| elr |
winter 2018 |
0.985 |
0.071 |
0.369 |
0.439 |
1.843 |
0.599 |
5.517 |
| baseline |
winter 2019 |
0.986 |
0.000e+00 |
0.266 |
0.340 |
2.647 |
NaN |
NaN |
| elr |
winter 2019 |
0.986 |
0.056 |
0.225 |
0.344 |
1.787 |
0.542 |
3.729 |
| baseline |
all |
0.988 |
0.081 |
0.344 |
0.418 |
2.647 |
NaN |
NaN |
| elr |
all |
0.984 |
0.081 |
0.308 |
0.415 |
2.123 |
0.575 |
4.835 |
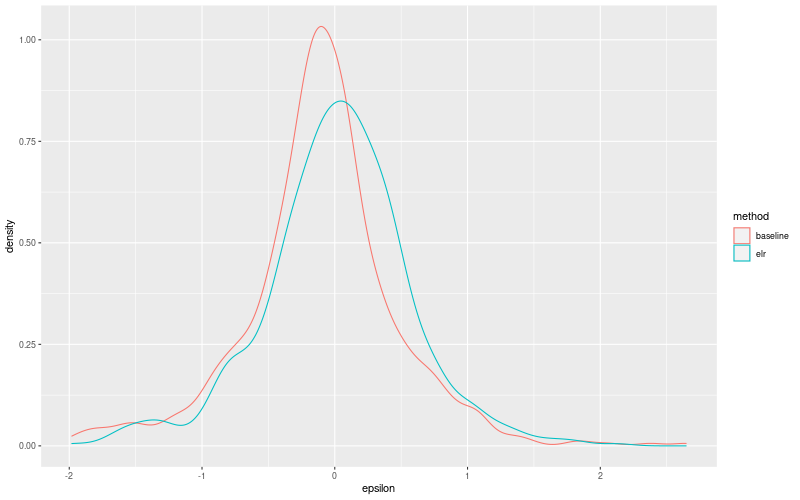
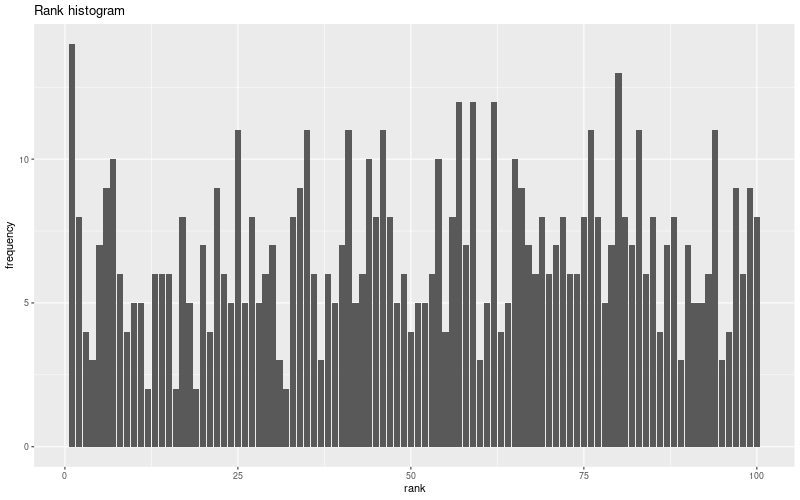
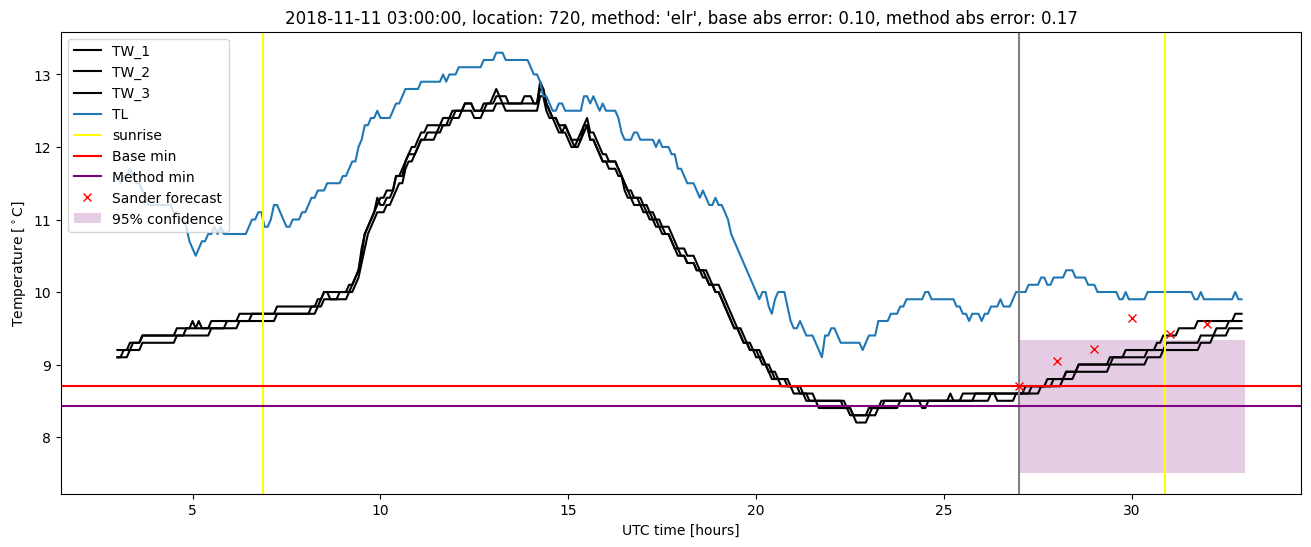
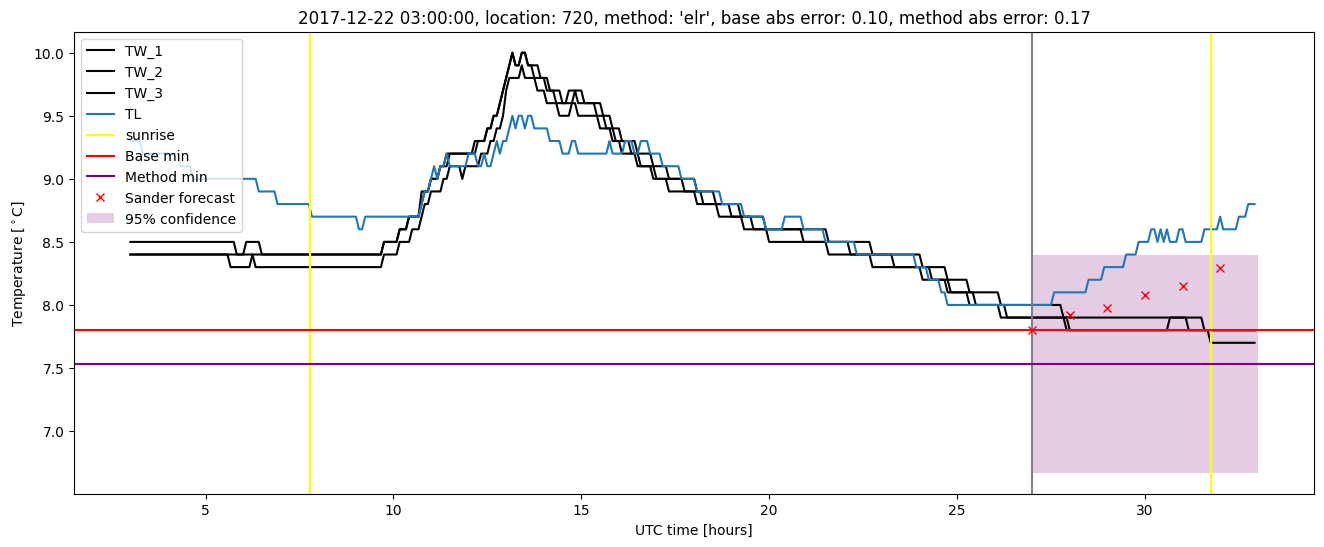
Extended logistic regression plots